Free printable practice
Data Graphing Practice Activities
Class 5 maths worksheets for interpreting, comparing and summarising data using graphs, averages, probability and fraction-based displays.
Explore Data Graphing
Free printable worksheet PDFs
Preview every available page, then download the free worksheet PDF for home, homeschool, tutoring, or classroom practice.
Preview the exact activity before downloading it.
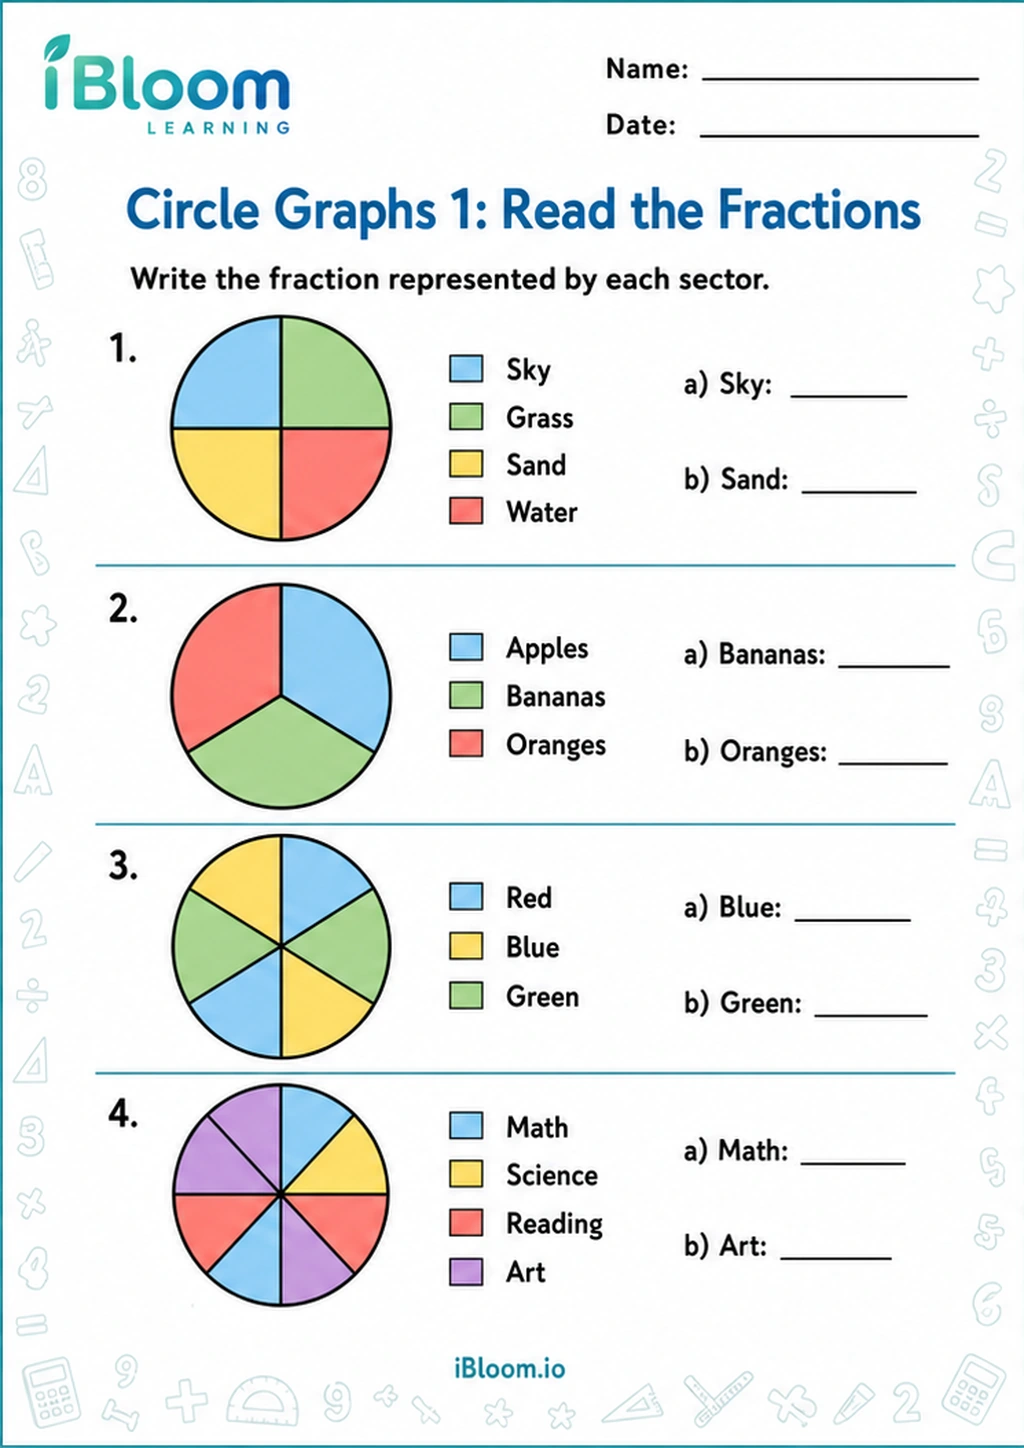 Circle Graphs 1: Read the FractionsClass 5 printable practice for Circle Graphs and Fractions.Class 5Free PDF preview
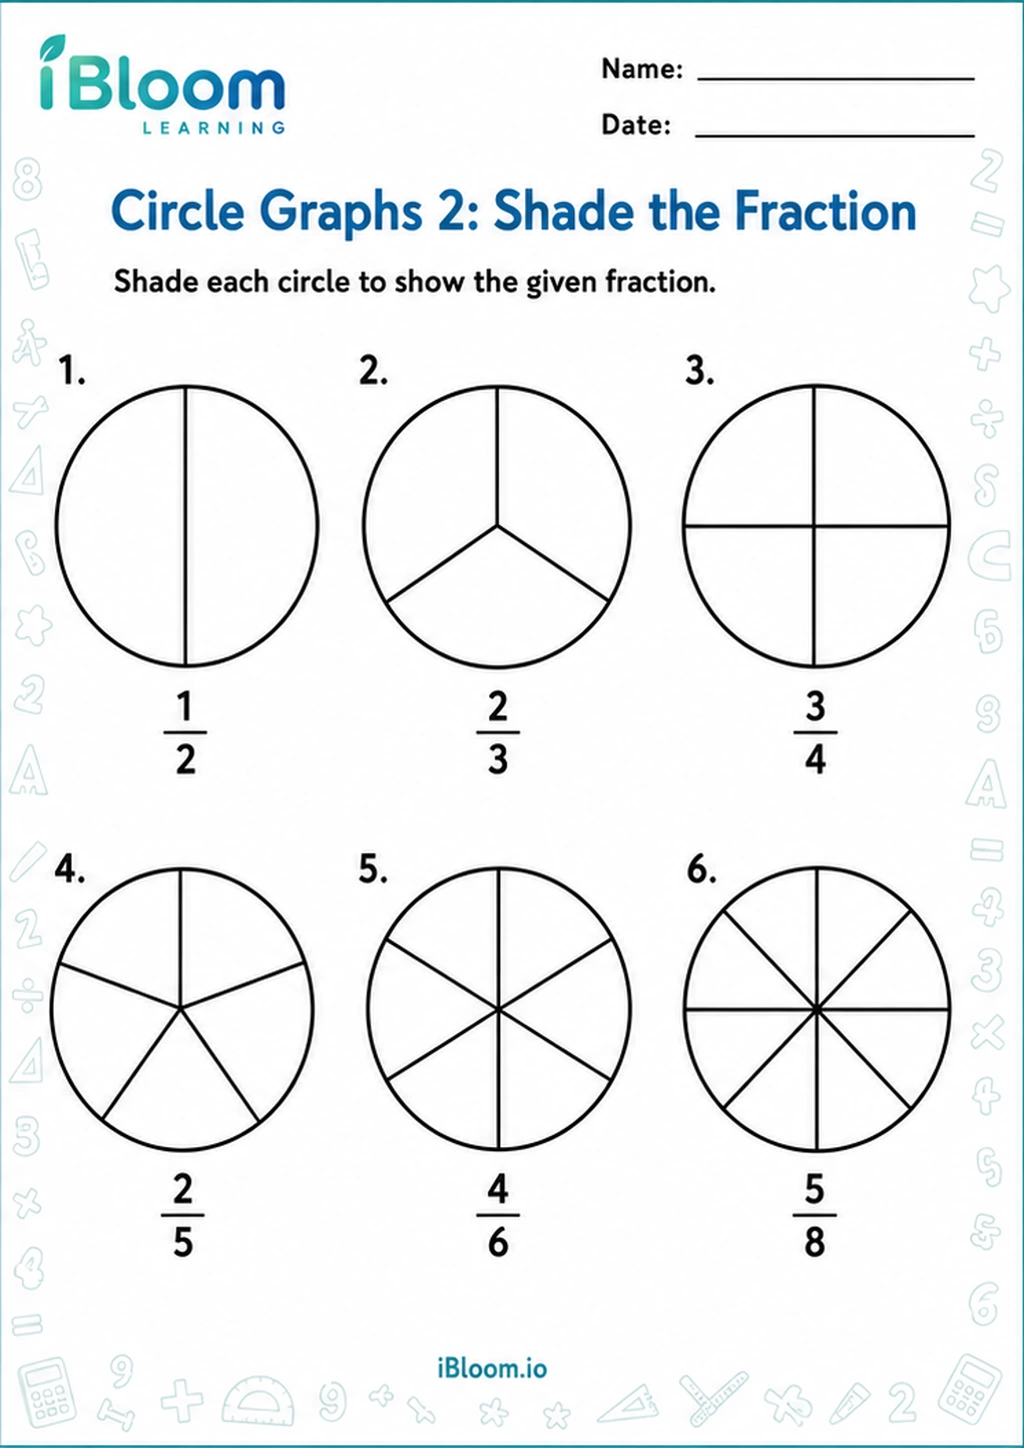 Circle Graphs 2: Shade the FractionClass 5 printable practice for Circle Graphs and Fractions.Class 5Free PDF preview
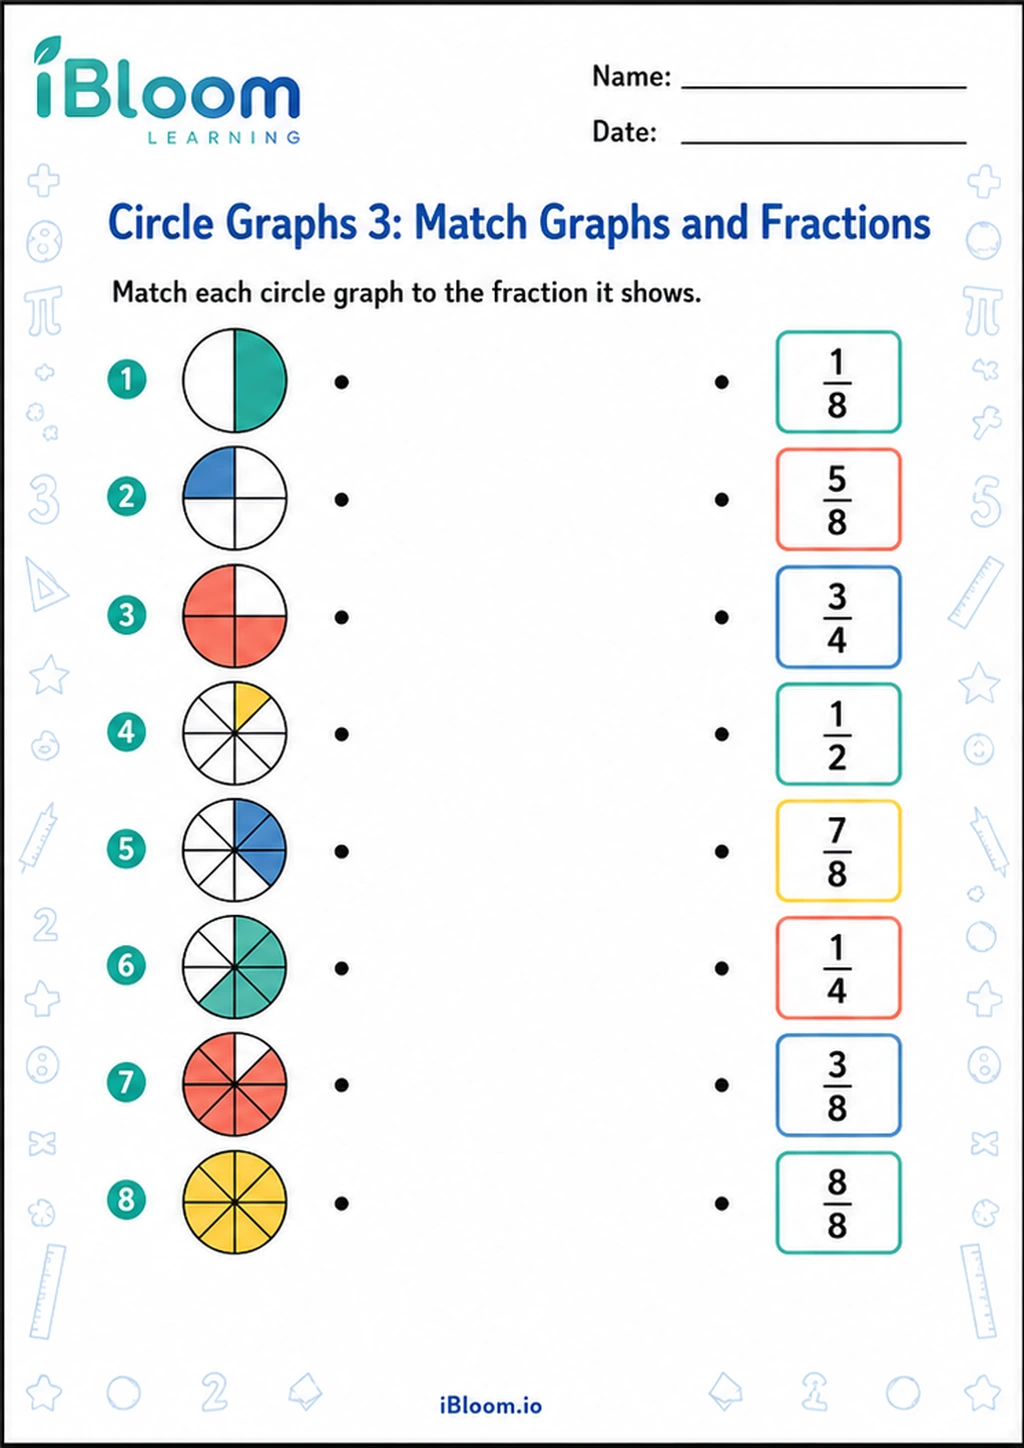 Circle Graphs 3: Match Graphs and FractionsClass 5 printable practice for Circle Graphs and Fractions.Class 5Free PDF preview
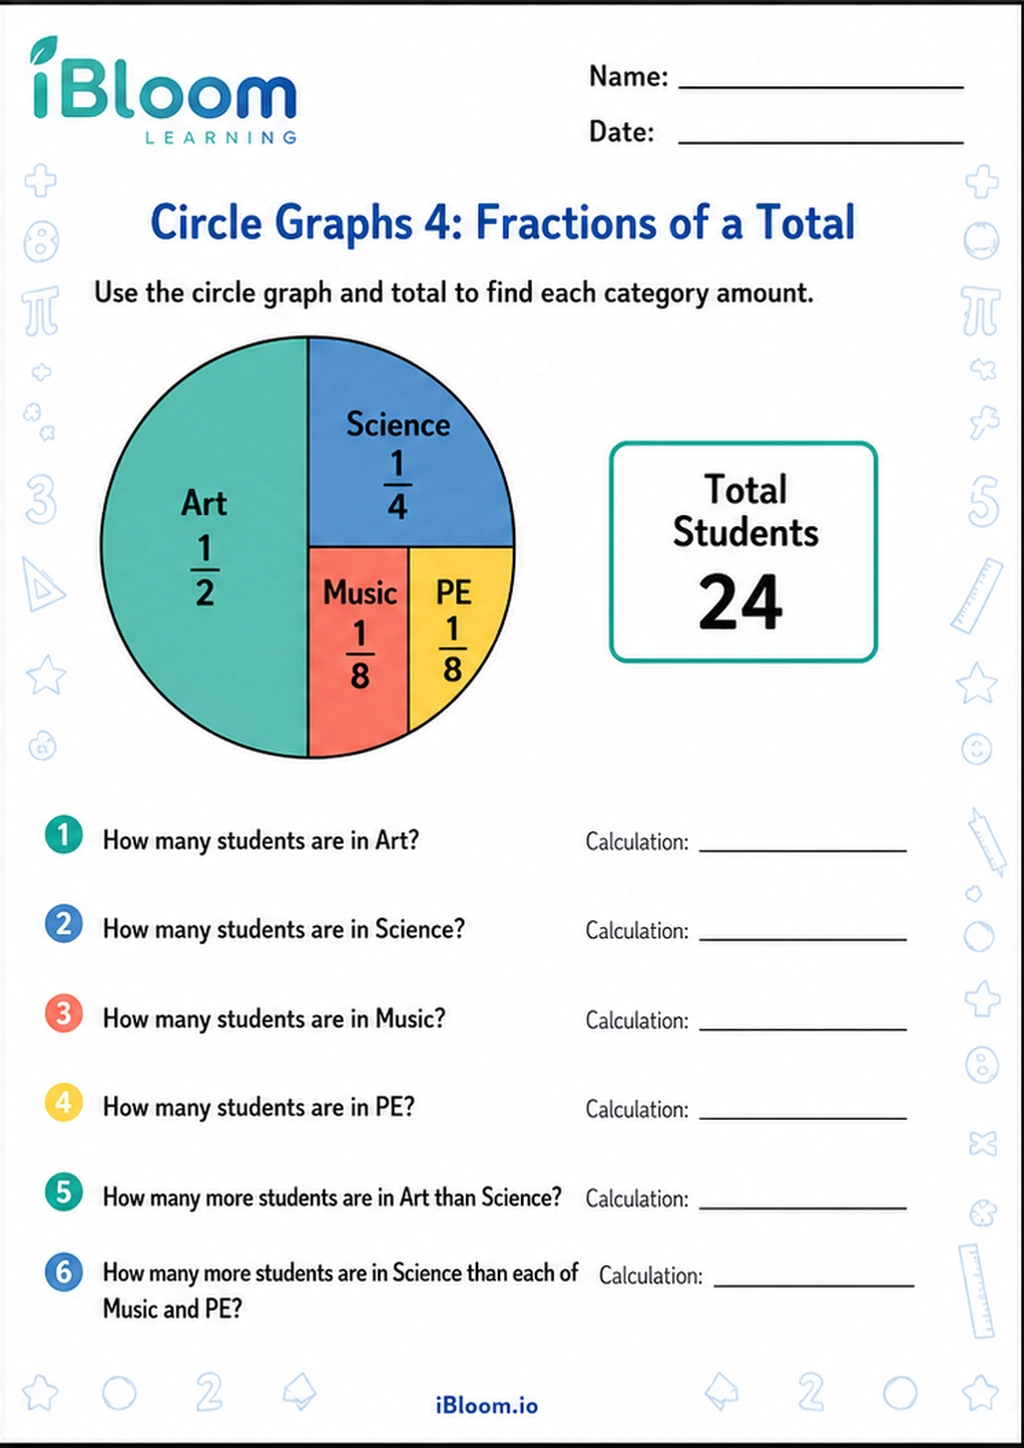 Circle Graphs 4: Fractions of a TotalClass 5 printable practice for Circle Graphs and Fractions.Class 5Free PDF preview
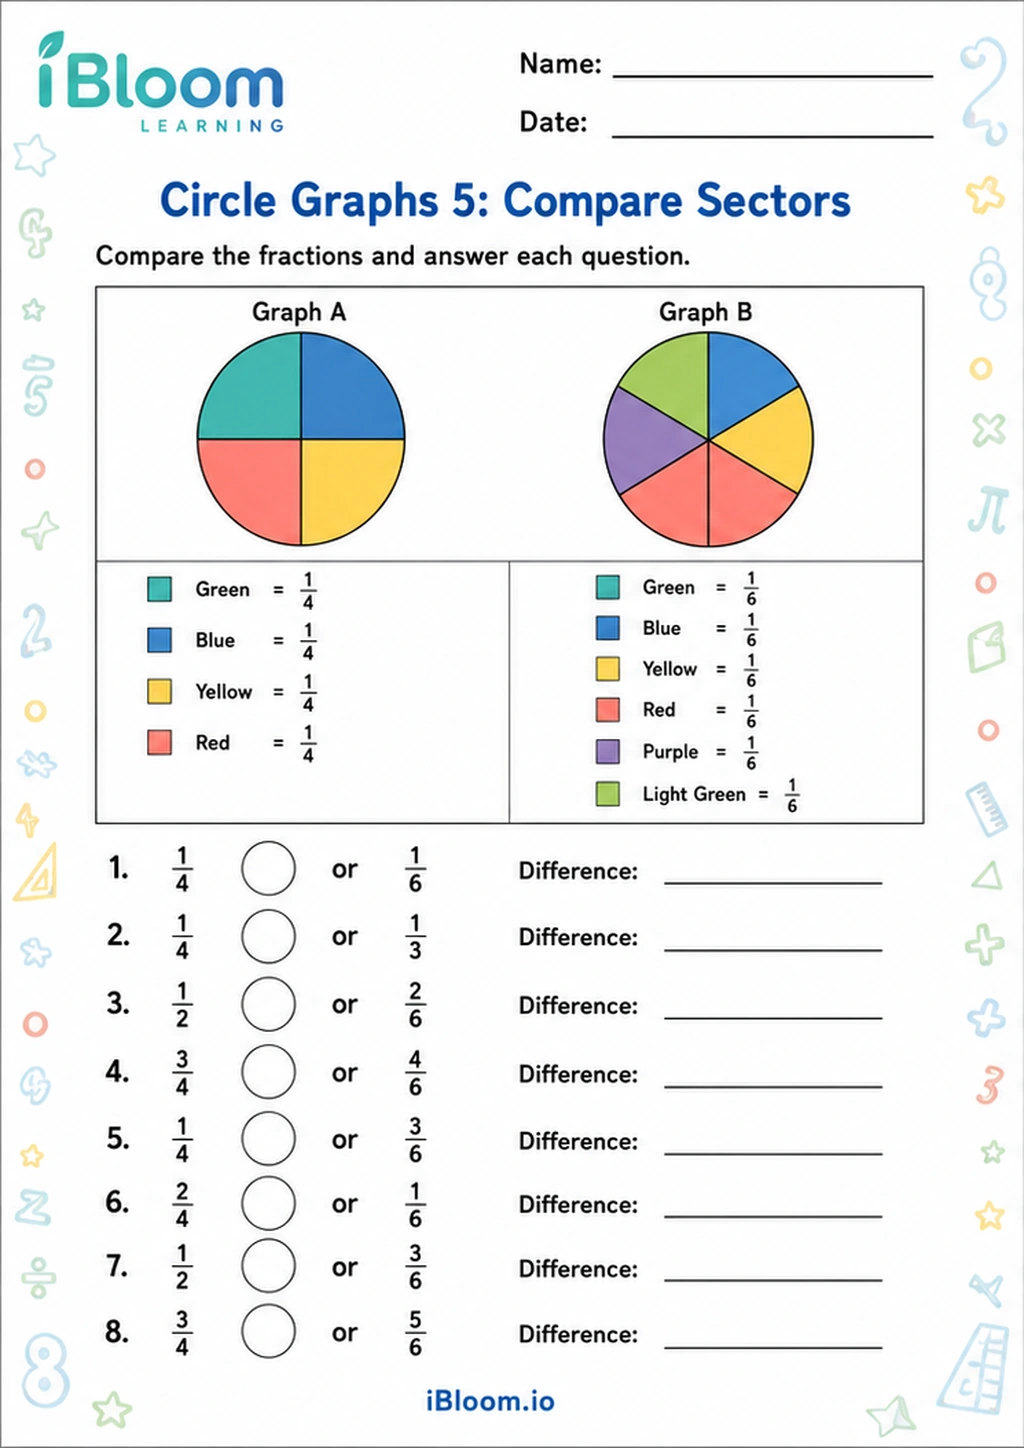 Circle Graphs 5: Compare SectorsClass 5 printable practice for Circle Graphs and Fractions.Class 5Free PDF preview
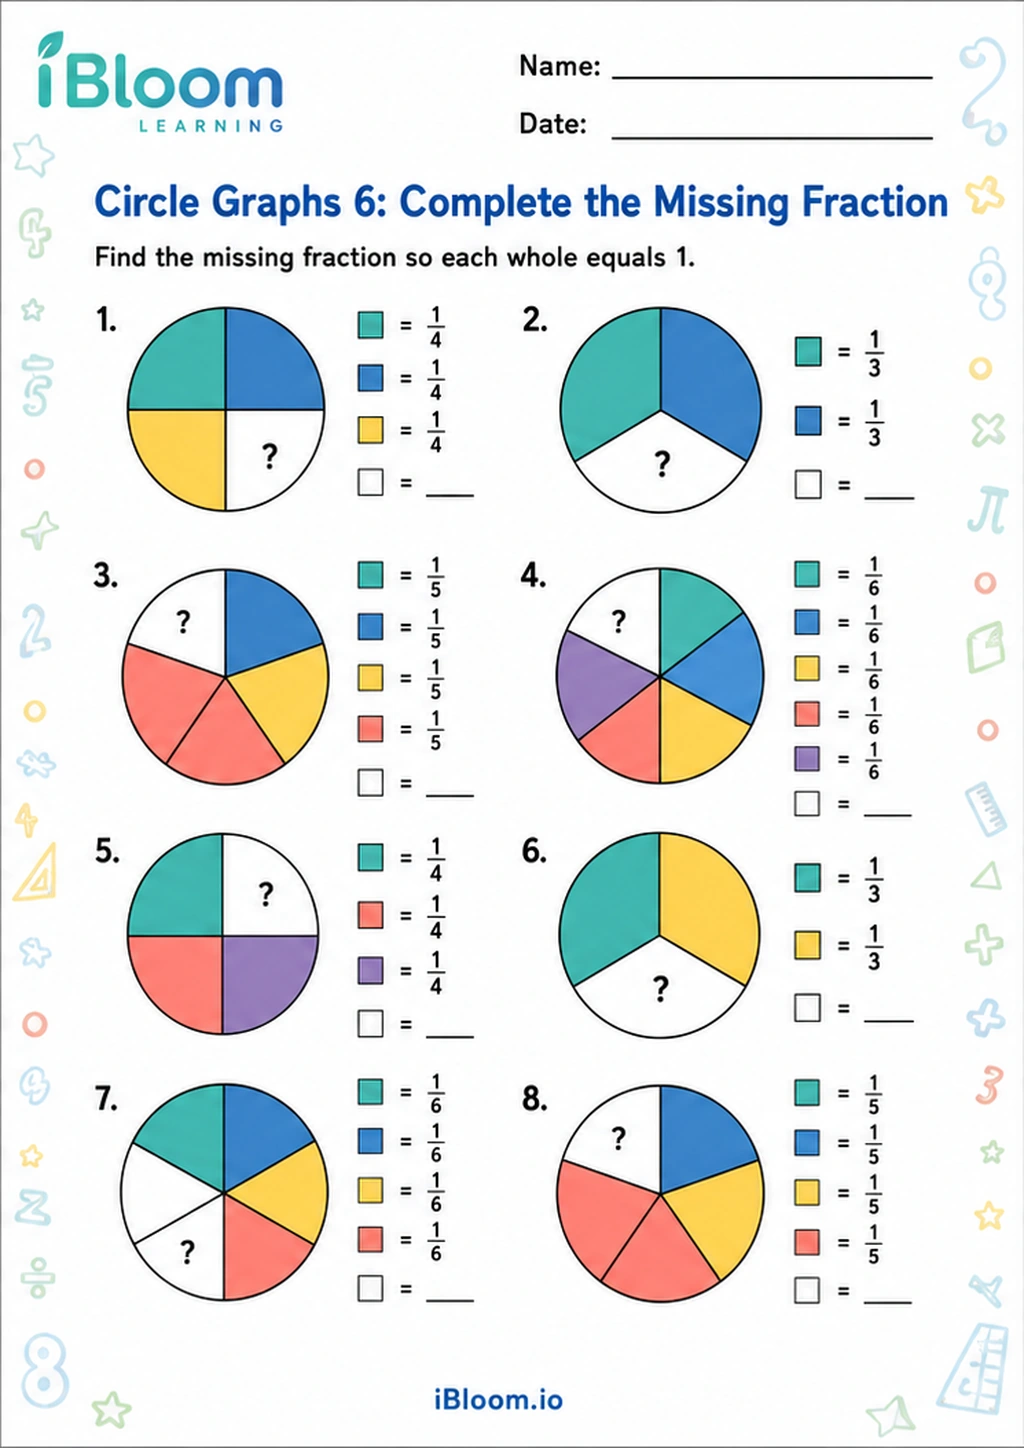 Circle Graphs 6: Complete the Missing FractionClass 5 printable practice for Circle Graphs and Fractions.Class 5Free PDF preview
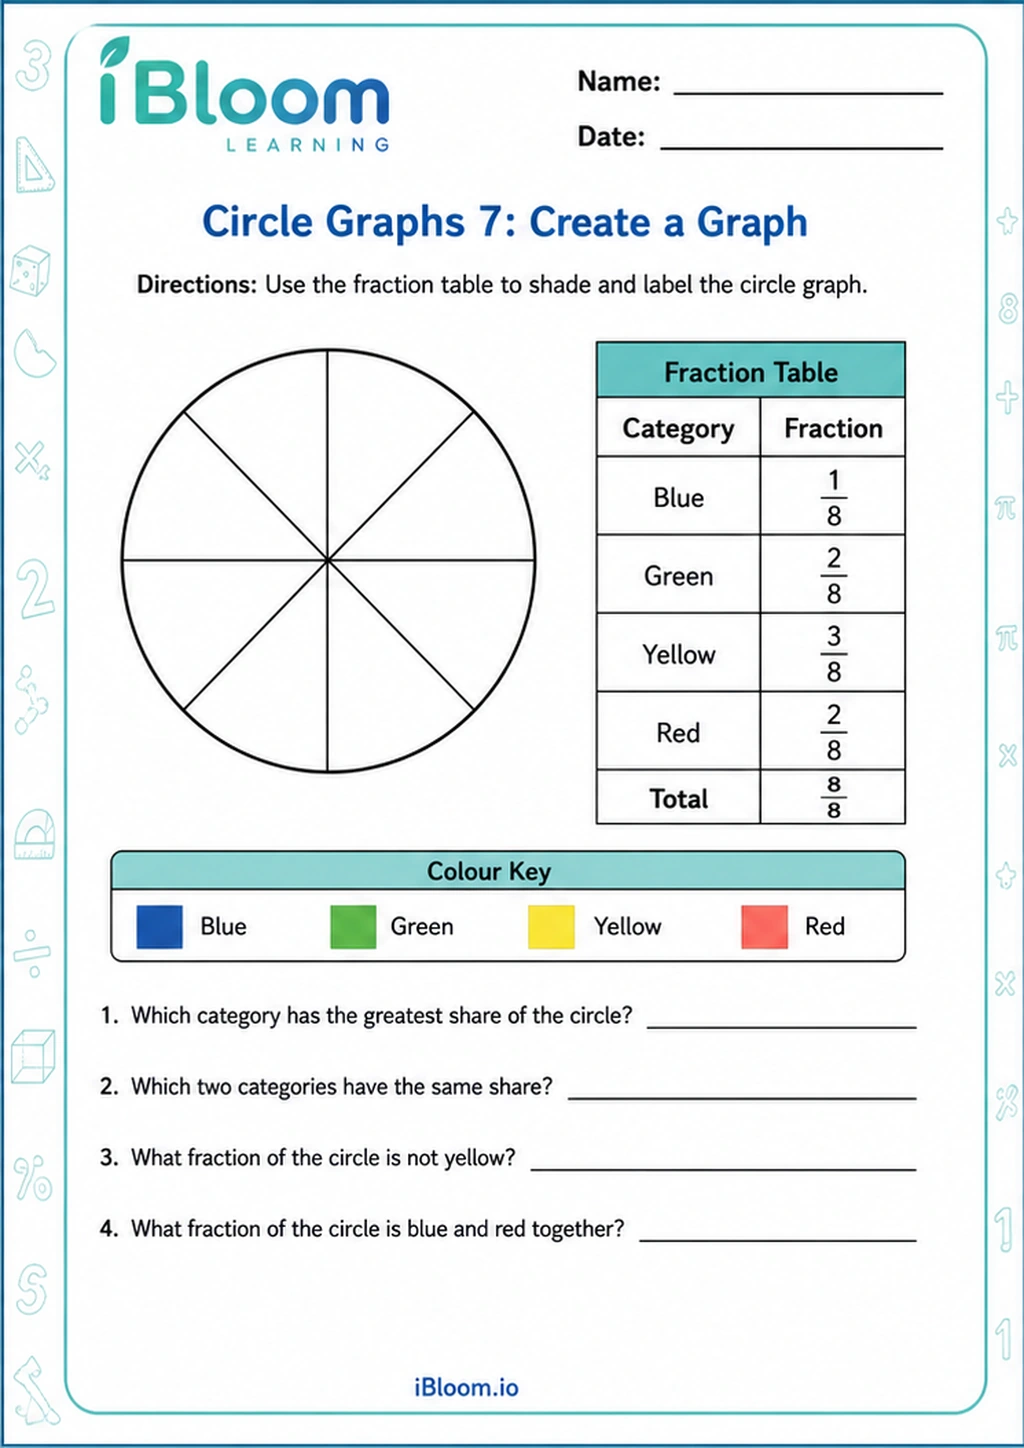 Circle Graphs 7: Create a GraphClass 5 printable practice for Circle Graphs and Fractions.Class 5Free PDF preview
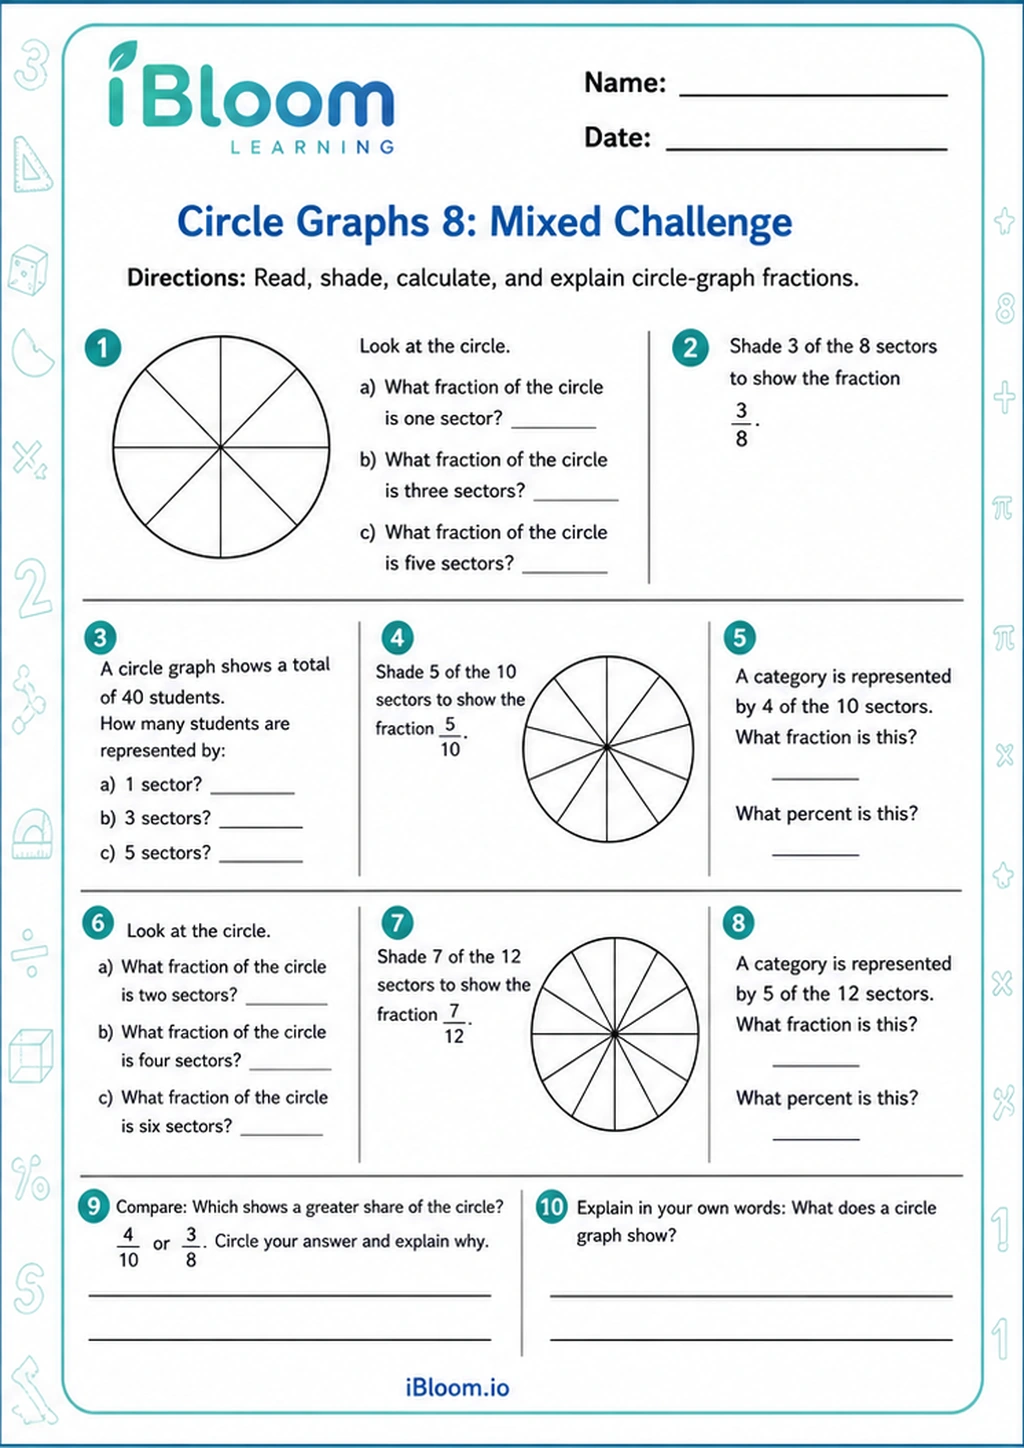 Circle Graphs 8: Mixed ChallengeClass 5 printable practice for Circle Graphs and Fractions.Class 5Free PDF preview
Practice that builds confidence
Building from reading to reasoning
These Class 5 data graphing worksheets help children move from simply reading a graph to explaining what the data shows. They practise double line graphs, double bar graphs, line plot fractions, stem and leaf plots, circle graph fractions, probability, mean, median, mode and range.
The printable activities include tables, scales, labelled axes, survey results and data sets where children answer questions, compare values, calculate averages and choose sensible summaries. The focus is on accurate reading, clear reasoning and maths vocabulary used in Indian classrooms.
Children first learn to notice the title, labels, units, key and scale before answering any question. In double bar graphs, they compare two groups side by side; in double line graphs, they track change across the same intervals. Stem and leaf plots and line plot fractions strengthen careful counting, ordering and interpretation of repeated values.

Averages and spread in data
The worksheets connect graphs with summary numbers. Children calculate mean by sharing the total equally, find median by arranging values in order, identify mode as the most common value and use range to describe spread. Related practice with range, median and mode helps them see why one number can describe a data set, but not tell the whole story.
Fractions, circles and probability
Circle graph fraction tasks ask children to connect parts of a whole with simple fractional sections. Probability activities use familiar outcomes and language such as certain, likely, unlikely and impossible, helping children reason from organised data rather than guessing.
Parent routine for home practice
At home, use one small real data set: daily temperatures, fruits eaten in a week or runs scored in matches. Ask your child to make a tally, choose a graph type, write two comparison sentences and then find the mean or mode where suitable. End by asking, “What is the data trying to tell us?”

Classroom uses for teachers
Teachers can use these sheets for maths centres, class 5 revision, small-group reteaching or quick checks after a graphing lesson. Pair work works well: one child reads the graph aloud while the other justifies the answer using labels, scale and data values.

Common errors and a child-friendly strategy
Watch for skipped scales, reading between grid lines incorrectly, forgetting to order numbers before finding the median, and confusing mode with mean. A useful strategy is “T-L-S-A”: read the Title, check the Labels, study the Scale, then Answer. Why iBloom worksheets help: each set mixes visual data, calculation and explanation so children practise not only getting an answer, but proving it from the graph or data set.
Free printable PDF download
Use this class 5 data graphing worksheet page to preview the activity, print it, or download it as a PDF for quick practice. It works well for homework, homeschool lessons, tutoring, morning work, revision, and classroom centers.
Answers and answer key support
After the child completes the worksheet independently, parents and teachers can use the answer support or answer key information to check the work, review mistakes, and choose the next practice step.
Helpful answers
Frequently asked questions
What graph types are included in these Class 5 data graphing worksheets?
The collection includes practice with double line graphs, double bar graphs, line plot fractions, circle graph fractions and stem and leaf plots, along with questions based on tables and organised data sets.
Do these worksheets cover mean, median, mode and range?
Yes. Children practise finding mean, median, mode and range from lists of numbers and from data connected to graphs, so they learn both the calculation and the meaning of each measure.
How can I help my child avoid mistakes while reading graphs?
Ask your child to read the title first, then check the labels, units, key and scale before answering. Many errors happen when children count boxes without noticing that the scale may go up by 2, 5, 10 or another interval.
Are probability activities included with data graphing?
Yes. Probability tasks help children use organised information to describe outcomes with words such as certain, likely, unlikely and impossible, and to make simple comparisons between chances.
Can teachers use these sheets for classroom revision?
Yes. The worksheets work well for revision, maths centres, homework, small-group support and quick assessment after lessons on data handling, averages and graph interpretation.
Is this class 5 data graphing worksheet free?
Yes. You can preview it for free and use the printable worksheet for home or classroom practice.
Can I download this class 5 data graphing worksheet as a PDF?
Yes. Use the worksheet download option to save a printable PDF, or print the worksheet directly from the page.
Does this class 5 data graphing worksheet include answers or an answer key?
When the activity has fixed answers, iBloom includes answer support so parents and teachers can check the completed worksheet.