Free printable practice
Graphing Practice Activities
Printable preschool and kindergarten graphing worksheets for reading, coloring, and creating simple bar charts from picture data.
Explore Graphing
Practice that builds confidence
Building early graph sense
These preschool and kindergarten graphing worksheets help children turn simple picture information into easy-to-read bar graphs. Learners count objects, color bars, compare groups, and answer questions such as which has more, fewer, or the same.
The printable activities include bar graphs, bar charts, create-your-own chart pages, and picture-based tasks that connect counting with early addition ideas. Children practise organizing data in a clear visual way before moving to more formal graph work.
Graphing begins with sorting and counting. In these worksheets, children look at familiar pictures, count how many are in each group, and show that amount on a bar chart. The focus is not on complicated numbers; it is on understanding that each colored box or space represents one object. This helps children see data as something they can collect, organize, and talk about.
Reading bar graphs and bar charts
The bar graph pages guide learners to match a category with a bar, count the filled spaces, and compare the results. Children practise vocabulary such as graph, chart, bar, category, total, more, fewer, most, least, and equal. Questions may ask them to identify the tallest bar, find two groups with the same number, or count how many objects are shown altogether.
Creating charts from pictures
Create bar chart activities move children from reading data to representing it. A child might count pictures of animals, toys, shapes, or classroom objects, then color the matching number of boxes in each row or column. Picture-based addition object pages also support early number sentences because children can combine groups they have already counted on the chart.
A simple parent routine
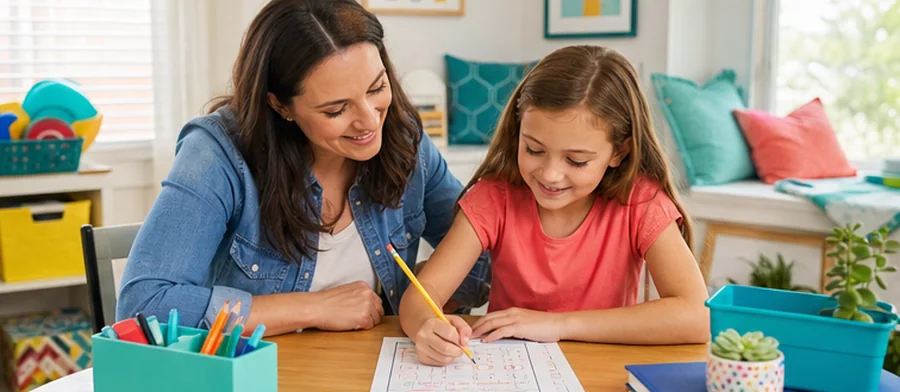
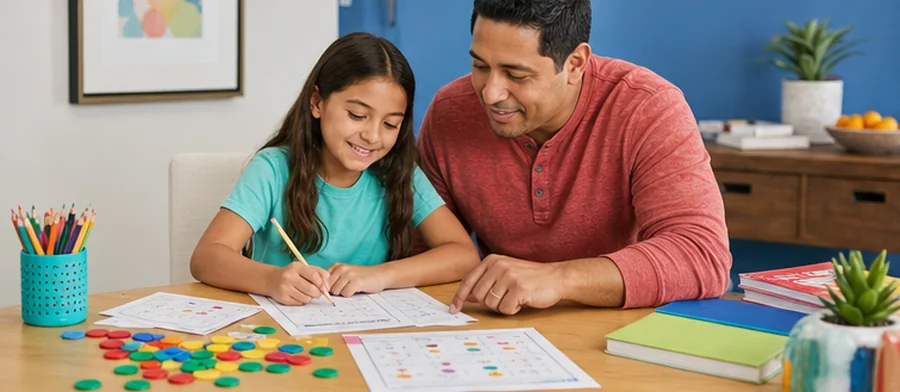
At home, choose one worksheet and first ask your child to name the picture groups. Have them point and count each set aloud, touching each object once. Next, help them color one box for each item counted. Finish by asking two comparison questions: Which group has more? Which group has fewer? If your child is ready, ask, How many are there in these two groups together?
Classroom uses for teachers
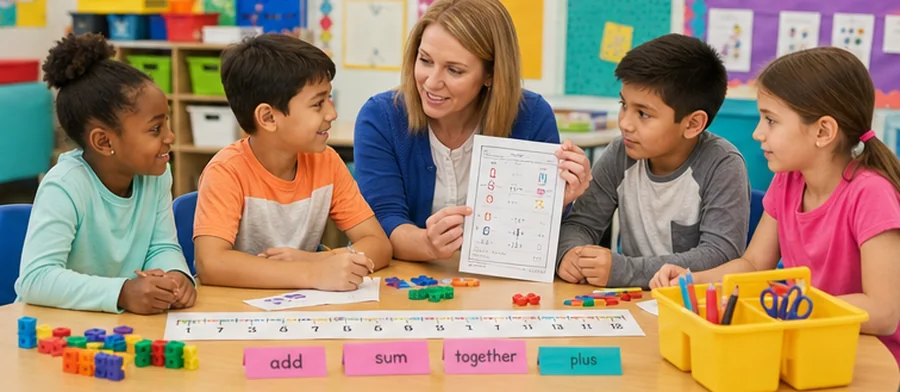
Teachers can use these pages in math centers, small-group lessons, morning work, or follow-up practice after a class survey. The worksheets pair well with hands-on graphing using counters, sticky notes, or picture cards. Children can first build a graph with real objects, then complete a printable version to connect concrete sorting with paper-and-pencil representation.
Common errors and a child-friendly strategy
Watch for skipped objects, double-counting, coloring the wrong bar, or comparing by where a bar starts instead of how long it is. A helpful strategy is Say, Count, Color, Check: say the category name, count each picture, color the same number of boxes, then check by recounting the bar. Why iBloom worksheets help: each page uses clear layouts and familiar images so young learners can focus on one graphing idea at a time while still practising counting, comparison, and early data vocabulary.
Free printable PDF download
Use this preschool kindergarten graphing worksheet page to preview the activity, print it, or download it as a PDF for quick practice. It works well for homework, homeschool lessons, tutoring, morning work, revision, and classroom centers.
Answers and answer key support
After the child completes the worksheet independently, parents and teachers can use the answer support or answer key information to check the work, review mistakes, and choose the next practice step.
Helpful answers
Frequently asked questions
What graphing skills do these worksheets teach?
Children practise counting picture groups, coloring bars to match quantities, reading simple bar graphs, comparing more and fewer, and creating basic bar charts from visual data.
Are these worksheets suitable for preschool children?
Yes. Many pages use familiar pictures and small, countable groups, making them appropriate for preschoolers who are learning one-to-one counting and simple comparisons.
How do bar graph worksheets support kindergarten math?
They connect counting, sorting, comparison, and early addition. Children learn to organize information visually and answer questions using the graph instead of guessing.
How can I help my child if they color too many boxes?
Ask your child to recount the pictures by touching each one, then recount the colored boxes. Encourage them to match one picture to one box before moving to the next category.
Can teachers use these pages in math centers?
Yes. The worksheets work well for centers because children can count, color, and answer graph questions independently or after a short teacher-led demonstration.
Is this preschool kindergarten graphing worksheet free?
Yes. You can preview it for free and use the printable worksheet for home or classroom practice.
Can I download this preschool kindergarten graphing worksheet as a PDF?
Yes. Use the worksheet download option to save a printable PDF, or print the worksheet directly from the page.
Does this preschool kindergarten graphing worksheet include answers or an answer key?
When the activity has fixed answers, iBloom includes answer support so parents and teachers can check the completed worksheet.