Free printable practice
Bar Graphs Practice Activities
Grade 1 bar graph worksheets that help children read simple graphs, count category totals, and compare data using more, fewer, and equal.
Free printable worksheet PDFs
Preview every available page, then download the free worksheet PDF for home, homeschool, tutoring, or classroom practice.
Preview the exact activity before downloading it.
Practice that builds confidence
What Grade 1 children learn from bar graphs
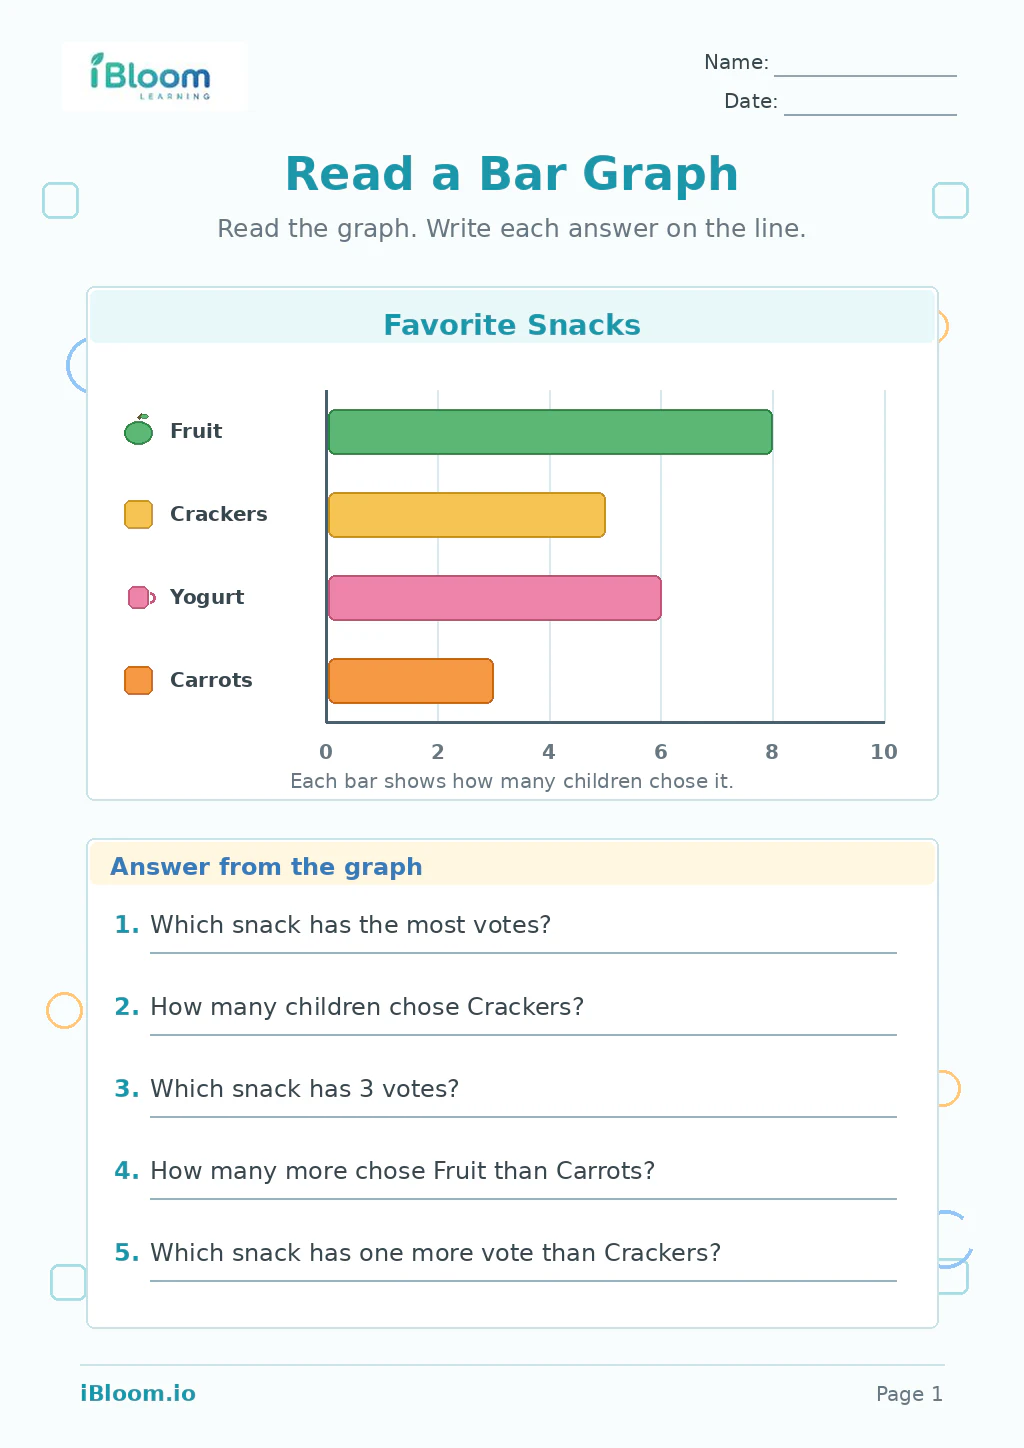
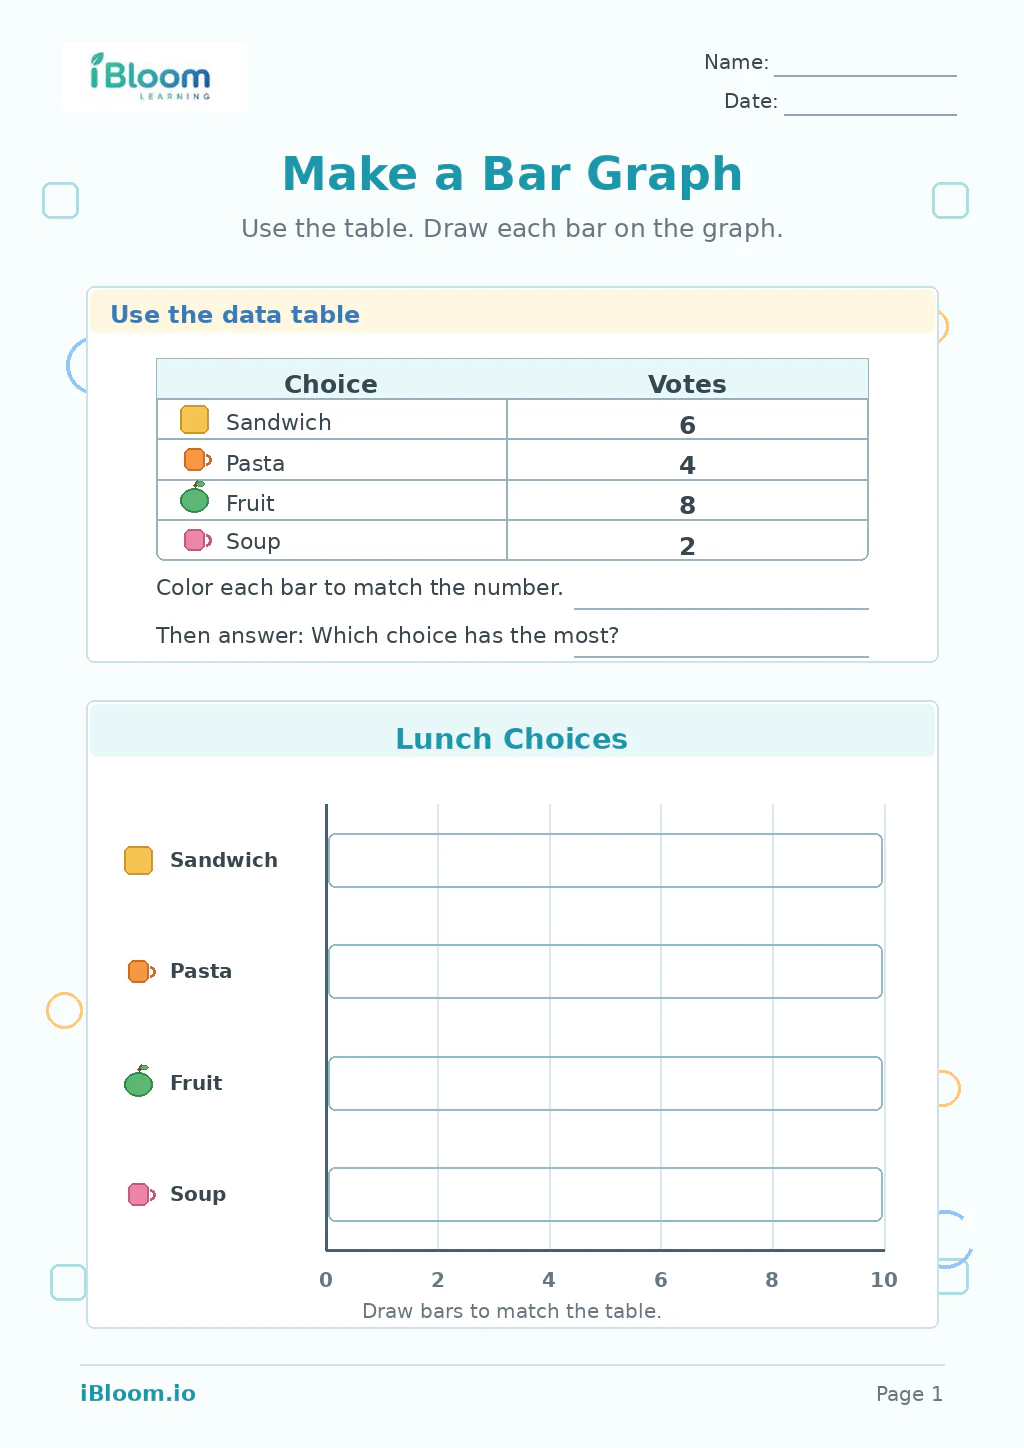
These Grade 1 bar graph practice activities help children make sense of data by looking at categories, counting how many, and comparing amounts. Students practise reading graph titles, labels, and bars, then answer questions using words such as more, fewer, most, least, and equal.
The printable worksheets include simple, child-friendly bar graphs with clear visuals and questions that build from counting totals to interpreting what the graph shows. They are useful for math practice at home, classroom lessons, small groups, or review after a data graphing unit.
Bar graphs turn information into a picture children can read. In these worksheets, students look across categories, count the length or height of each bar, and connect each bar to a number. They learn that the title tells what the graph is about, the category labels name each group, and the bars show how many are in each group.
Skill progression in the activities
Practice usually begins with straightforward questions such as “How many?” and “Which has the most?” Children then move to comparing two categories, finding how many more or fewer, and noticing when two bars show the same amount. This progression supports early data interpretation without overwhelming first graders with large numbers or complex scales.
A simple parent routine
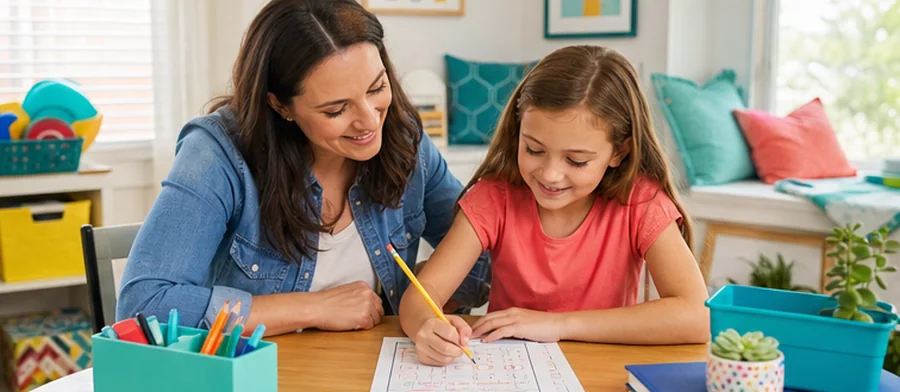
At home, start by reading the title together. Ask your child to point to one category, trace the bar with a finger, and count to find the total. Then ask one comparison question, such as “Are there more cats or dogs?” For extra practice, make a quick family graph with toys, snacks, or favorite colors, then use the same question pattern.
Classroom uses for teachers
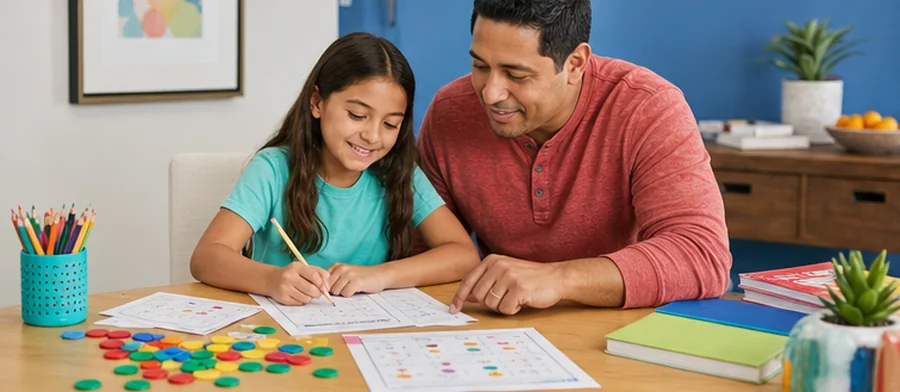
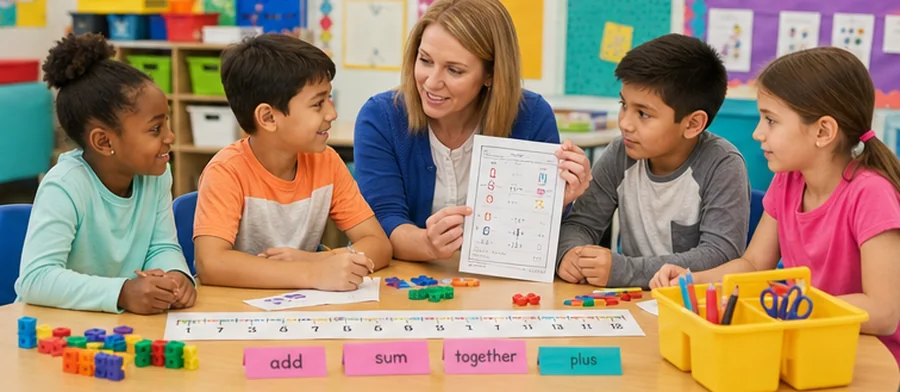
Teachers can use these printables during whole-group graph lessons, math centers, partner work, or quick checks after a data graphing lesson. They also work well for discussion: students can explain how they know an answer, circle evidence on the graph, or write a number sentence for a “how many more” question.
Common errors to watch for
First graders may count the spaces around a bar instead of the boxes in the bar, skip the category labels, or answer from the picture they like best rather than the data. Some children also confuse “fewer” with “more” when comparing two bars. Encourage them to touch the label, count the bar carefully, and say the comparison aloud.
Free printable PDF download
Use this grade 1 bar graph worksheet page to preview the activity, print it, or download it as a PDF for quick practice. It works well for homework, homeschool lessons, tutoring, morning work, revision, and classroom centers.
Answers and answer key support
After the child completes the worksheet independently, parents and teachers can use the answer support or answer key information to check the work, review mistakes, and choose the next practice step.
Why iBloom worksheets help
The iBloom bar graph worksheets keep the layout clean, the questions focused, and the visual data easy to read. A child-friendly strategy is: Title, label, bar, answer. Read the title, find the label, count the bar, then choose or write the answer. This routine helps children slow down and use evidence from the graph.
Helpful answers
Frequently asked questions
What bar graph skills do these Grade 1 worksheets practise?
They focus on reading simple bar graphs, identifying category labels, counting bar totals, and answering comparison questions using more, fewer, most, least, and equal.
Are these worksheets for making graphs or reading graphs?
The main focus is reading and interpreting bar graphs. Some activities may also support discussion about how data is organized into categories.
How can I help my child compare two bars?
Have your child count each bar first, write or say both numbers, then decide which is greater. For “how many more,” compare the two totals by counting up or subtracting.
What mistakes are common with first grade bar graphs?
Children may ignore the labels, count inaccurately, or choose an answer based on preference instead of the graph. Pointing to the title, label, and bar before answering helps.
Can teachers use these for math centers?
Yes. The clear graphs and focused questions make them suitable for math centers, partner practice, small-group instruction, review, or quick informal assessment.
Is this grade 1 bar graph worksheet free?
Yes. You can preview it for free and use the printable worksheet for home or classroom practice.
Can I download this grade 1 bar graph worksheet as a PDF?
Yes. Use the worksheet download option to save a printable PDF, or print the worksheet directly from the page.
Does this grade 1 bar graph worksheet include answers or an answer key?
When the activity has fixed answers, iBloom includes answer support so parents and teachers can check the completed worksheet.