Free printable practice
Bar Graphs Practice Activities
Grade 2 printable bar graph activities help children read, compare, and answer questions about data shown in simple bar graphs.
Practice that builds confidence
What children learn with bar graphs
These Grade 2 bar graph worksheets help children practise reading data, comparing categories, and answering questions such as “how many more,” “how many fewer,” and “how many in all.” Learners connect the height or length of each bar to the numbers it represents.
The printable activities include clear graph displays, category labels, simple scales, and question sets that build from noticing the tallest bar to solving two-step comparison problems. Children practise using graph vocabulary while explaining what the data shows.
Bar graphs help Grade 2 learners see data as organized information, not just a list of numbers. On these worksheets, children read the title, look at the category labels, follow the scale, and match each bar to a value. They practise deciding which category has the most or least and describing the data using words like category, scale, bar, total, more, and fewer.
Skill progression in the printables
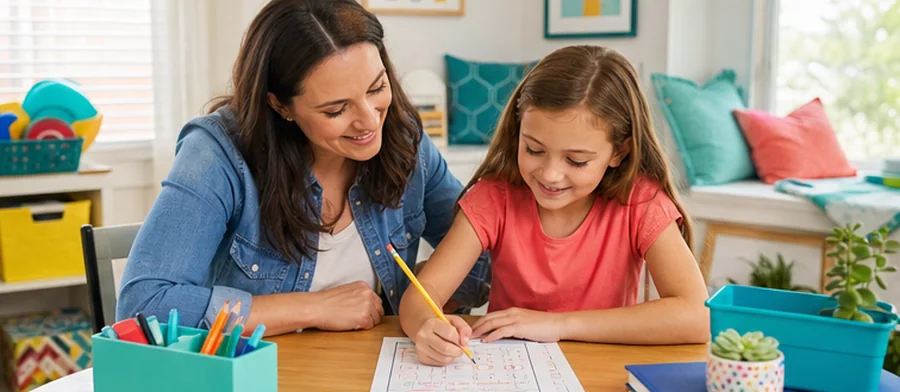
Activities begin with straightforward questions, such as identifying the longest or shortest bar. They then move into comparing two categories, finding differences, and adding values from more than one bar. Some questions ask children to make a statement supported by the graph, which strengthens both maths reasoning and data language.
A simple parent routine
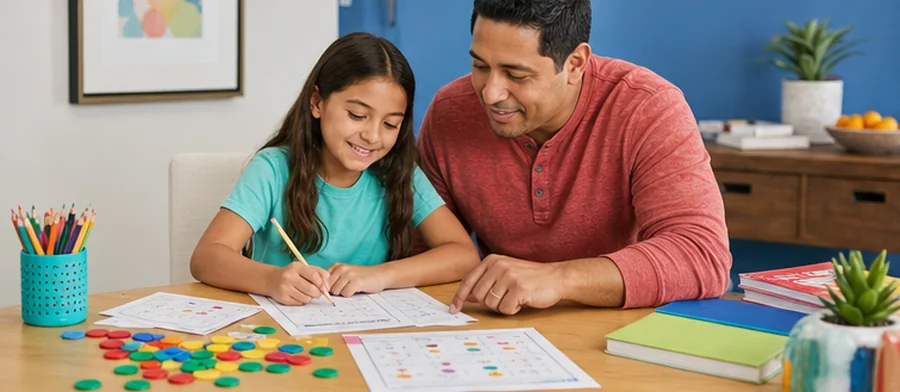
At home, start by asking your child to read the graph title aloud and point to each category. Next, ask, “What number does this bar show?” and have your child trace from the top of the bar to the scale. Finish with one comparison question, such as “How many more children chose apples than bananas?” Encourage your child to say the number sentence before writing the answer.
Classroom uses for teachers
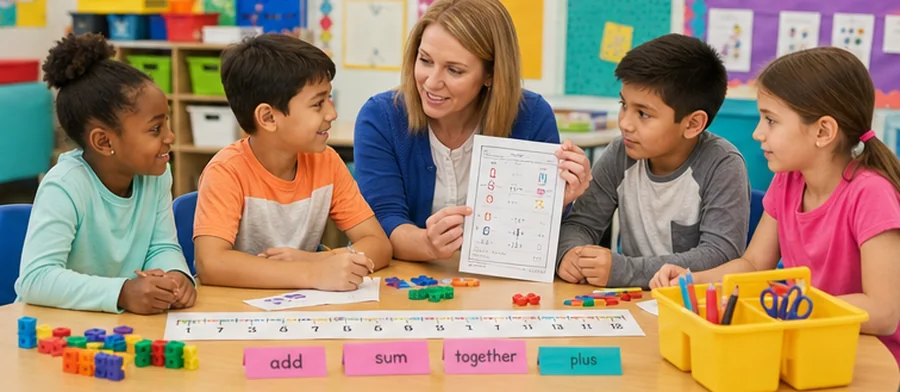
Teachers can use these bar graph pages for whole-group data lessons, small-group reteaching, morning work, math centers, or quick checks after a graphing lesson. They also work well after a class survey: students can compare a worksheet graph with data they collected themselves, noticing how bars make survey results easier to discuss.
Common errors to watch for
Some children count the bars instead of reading the scale. Others skip the title or mix up category labels when bars are close together. In comparison questions, students may add when they should subtract. A helpful habit is to underline the category names in the question, then circle those same labels on the graph before solving.
Free printable PDF download
Use this grade 2 bar graph worksheet page to preview the activity, print it, or download it as a PDF for quick practice. It works well for homework, homeschool lessons, tutoring, morning work, revision, and classroom centers.
Answers and answer key support
After the child completes the worksheet independently, parents and teachers can use the answer support or answer key information to check the work, review mistakes, and choose the next practice step.
Why iBloom worksheets help
iBloom worksheets keep the graphs uncluttered so Grade 2 students can focus on the data relationship. The questions are varied enough to prevent guessing: children identify, compare, add, subtract, and explain. A child-friendly strategy is “Title, Labels, Scale, Bars, Question”—check each part in order before answering.
Helpful answers
Frequently asked questions
What bar graph skills do these Grade 2 worksheets practise?
They practise reading graph titles and labels, using a scale, identifying the greatest and least values, comparing two categories, finding differences, and answering simple data questions.
Do children need to create their own bar graphs on these pages?
These activities focus mainly on reading and interpreting bar graphs. They help children understand graph parts and data relationships before moving on to creating graphs independently.
What is a common mistake when reading bar graphs?
A common mistake is counting the number of bars instead of reading the value shown by each bar. Children should trace from the top or end of the bar to the scale before answering.
How can I help my child answer “how many more” questions?
Have your child identify the two categories, write each value, and subtract the smaller number from the larger number. Saying the comparison aloud helps connect the subtraction to the graph.
Are these worksheets useful for math centers?
Yes. The clear graphs and varied question types make them suitable for independent centers, partner discussion, reteaching groups, or quick checks after a data graphing lesson.
Is this grade 2 bar graph worksheet free?
Yes. You can preview it for free and use the printable worksheet for home or classroom practice.
Can I download this grade 2 bar graph worksheet as a PDF?
Yes. Use the worksheet download option to save a printable PDF, or print the worksheet directly from the page.
Does this grade 2 bar graph worksheet include answers or an answer key?
When the activity has fixed answers, iBloom includes answer support so parents and teachers can check the completed worksheet.