



About this worksheet
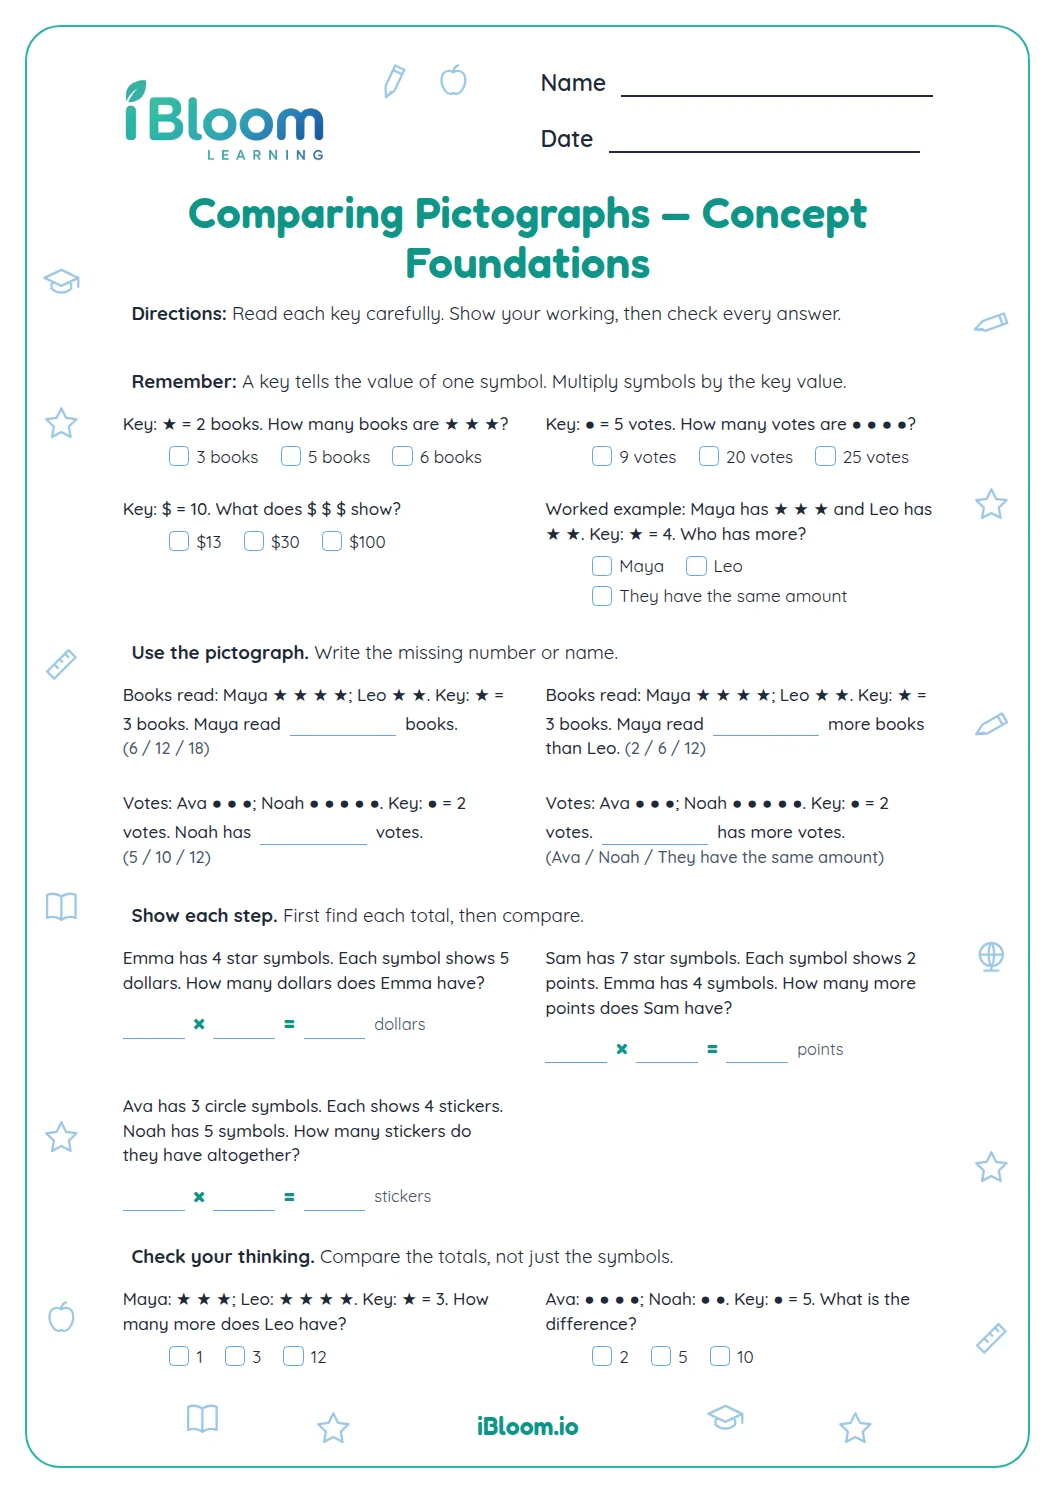
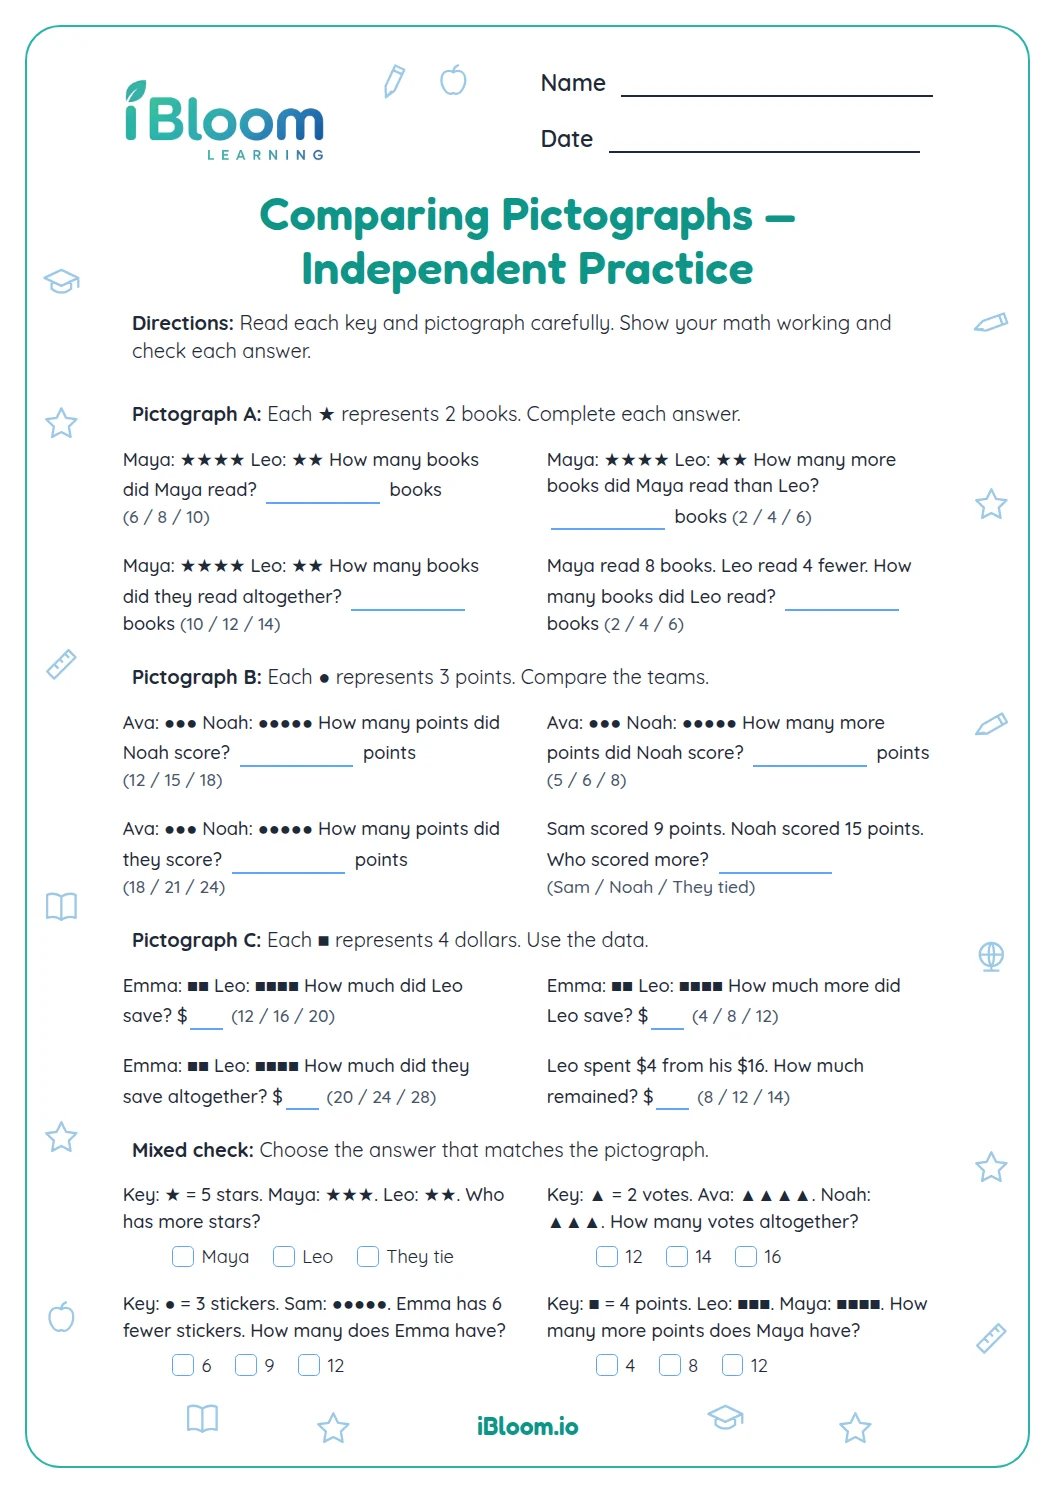
This Grade 4 worksheet gives students repeated practice reading pictographs with a key and comparing category totals. Four real-world graphs cover trail visitors, borrowed books, garden harvest, and class votes. Across 14 questions, students find values, compare differences, combine categories, and identify greatest or least groups. The answer key lists each result.
Aligned to 2.MD.D.10
What will students practice?
Students read four pictographs about visitors, books, harvests, and class votes. Each graph includes a key, and its four questions ask for totals, differences, and comparisons.
Students read each symbol key before finding totals or comparing categories in familiar contexts.
How should students approach the questions?
Read the graph title and key, count the symbols in each row, and multiply by the value of one symbol before comparing.
What does one question look like?
Use this item to model how to find evidence before answering.
- 1How many visitors came on Wednesday? → 10
How can students check their work?
Check the key value and recompute the total or difference from the graph rows.
How to use this worksheet
- 1Read the directions and identify the skill in this part.
- 2Study the passage, drawing, graph, or sentence clues.
- 3Answer one item at a time and show work where space is provided.
- 4For written responses, include the key evidence or idea.
- 5Use the answer key to check and correct any missed item.
Common mistakes and quick fixes
The mistake
Answering from memory without checking the item’s evidence.
The fix
Point to the passage detail, graph symbol, or sentence clue that supports the response.
The mistake
Skipping a key or place-value detail.
The fix
Check what each symbol represents or count decimal places before finalizing.
The mistake
Giving only part of the requested response.
The fix
Reread the prompt and include the requested comparison, reason, or complete thought.
This page practices the following standard.
Solve put-together and compare problems using information from a picture graph.
On this sheet:
Show the official wordingHide the official wording
Draw a picture graph and a bar graph (with single-unit scale) to represent a data set with up to four categories. Solve simple put-together, take-apart, and compare problems using information presented in a bar graph.
What to practice next
Make more practice
Further reading
Questions parents and teachers ask
How many questions are on this worksheet?
There are 14 questions arranged in four parts. The items progress from direct reading or recognition to comparisons, explanations, and applications of the same skill. Each question asks students to read values from the pictured graph, so they should use its key.
What grade is this printable for?
This worksheet is written for Grade 4. The prompts and examples use the reading, science, writing, or math skill named in its title. Students use the graph icons to compare amounts and combine category totals in context. Use a clue from the prompt to support the response.
Is an answer key included?
Yes. The printable includes a separate answer key with answers for each question. Written-response items include a sample response, and students may use different wording when the same idea is clear. The key gives each expected count or comparison for a quick check after completion.
How can I help without giving the answer?
Ask the student to point to the evidence, drawing, or calculation that supports the answer. A prompt such as “What clue helped you decide?” encourages checking the work while leaving the reasoning to the learner. Ask the learner to explain how the key changes the value represented by one symbol.
How long should the practice take?
Plan for about 20 minutes, with extra time for written explanations or checking answers. Students can complete one part at a time and review the key afterward. Have students complete each graph group before checking its related answers. Use a clue from the prompt to support the response.