



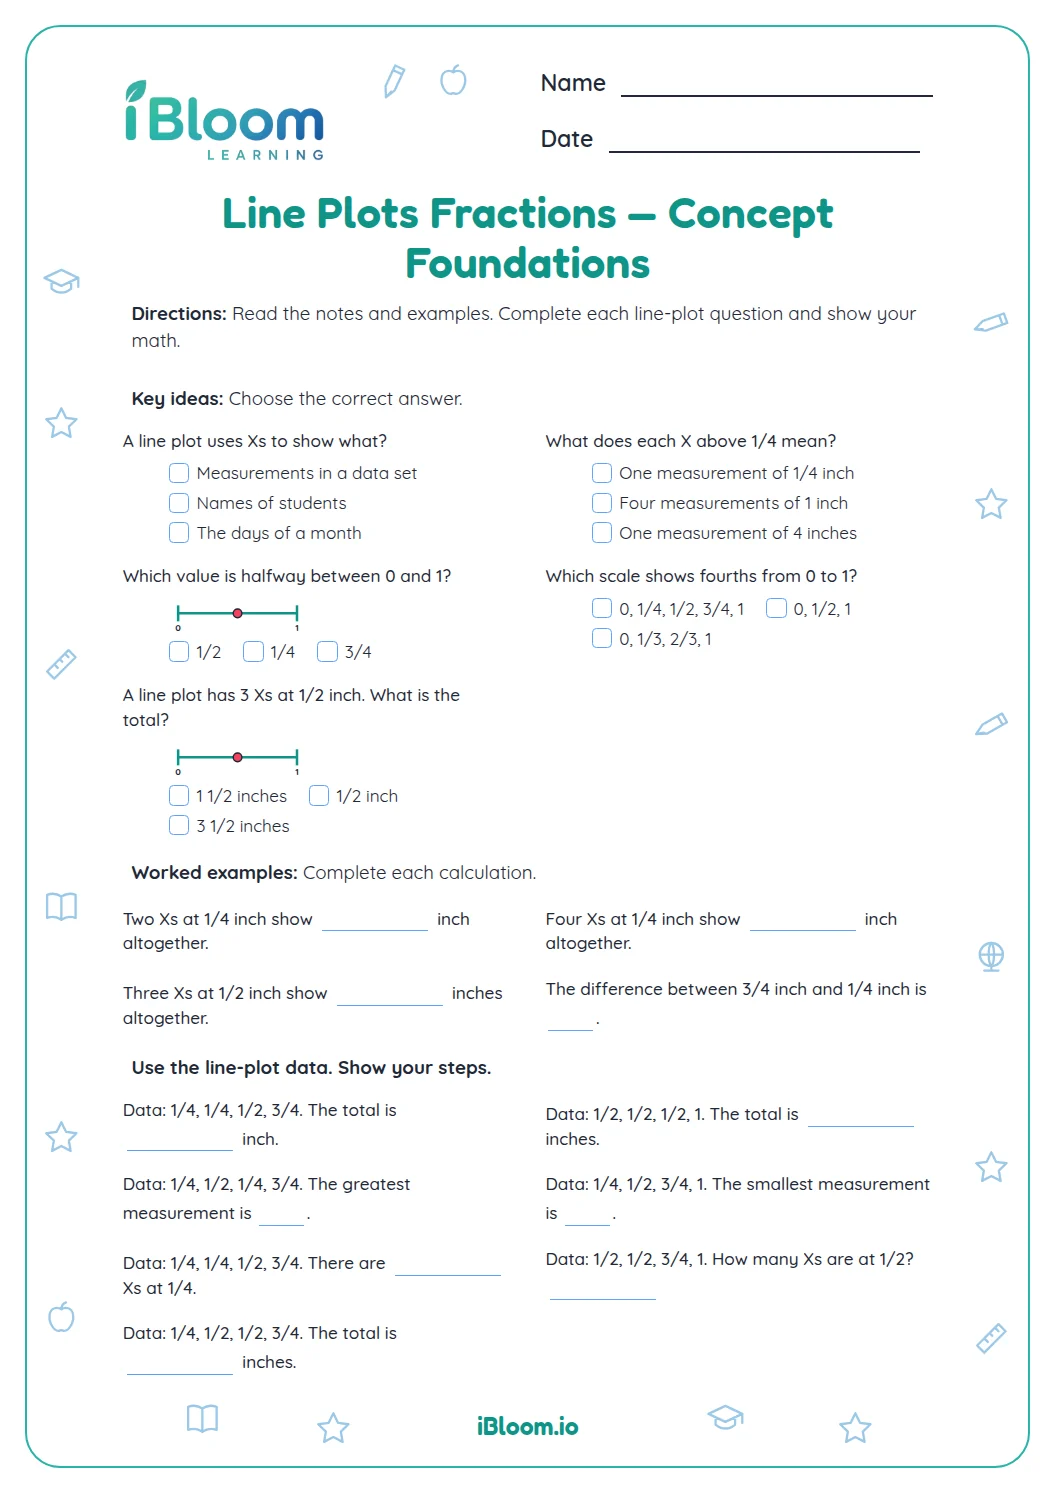
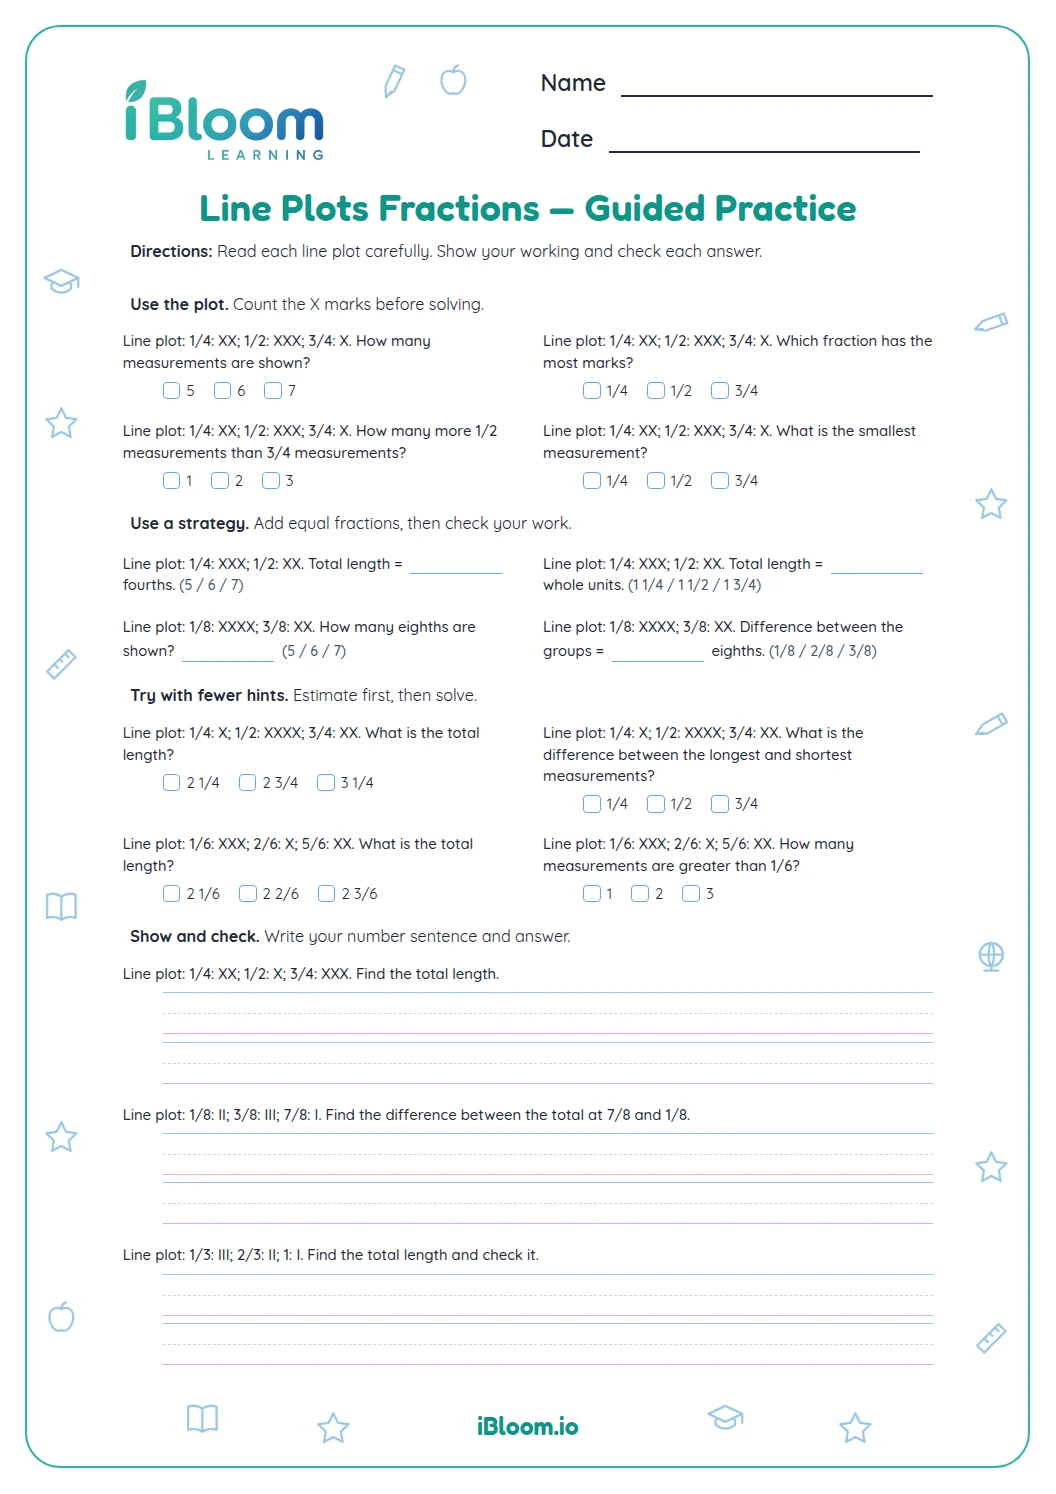
About this worksheet
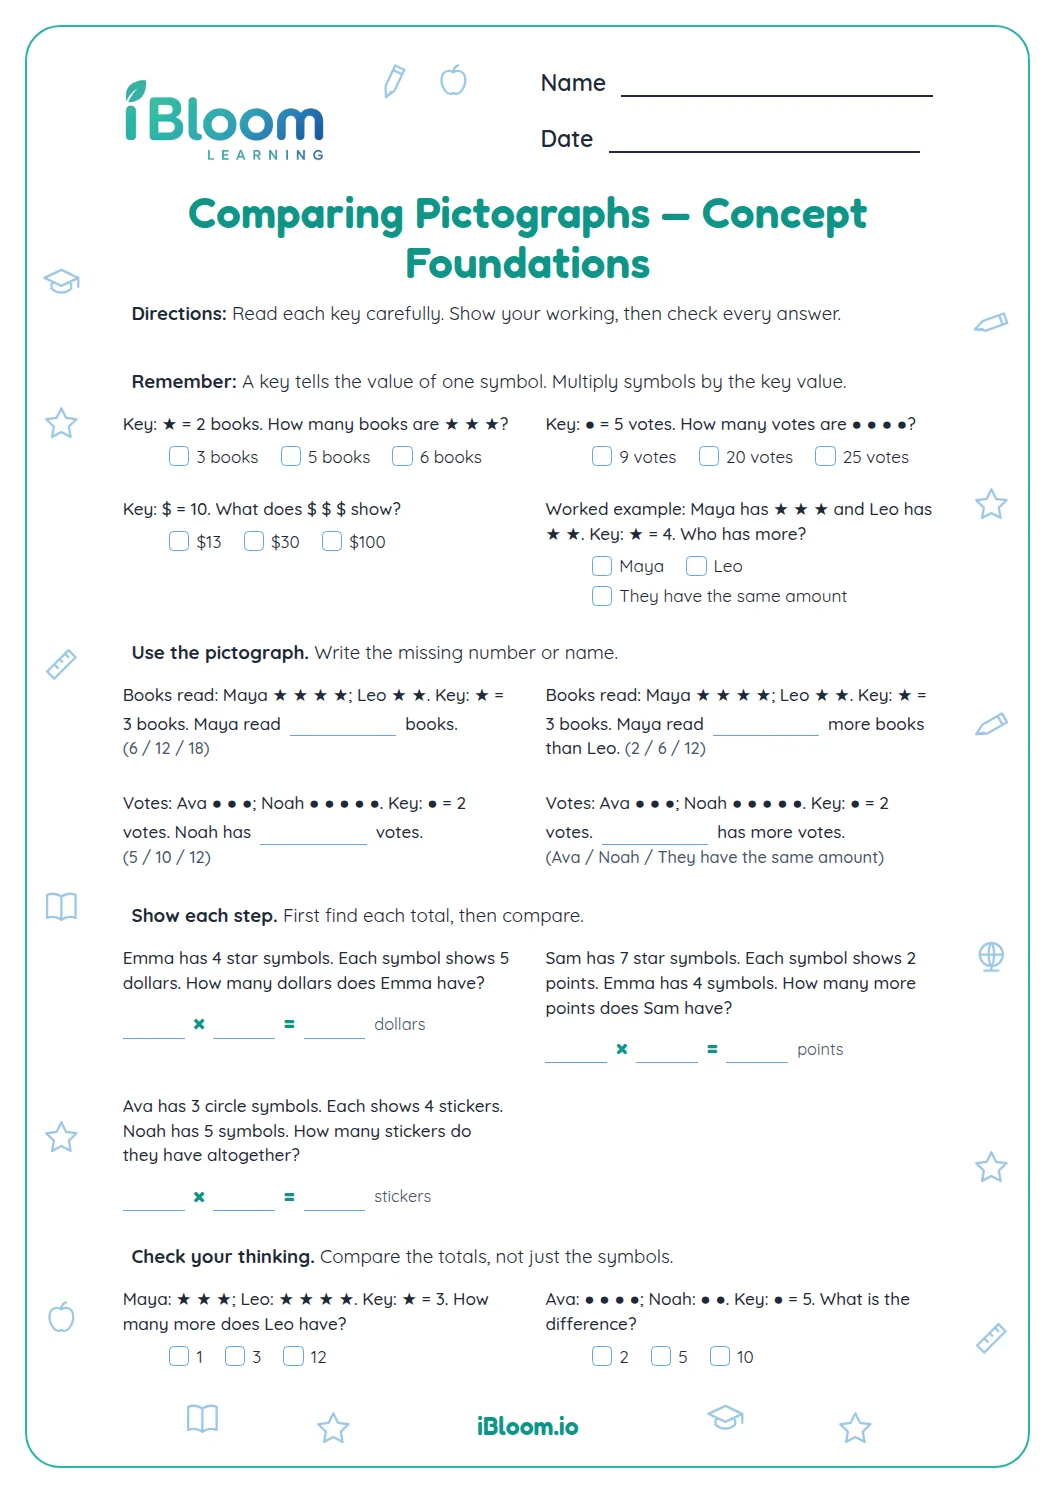
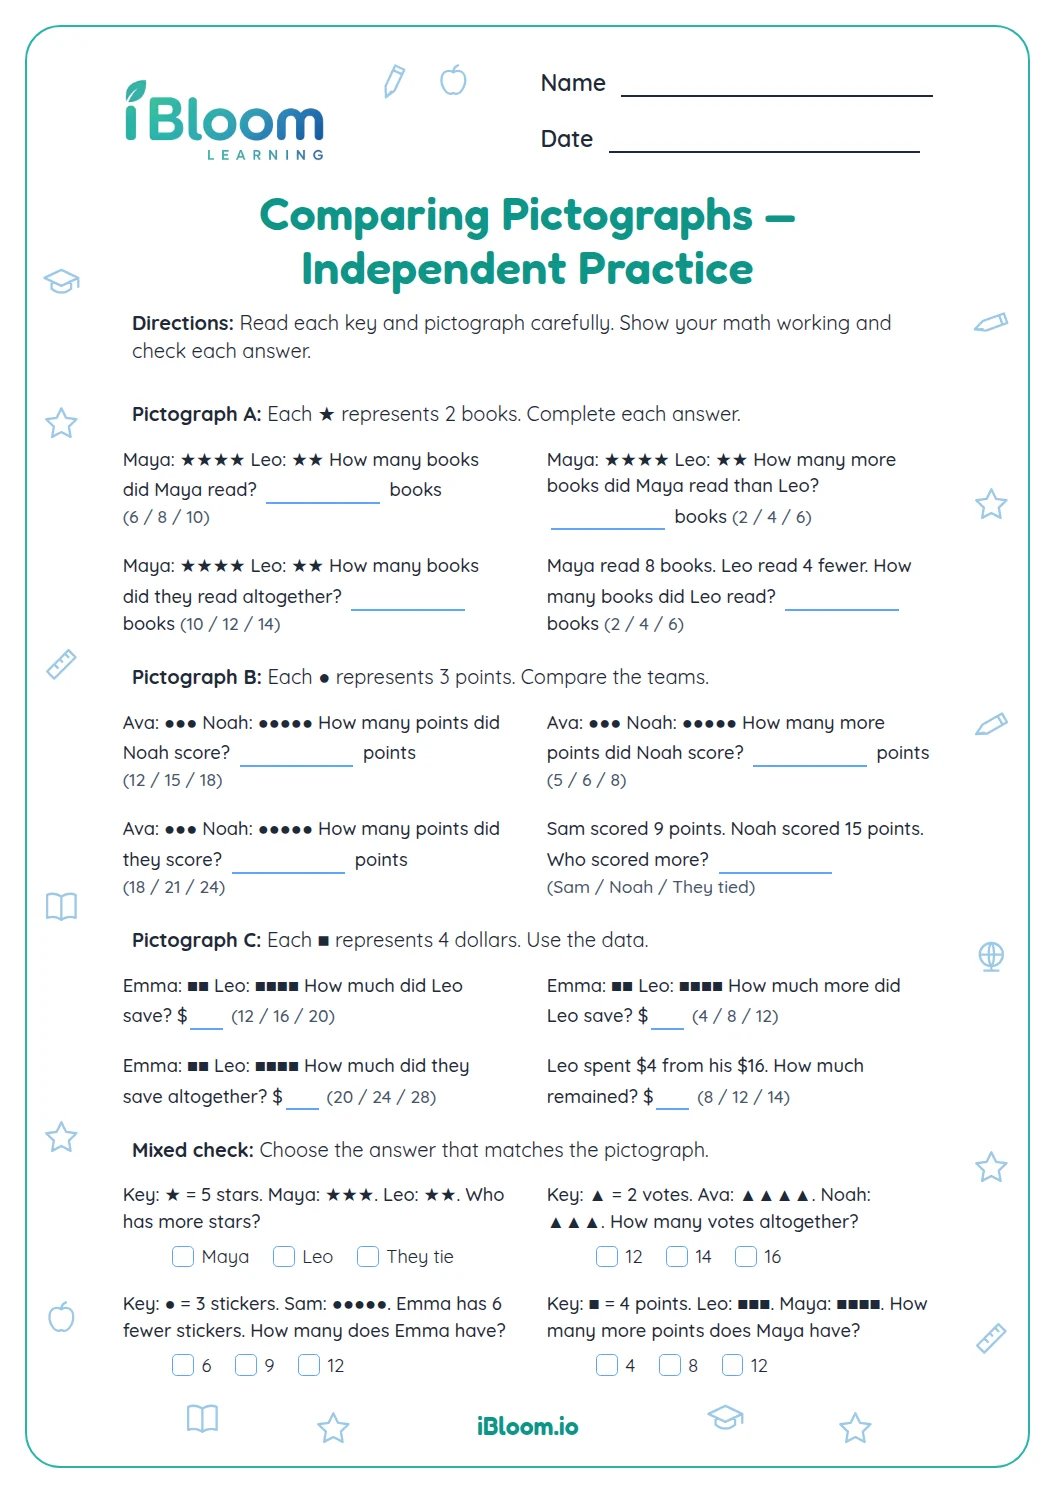
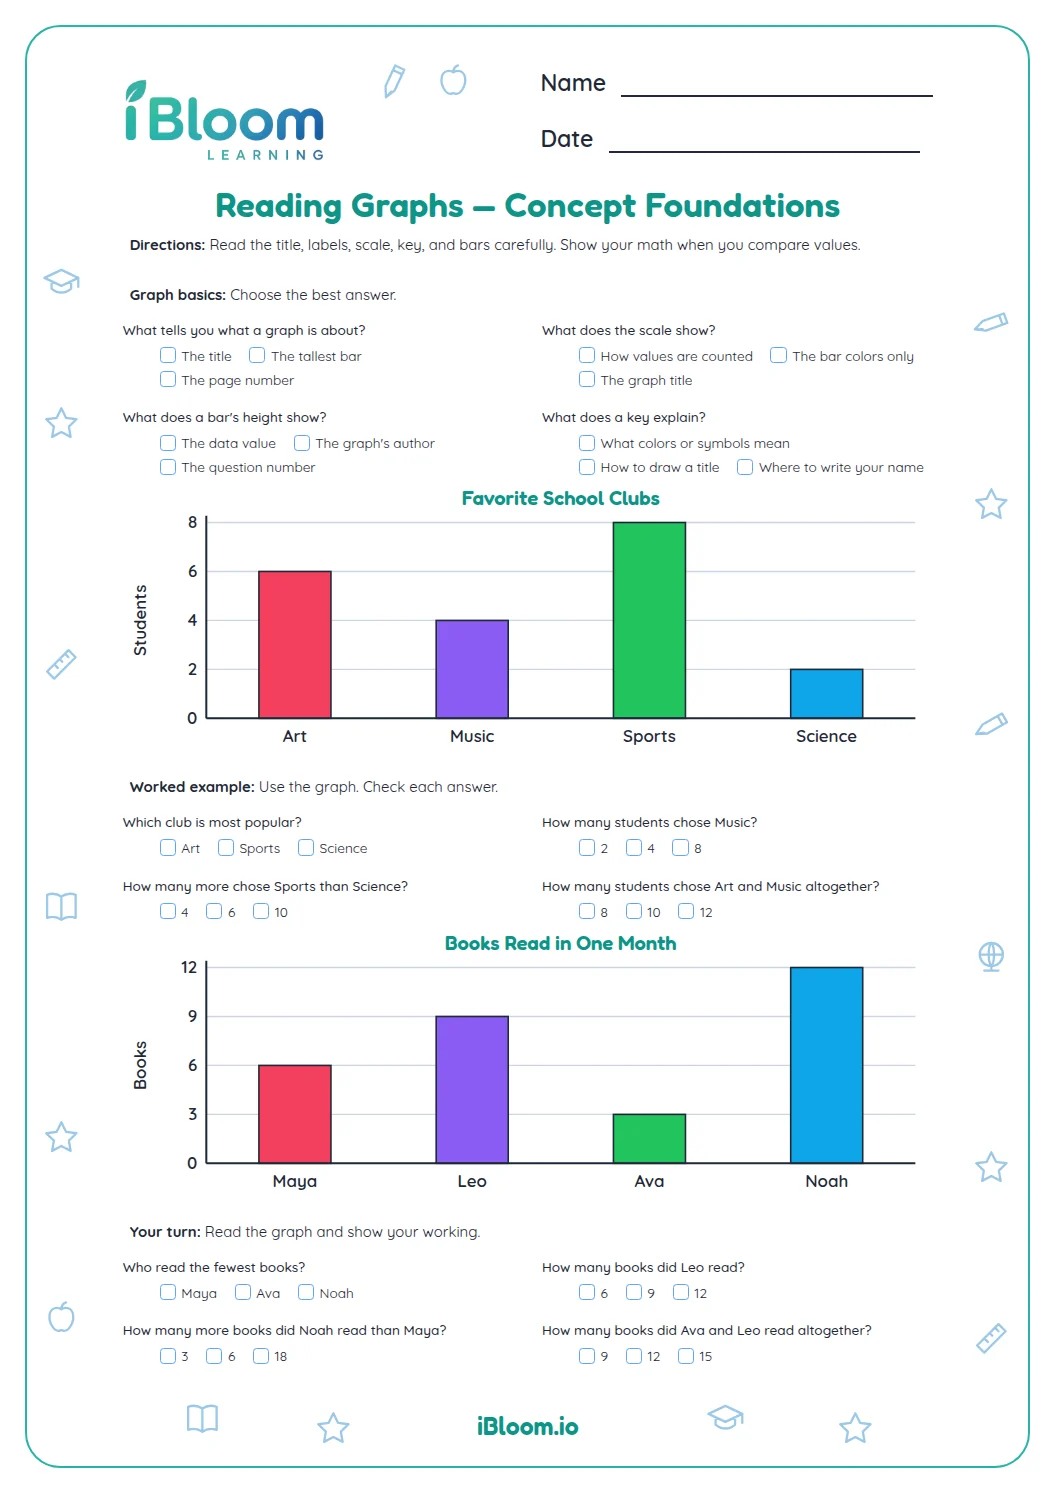
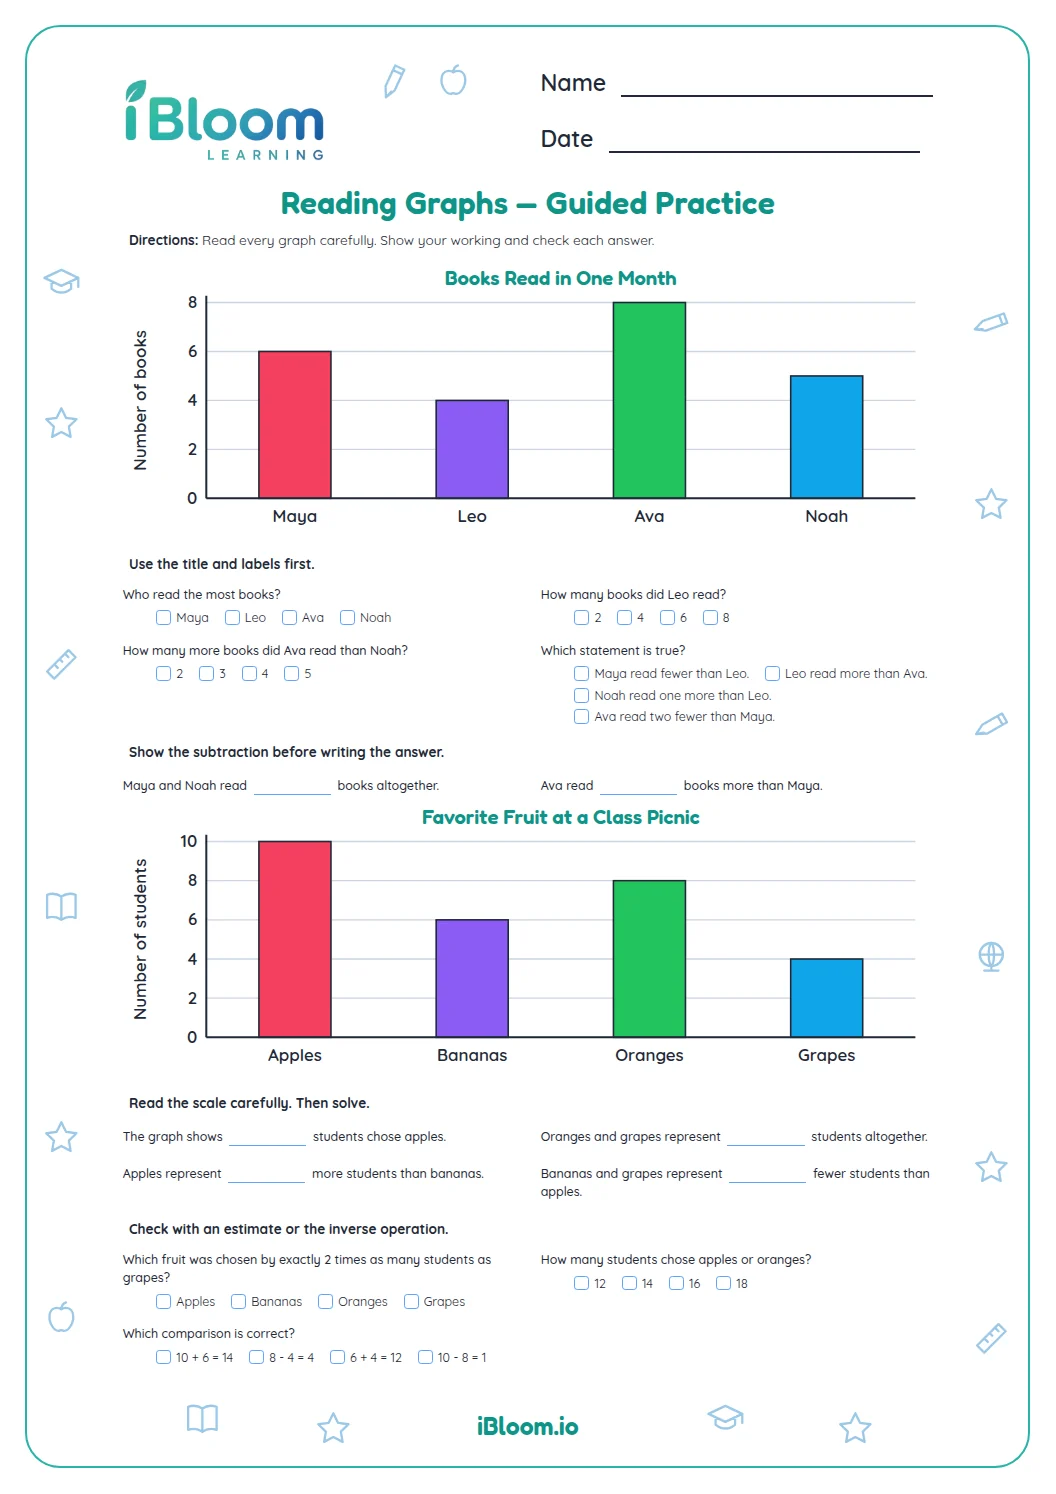
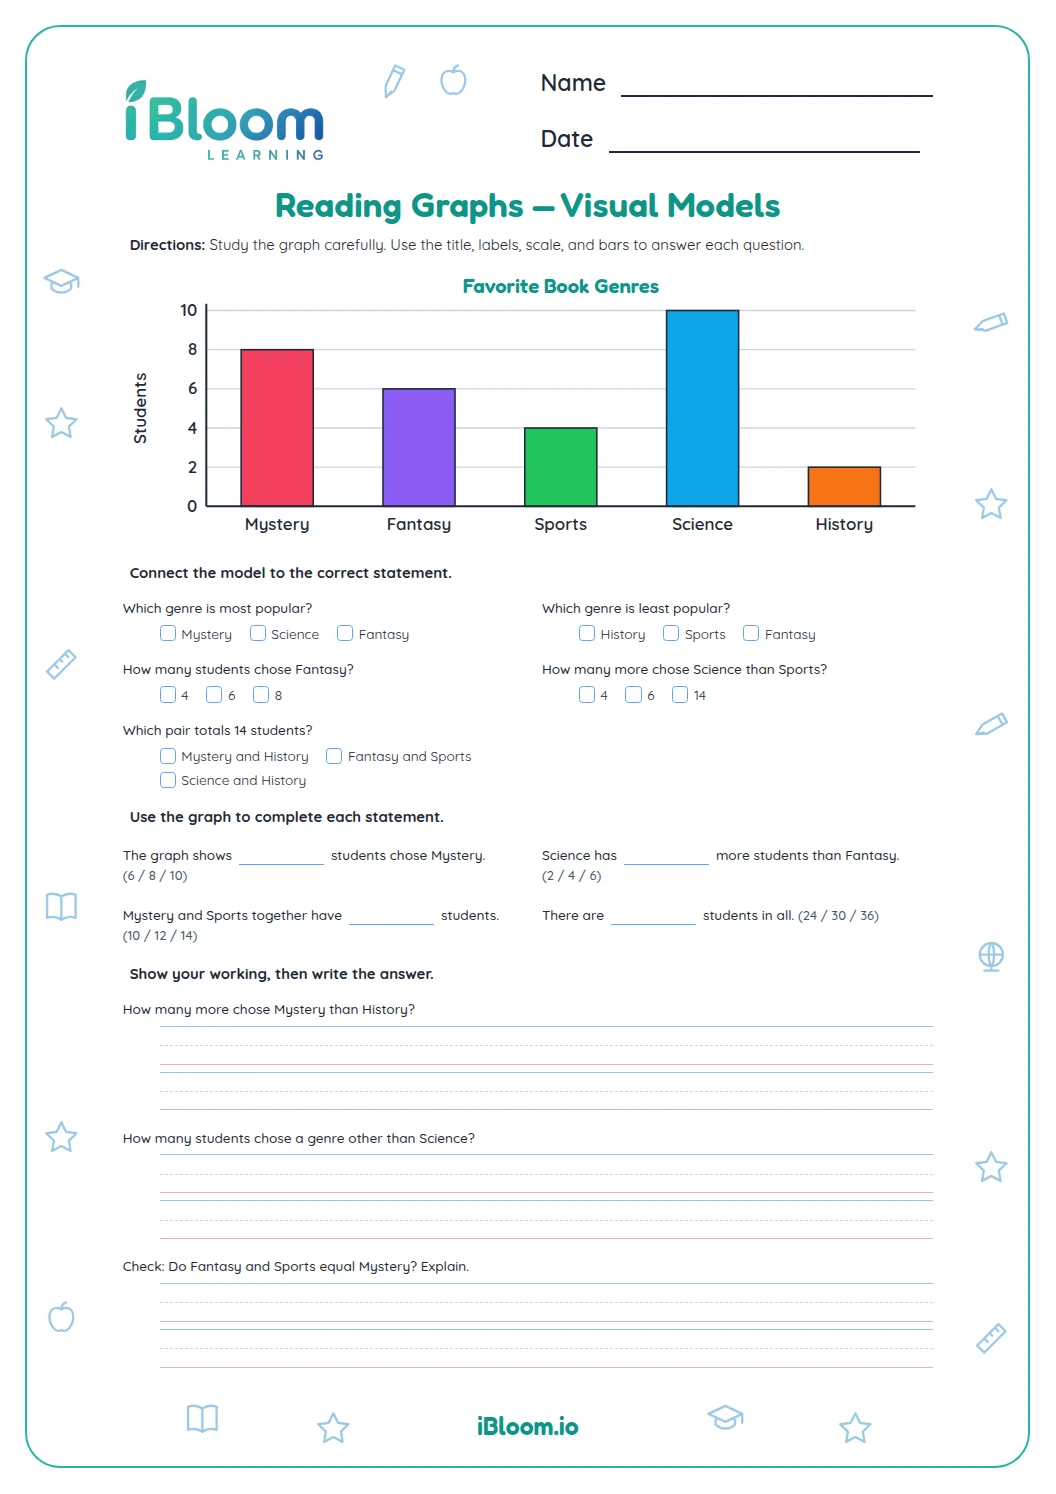
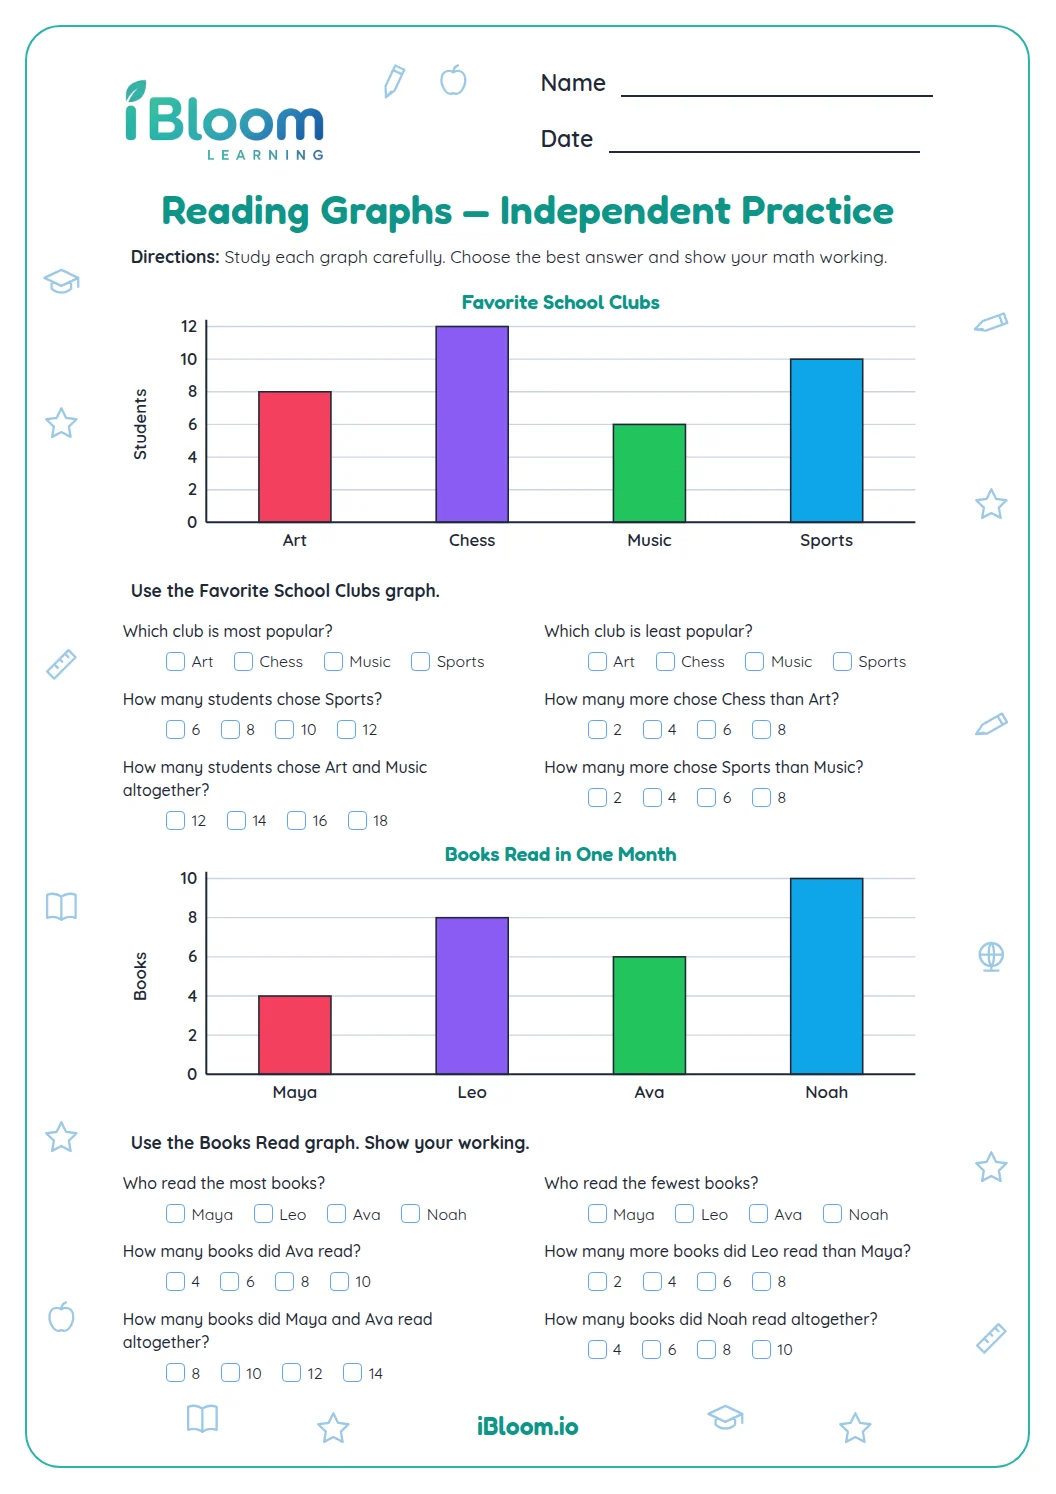
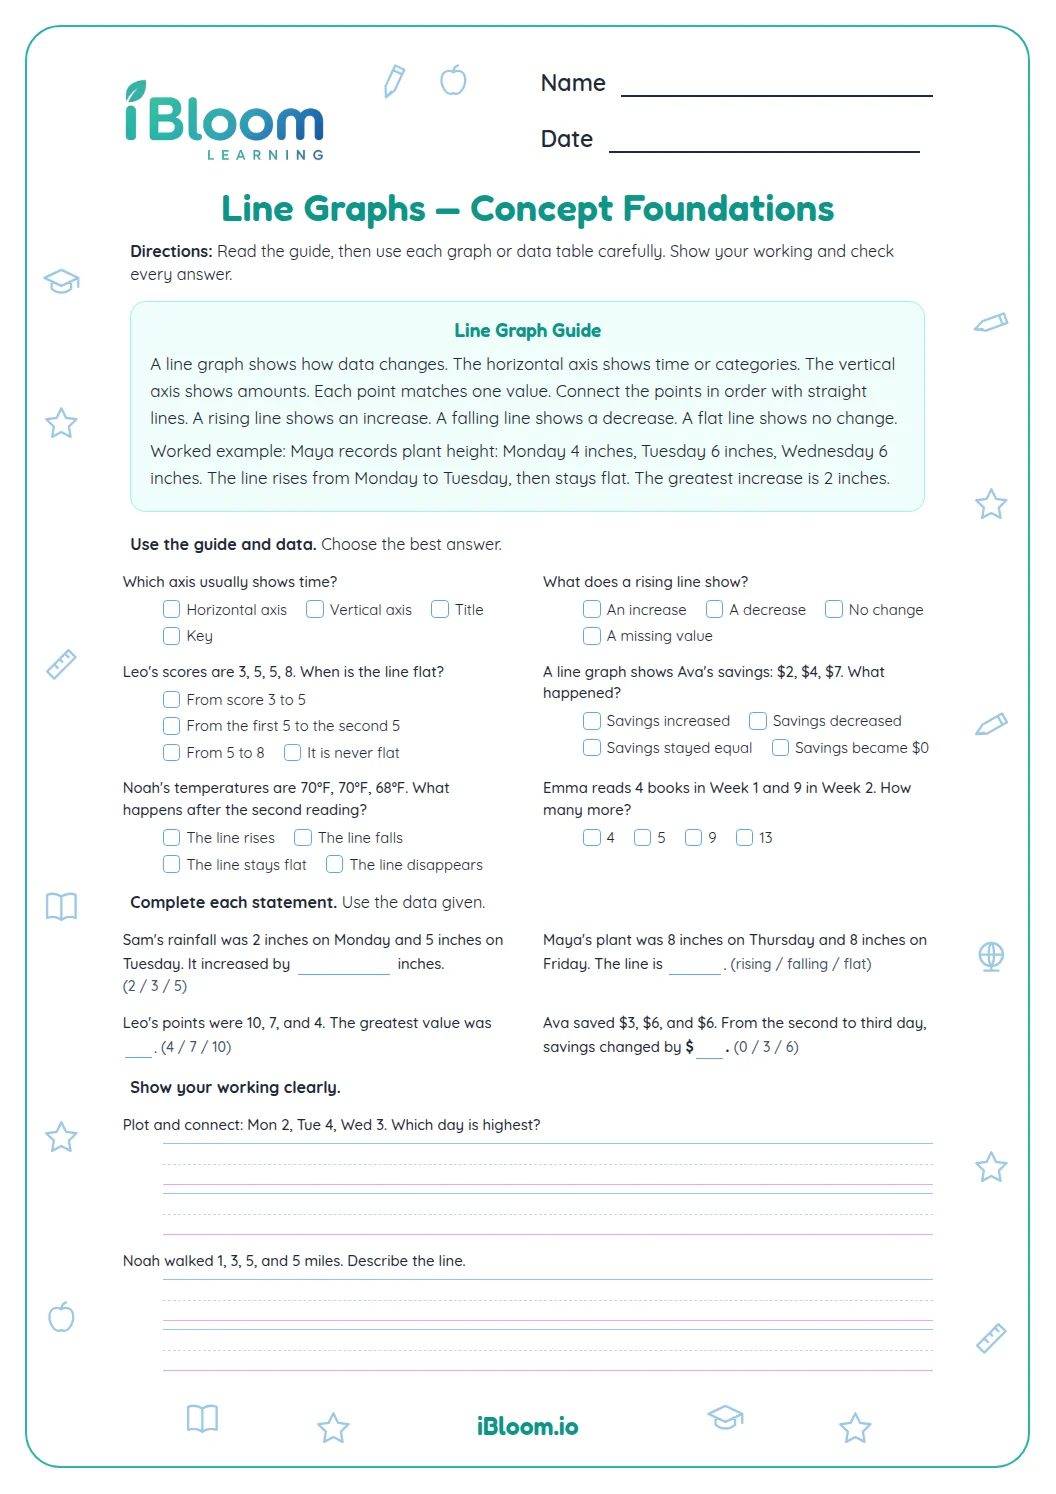
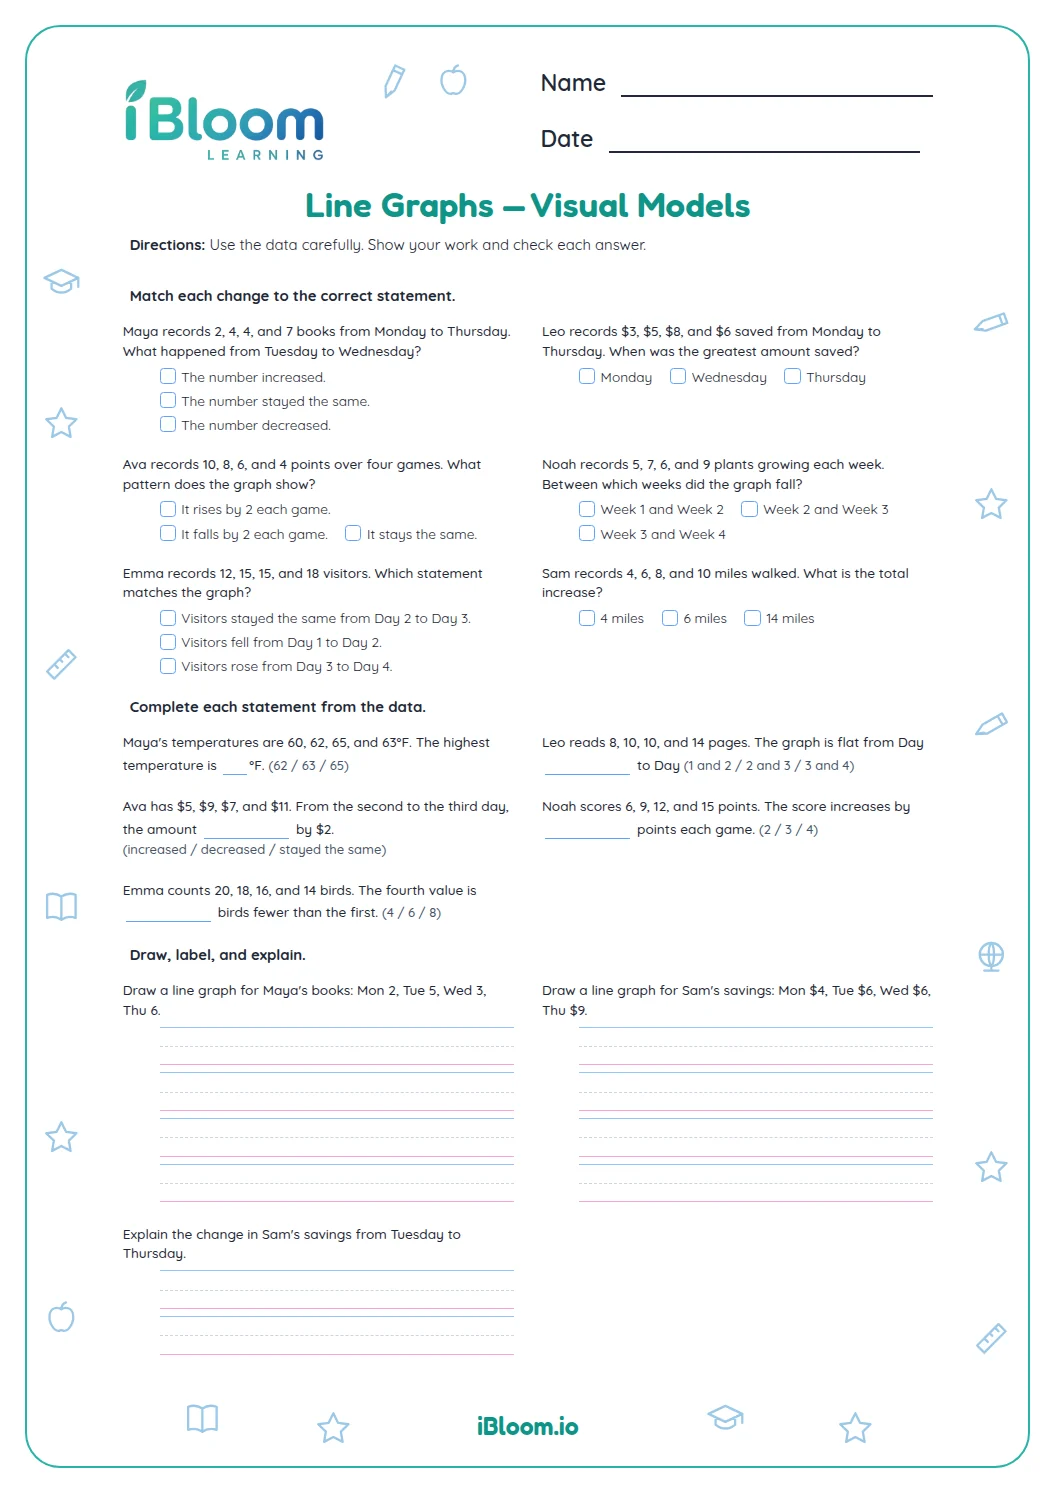
This printable presents two scaled pictographs and 14 graph-based questions. Students read the symbol key, translate picture counts into quantities, compare categories, and combine or extend values. The keys use tens so students practice multi-digit arithmetic while reading each graph. A separate answer key lists every response. The graph reading aligns with CCSS 3.MD.B.3.
Aligned to 3.MD.B.3
How does a pictograph key work?
Multiply the symbol count by the value in the key. In question 2, three fiction symbols at 10 books each represent 30 books. Question 3 compares fiction and science: 30 − 20 = 10 more fiction books.
- 1Fiction: 3 symbols × 10 = 30 books.
- 2Science: 2 symbols × 10 = 20 books.
- 330 − 20 = 10 more fiction books.
How can students compare categories?
Convert each row to an actual quantity before comparing. Questions 3 and 10 ask for differences; other items ask students to total rows or extend a count with another symbol.
What is included in this practice?
There are 14 questions based on two scaled pictographs: library books and a garden harvest. Each graph has two categories and a key of 10, so symbol counts become multiples of ten.
How to read each pictograph
- 1Read the graph title and category labels.
- 2Check the key to learn what one symbol means.
- 3Count symbols in the requested row.
- 4Multiply the symbol count by the key value.
- 5Compare or add the resulting quantities.
Pictograph mistakes to avoid
The mistake
Using the symbol count as the item total.
The fix
Multiply the symbols by the number in the key.
The mistake
Comparing symbol counts when keys differ.
The fix
Convert both rows to actual quantities first.
The mistake
Adding only two rows for an all-row total.
The fix
Include the value from every category named.
Common Core alignment
The plotted questions practice reading and reasoning with scaled picture graphs.
Read scaled picture graphs and solve comparison and total questions.
On this sheet: Students interpret scaled pictographs and compare or combine category values.
Show the official wordingHide the official wording
Draw a scaled picture graph and a scaled bar graph to represent a data set with several categories. Solve one- and two-step “how many more” and “how many less” problems using information presented in scaled bar graphs.
What to practice next
Make more practice
Further reading
Questions parents and teachers ask
What does one picture stand for?
Each picture stands for 10 items, as shown by the key on both graphs. For example, three pictures in the fiction row represent 30 books. Students multiply the picture count by 10 before comparing or adding the category totals.
How many graphs and questions are included?
The worksheet has two scaled pictographs and 14 questions. The library graph shows fiction and science books; the garden graph shows tomatoes and peppers. The questions ask students to read counts, compare categories, and combine values. Both graphs use a key of ten, so students multiply each picture count by ten before comparing.
How do students find how many more?
First turn each row’s picture count into an actual quantity using the key. Then subtract the smaller quantity from the larger one. In the library example, 30 fiction books minus 20 science books equals 10 more fiction books.
Does the printable include an answer key?
Yes. A separate two-page answer key lists the response to each of the 14 questions in worksheet order. Students can check the graph reading and arithmetic after finishing the page. The key follows the worksheet order, making it easy to find and check one item at a time.
What math does the worksheet practice?
Students interpret scaled pictographs, multiply symbol counts by ten, and compare or combine the quantities. The questions use two category graphs and include totals, differences, and simple extensions of the pictured values. The key value changes what each printed symbol means, so checking it is the first step.