

About this worksheet
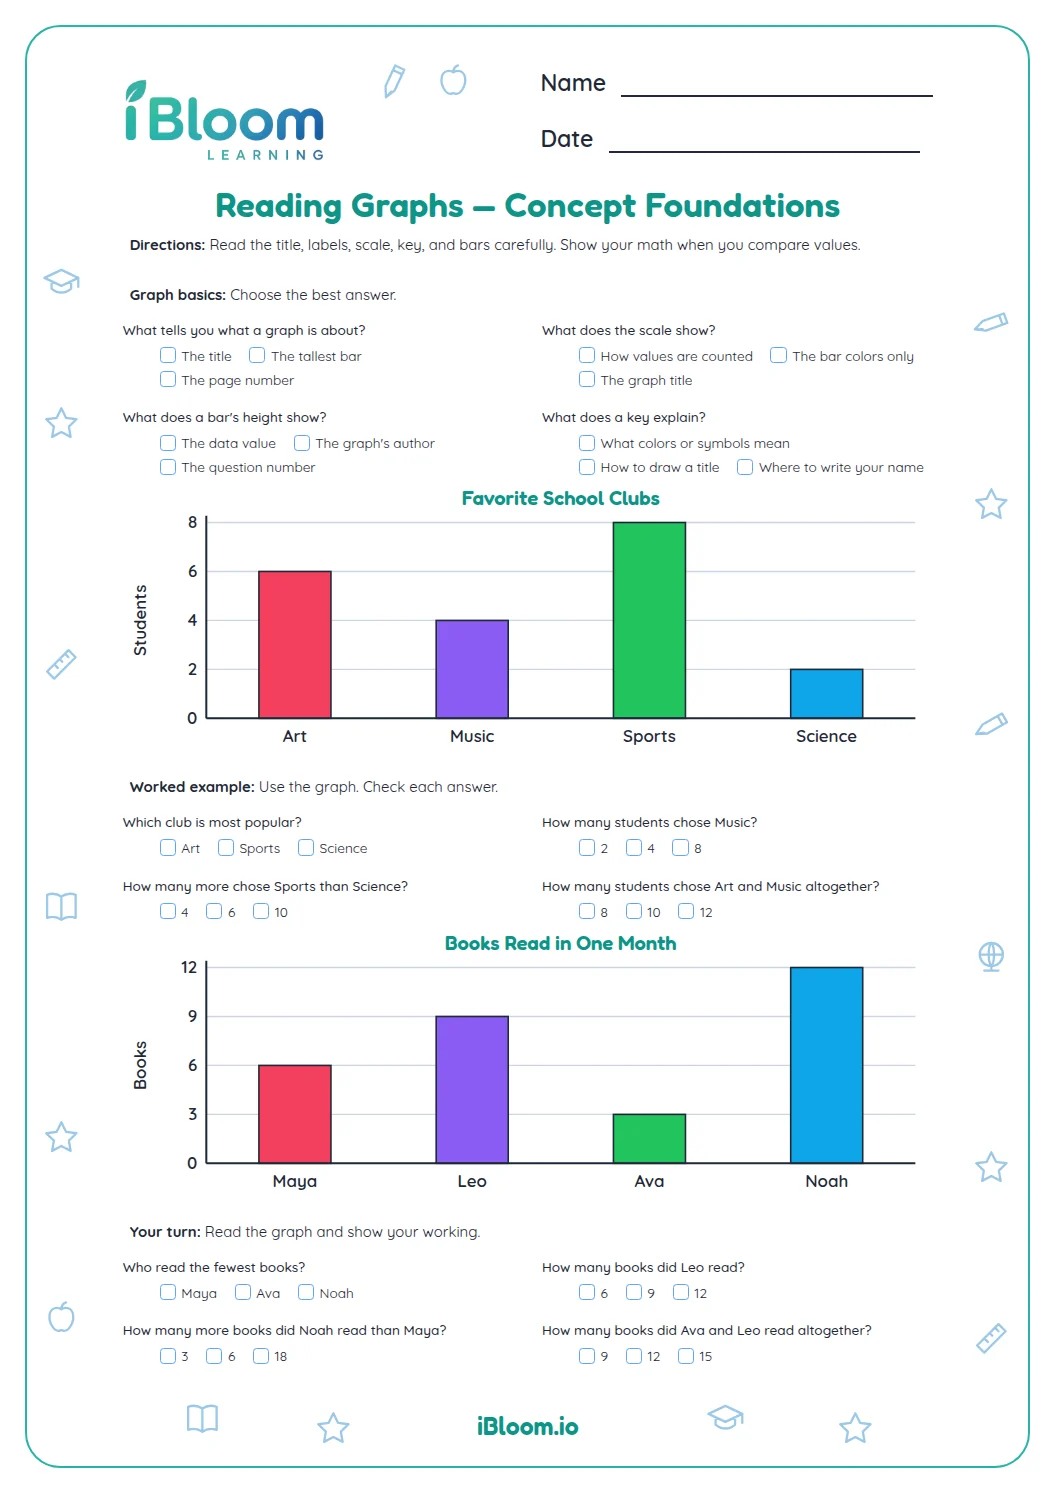
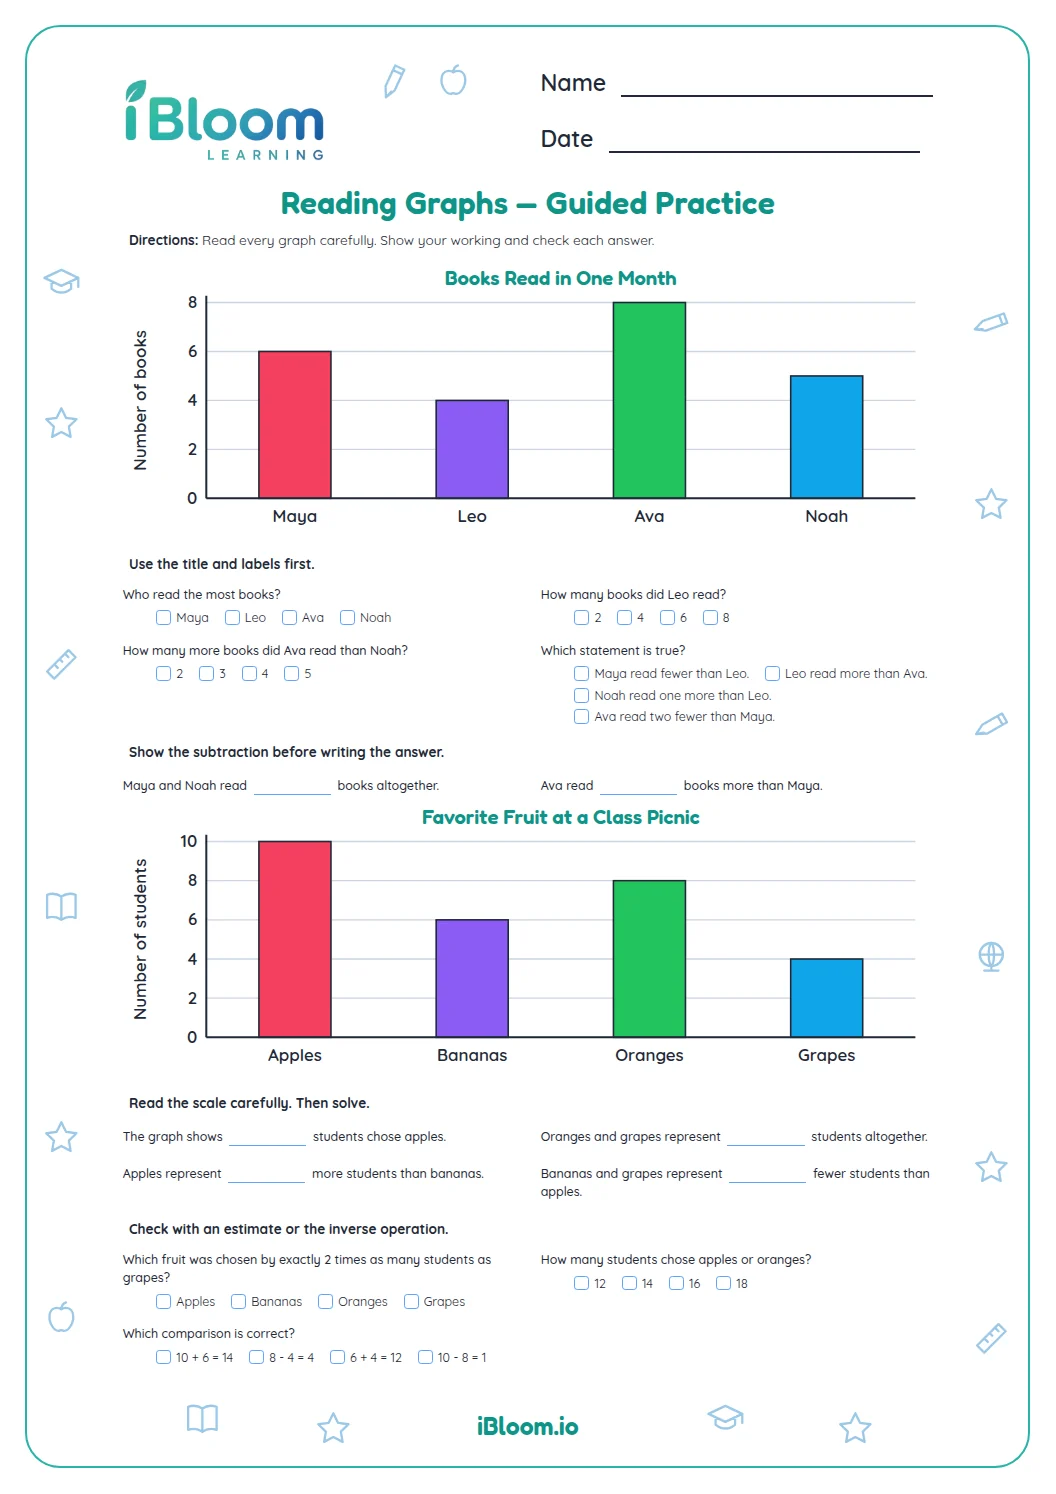
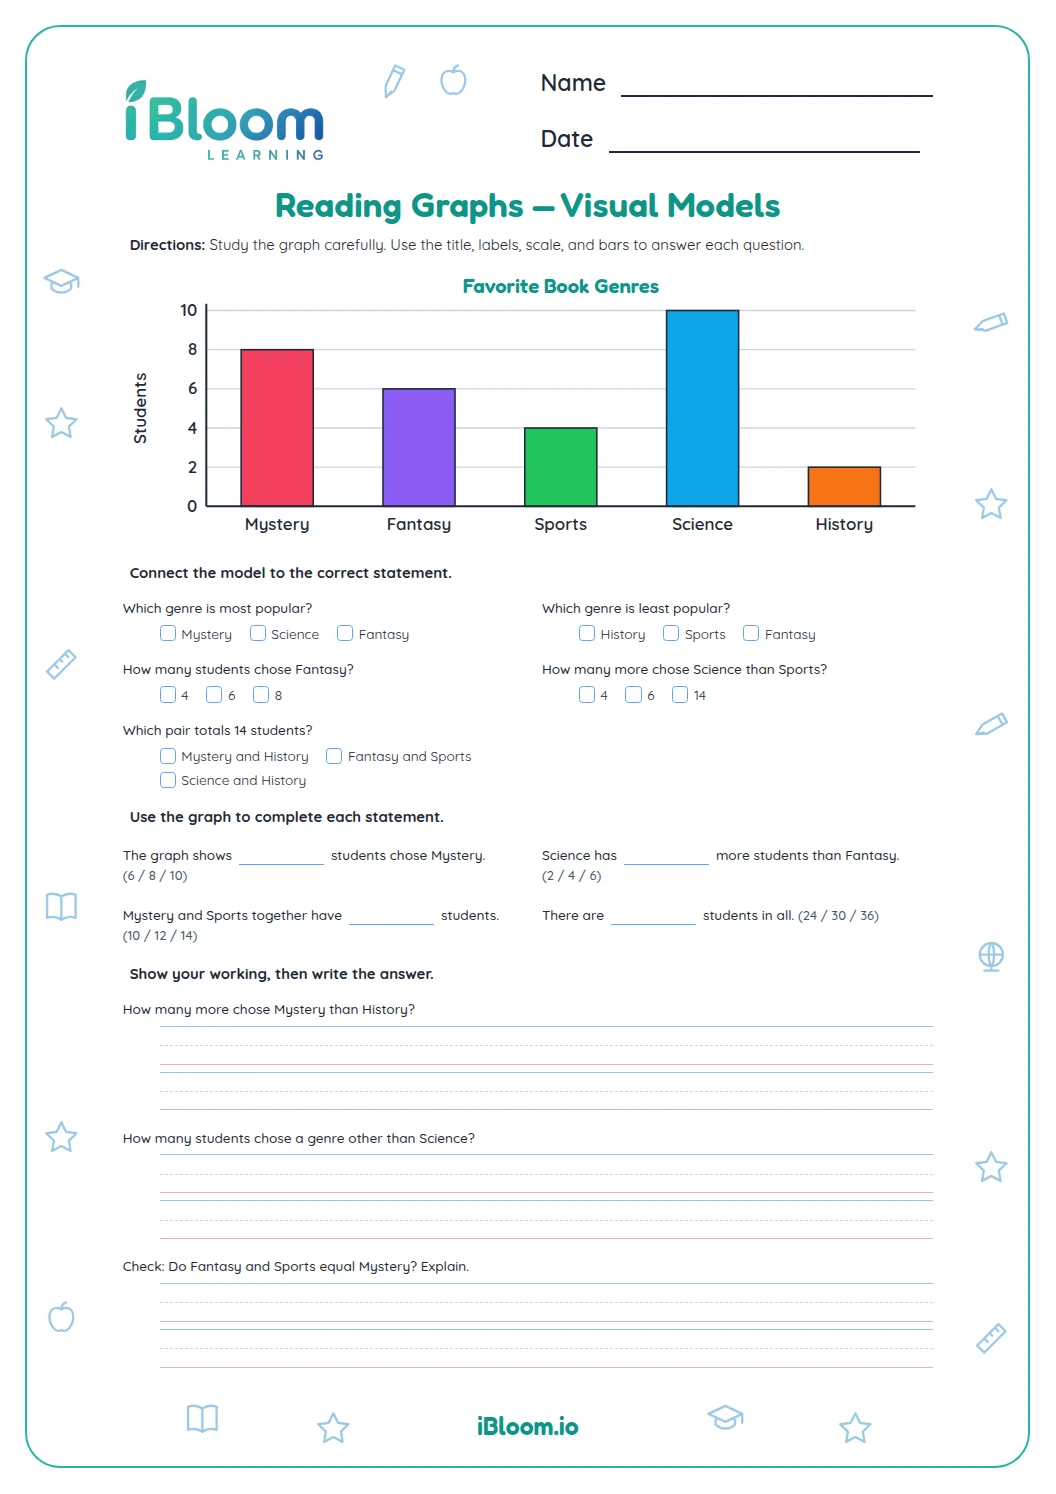
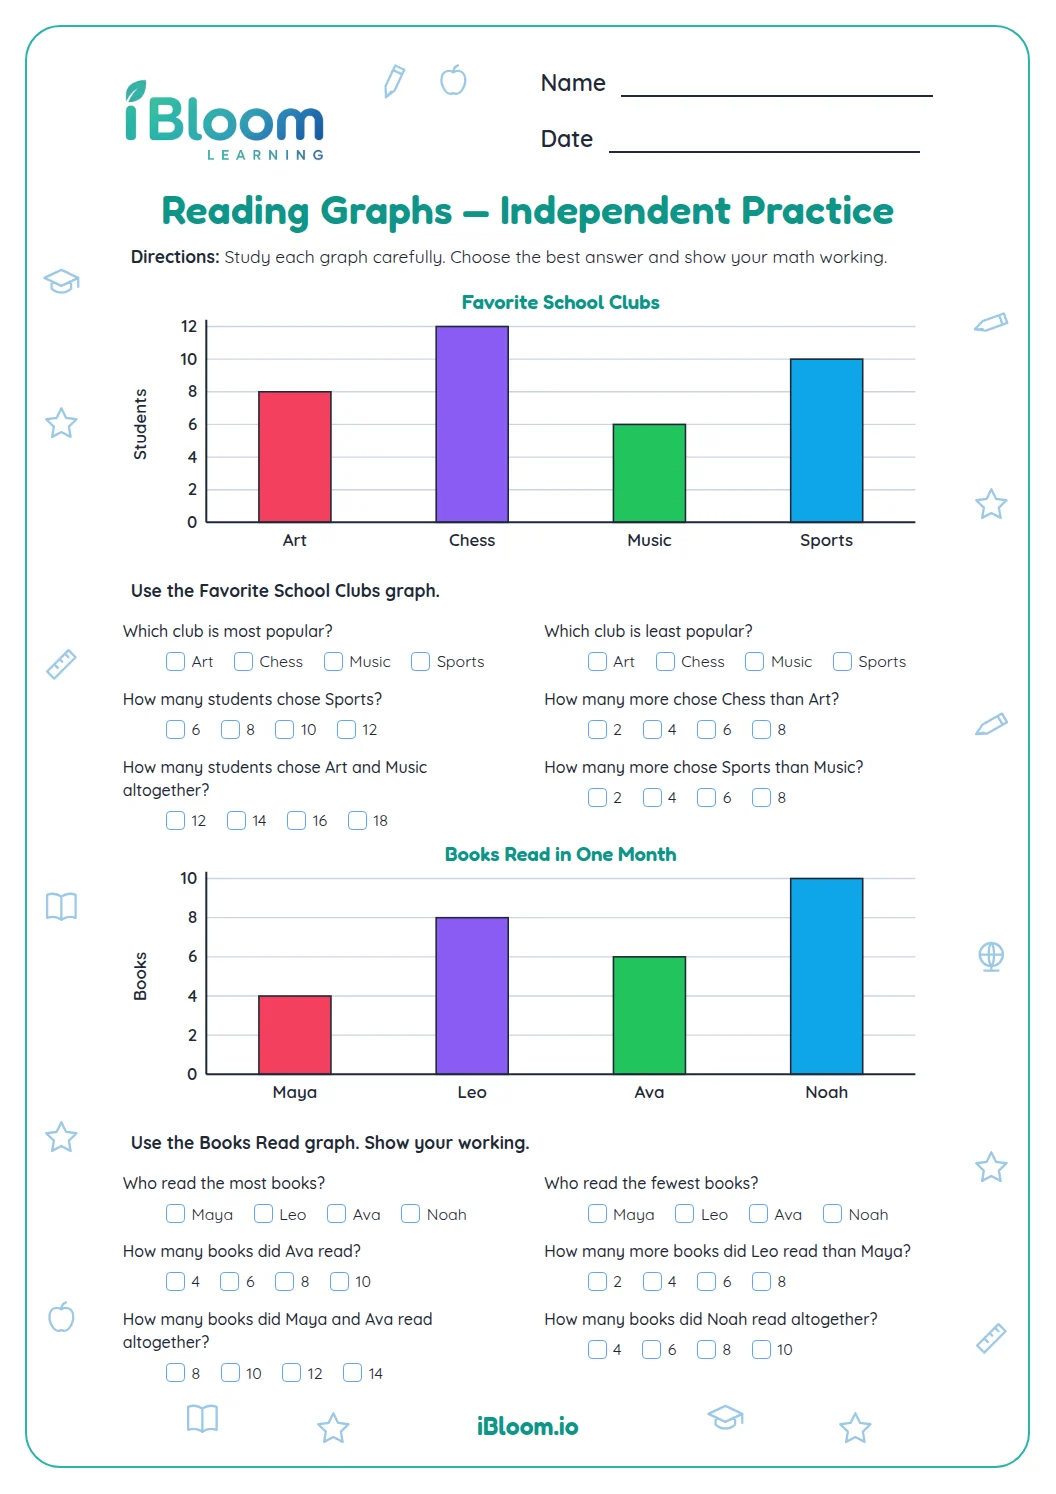
This free printable Grade 4 worksheet gives students two line graphs and 13 questions to complete independently. Parts A and B follow a plant’s height over five weeks; Parts C and D follow a walker moving straight away from the start over four minutes. Students read labeled scales, locate measurements, find equal values, and calculate changes between times. The measurement problems practice Common Core 4.MD.A.2 through lengths in centimeters and meters. Each graph is paired with questions about its data, and a separate answer key gives values, units, and time labels for checking.
Aligned to 4.MD.A.2
What should students read before answering?
Start with the title and the vertical axis. Plant Height measures centimeters with gridlines 2 cm apart. Walking Distance measures meters with gridlines 100 m apart. The labels along the bottom show when each measurement was taken.
A point represents one recorded measurement. To read it, find the time along the bottom, move up to the point, then across to the measurement scale.
How do students calculate growth between weeks?
The height at the later week includes the growth that happened before it. To find only the growth between two weeks, subtract the earlier height. Question 4 uses Week 2 and Week 3.
- 1Week 2: 6 cm; Week 3: 10 cm
- 2Growth = 10 − 6 = 4 cm
- 3Check: 6 + 4 = 10 cm
What does a flat segment mean here?
The plant is 10 cm tall in both Week 3 and Week 4, so the segment connecting those points is horizontal. Its recorded height did not change between those measurements. The plant still has a height of 10 cm.
On Walking Distance, the walker moves straight away from the start. The last point is 600 m, and the goal is 1,000 m. Subtracting 600 from 1,000 tells how far remains. Because the walker keeps moving away, the increase between two readings gives the distance walked during that interval.
How to use this worksheet
- 1Read both graph titles and identify the units.
- 2Check the value of one vertical grid interval on each graph.
- 3Complete the seven Plant Height questions using its points.
- 4Complete the six Walking Distance questions, subtracting values when asked about an interval.
- 5Compare answers with the key and reread the axis for any missing or incorrect units.
Mistakes to check together
The mistake
Counting each gridline as one unit.
The fix
Read the axis labels: each step is 2 cm on Plant Height and 100 m on Walking Distance.
The mistake
Answering 10 cm for growth from Week 2 to Week 3.
The fix
Ten is the final height. Subtract the earlier 6 cm to get 4 cm of growth.
The mistake
Reading the flat plant segment as zero height.
The fix
Trace across to the vertical axis. Both points are at 10 cm; the change is zero, not the height.
Curriculum alignment
Solve measurement problems using lengths read from line graphs.
On this sheet: Students read scaled length measurements and solve difference and remaining-distance problems.
Show the official wordingHide the official wording
Use the four operations to solve word problems involving distances, intervals of time, liquid volumes, masses of objects, and money, including problems involving simple fractions or decimals, and problems that require expressing measurements given in a larger unit in terms of a smaller unit. Represent measurement quantities using diagrams such as number line diagrams that feature a measurement scale.
What to practice next
Make more practice
Further reading
Questions parents and teachers ask
How many graphs are on this worksheet?
There are two line graphs: Plant Height has seven questions, and Walking Distance has six. The plant data record five weekly measurements in centimeters. The walking data record distance from the start from zero through four minutes. Students read points, calculate changes, and compare gains or amounts still needed.
Are the scales the same on both graphs?
No, Plant Height uses 2-centimeter steps, while Walking Distance uses 100-meter steps. Students should check each vertical axis before reading a point. This matters when they move to the walking data: the same number of grid spaces represents a different quantity, so counting spaces alone will not give the answer.
What does the flat part of Plant Height mean?
The flat segment means the recorded height stayed at 10 centimeters from Week 3 to Week 4. It does not mean the plant was zero centimeters tall. Ask students to read the two points separately, then compare their equal values before describing what happened between those measurements.
How is distance traveled different from distance from the start?
Distance from the start is a measurement at one time. This walker moves straight away from the start, so subtracting two readings gives the distance walked between them. From 2 to 4 minutes, the readings rise from 300 to 600 meters: 600 − 300 = 300 meters walked.
Can students complete this as independent practice?
Yes, the sheet is designed for students who have already learned to read a labeled line graph. Each part names the graph to use and includes questions that move from direct readings to calculations. Use the separate key afterward, asking students to locate the points supporting any answer they revise.