


About this worksheet
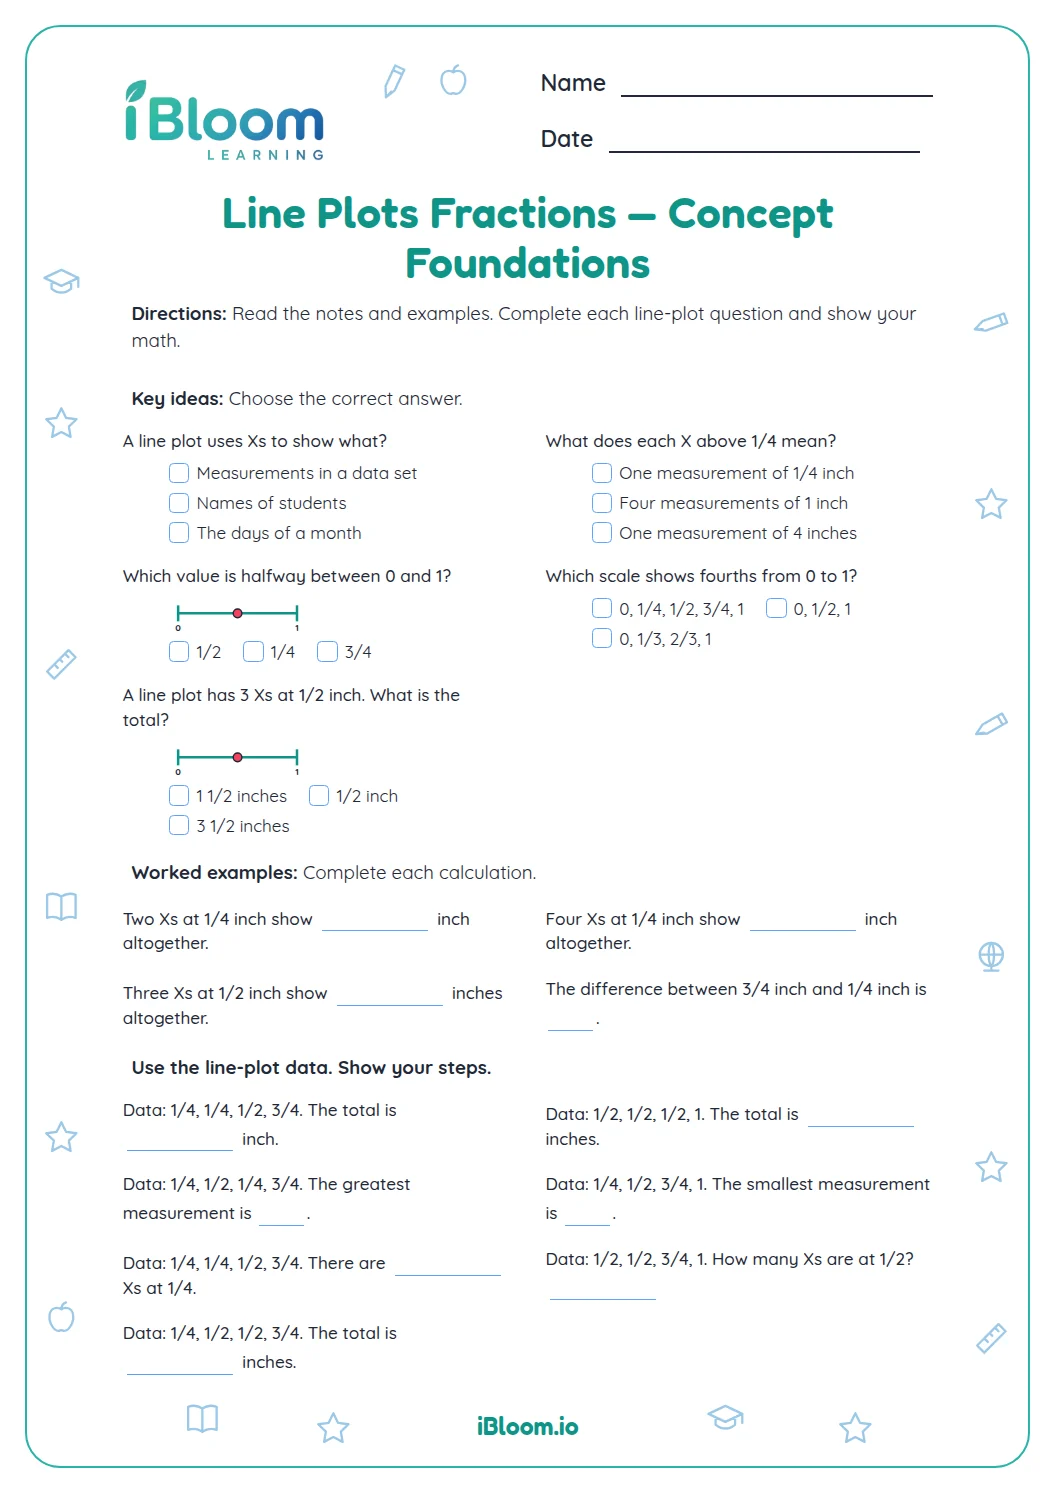
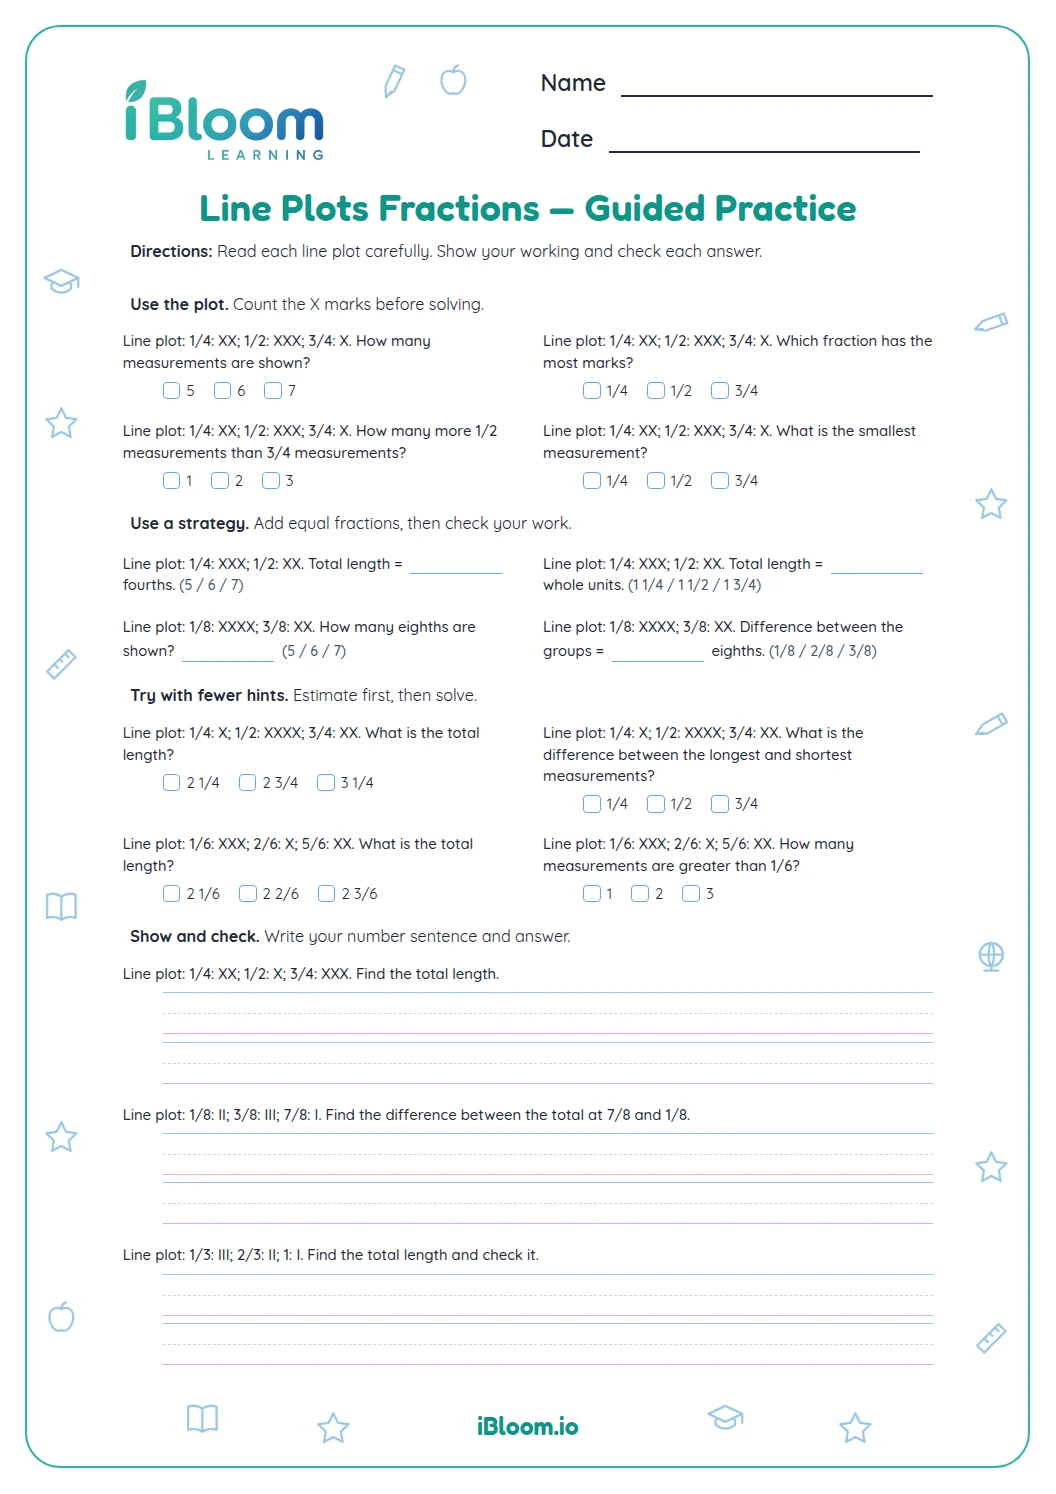
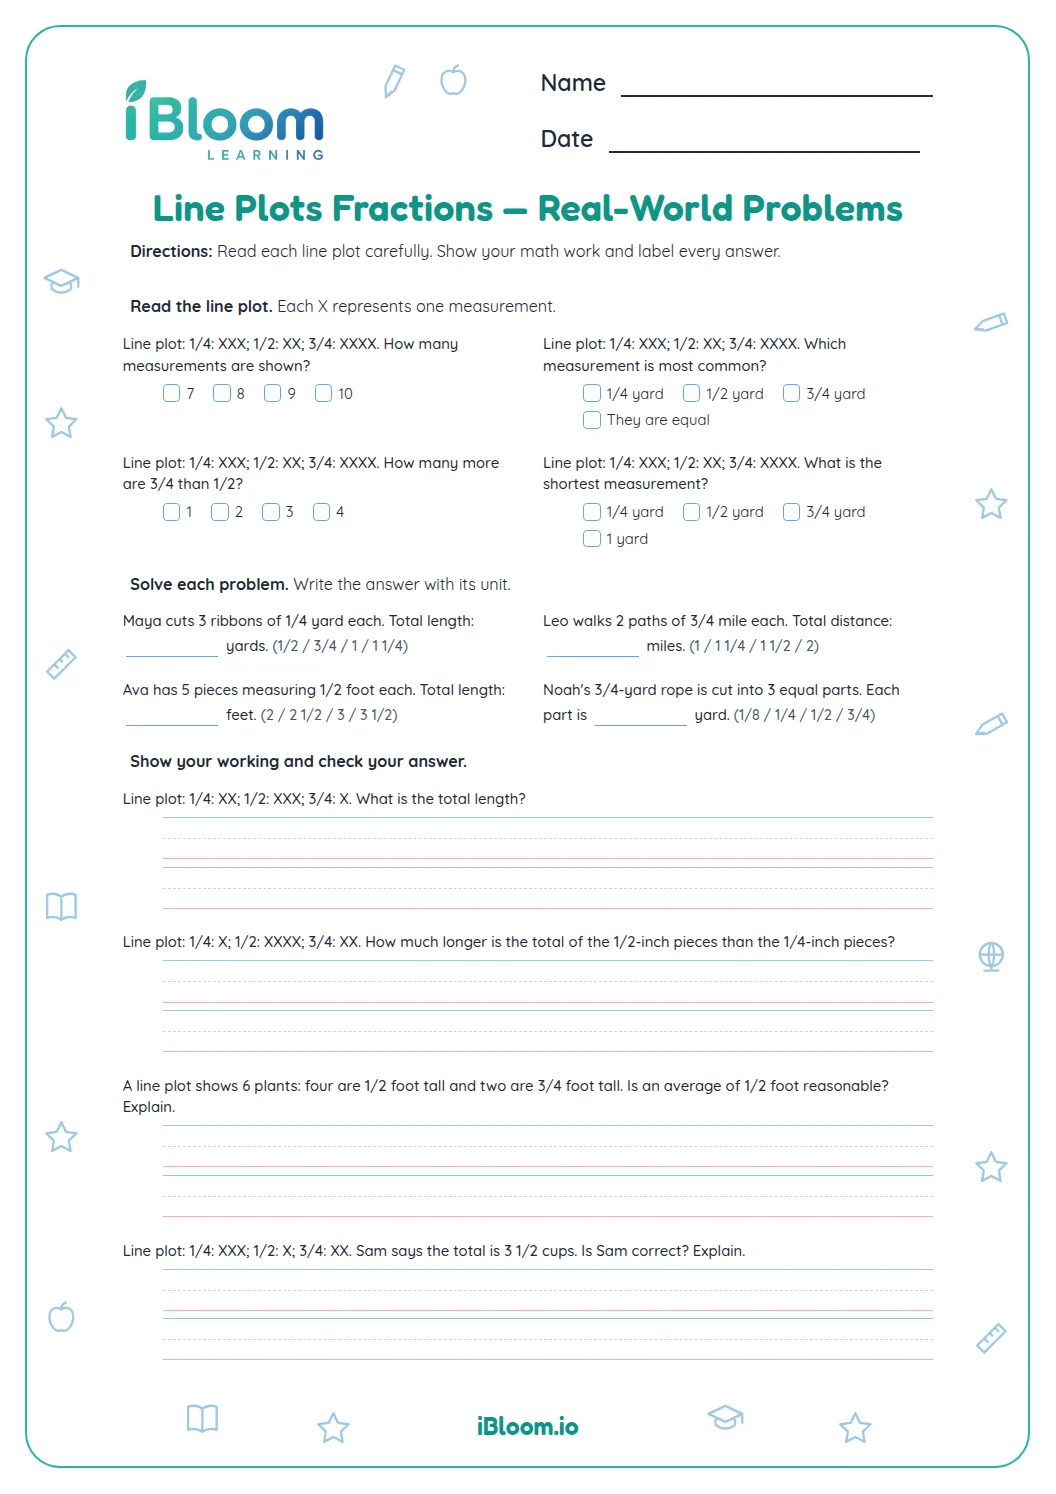
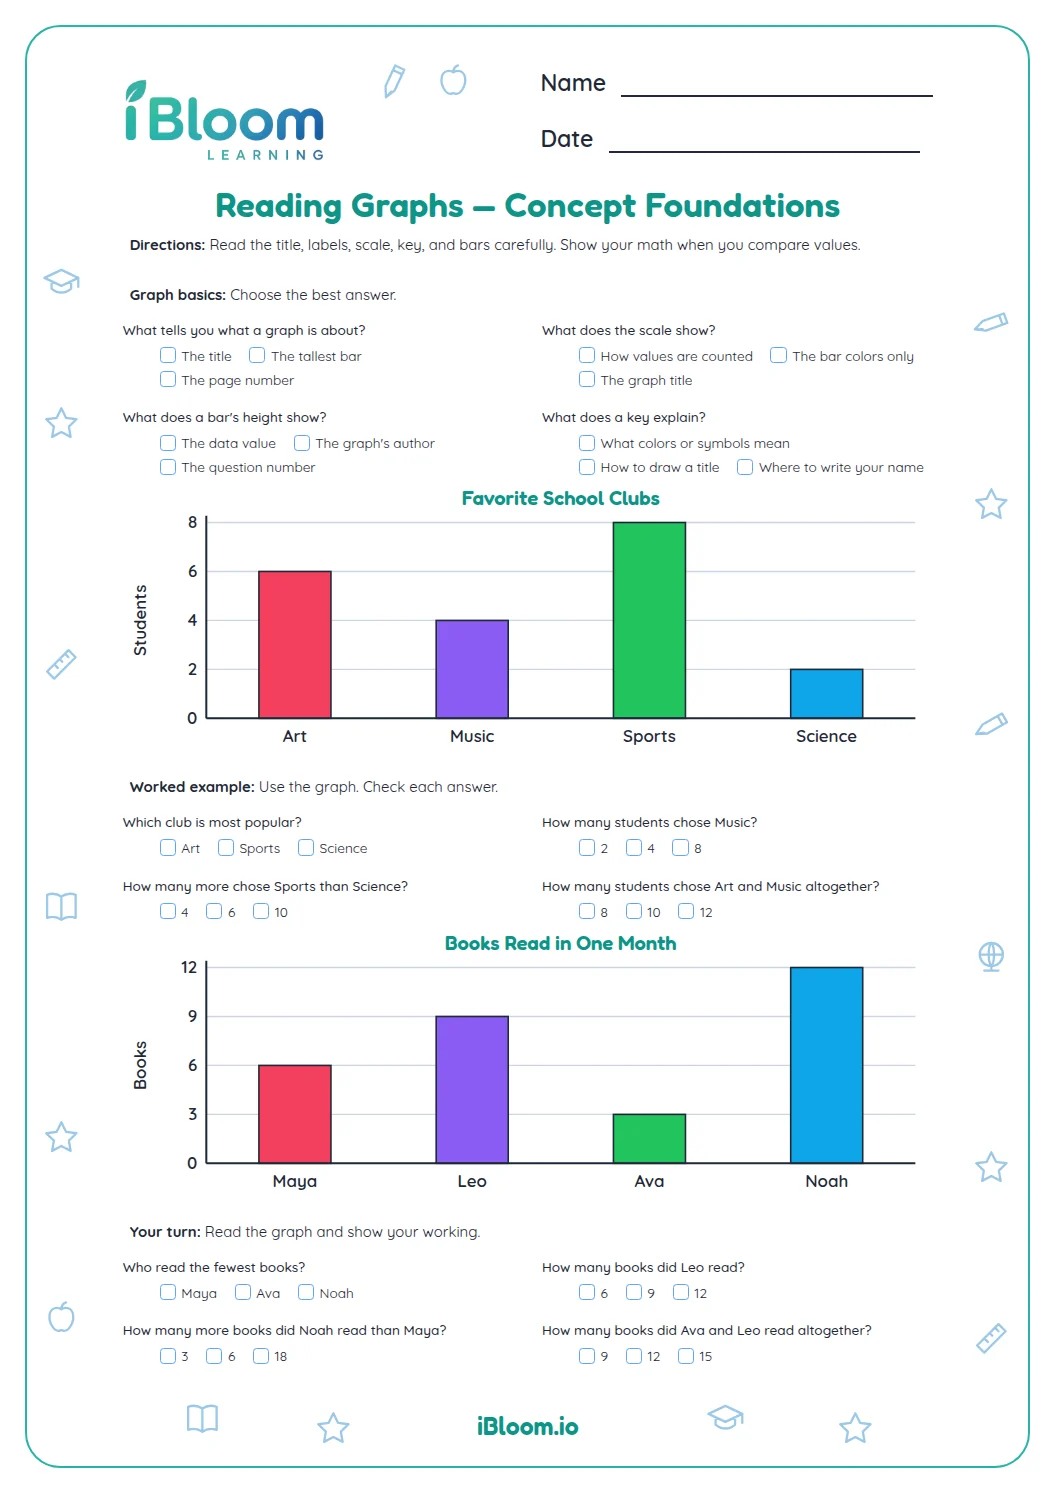
This printable presents two small fraction line plots and 14 graph-based questions. Students count X marks, identify the least and greatest measurements, and compare values in fourths and eighths. A separate answer key lists every response. Reading measurement data on fraction line plots aligns with CCSS 4.MD.B.4.
Aligned to 4.MD.B.4
How do you read a fraction line plot?
Each X stands for one measurement. Question 2 asks how many trail walks measured 1/4 mile. Count the two X marks above 1/4: two walks had that length.
- 1Locate 1/4 on the trail scale.
- 2Count the X marks above 1/4.
- 3Two walks measured 1/4 mile.
How can you compare the measurements?
Find the least and greatest values with X marks, then subtract the smaller fraction from the larger. Question 5 compares the endpoints 0 and 1/4 mile, so the difference is 1/4 mile.
What does the worksheet include?
The 14 questions use two small plots: trail walks in fourths and garden stems in eighths. Students read frequencies, identify endpoints, and compare measurements in the units printed on each plot.
How to read each line plot
- 1Read the measurement label and fraction scale.
- 2Find the fraction named in the question.
- 3Count X marks above that tick for a frequency.
- 4Find plotted endpoints when asked for a range.
- 5Subtract or combine values as the question directs.
Line plot mistakes to avoid
The mistake
Counting tick marks instead of X marks.
The fix
Only X marks represent measured objects.
The mistake
Ignoring the scale unit.
The fix
Include the stated unit in a measurement answer.
The mistake
Subtracting the smaller value from the larger without naming units.
The fix
Keep the plot’s unit in the final difference.
Common Core alignment
The plots show fractional measurement data and support questions about that data.
Read fraction measurements on line plots and solve problems from the plotted data.
On this sheet: Students read frequency marks and compare fractional measurements on four line plots.
Show the official wordingHide the official wording
Make a line plot to display a data set of measurements in fractions of a unit (1/2, 1/4, 1/8). Solve problems involving addition and subtraction of fractions by using information presented in line plots.
What to practice next
Make more practice
Further reading
Questions parents and teachers ask
How many questions and plots are included?
The worksheet has 14 questions across two fraction line plots. One shows trail walks in fourths of a mile, and the other shows garden stems in eighths of an inch. Students read counts and compare plotted values. Questions also ask students to compare the values at the ends of each plot.
What does each X represent?
Each X represents one measured item at the fraction tick below it. On the trail plot, two X marks above 1/4 mean two walks measured one quarter mile. Count the marks to answer frequency questions. The scale labels name the fraction and unit for each measurement.
Which fractions appear in the plots?
The trail plot uses fourths, with measurements at 0 and 1/4 mile. The garden plot uses eighths, with measurements at 0 and 1/8 inch. The scale and unit printed with each plot guide the answer. These data sets ask students to read the plotted values before comparing.
Is an answer key included?
Yes. The printable includes a separate two-page answer key with answers to all 14 questions in order. Students can check their counts, endpoints, and fraction differences after completing the worksheet. The key repeats the worksheet numbering to make checking each response straightforward.
How do students find a measurement difference?
Find the least and greatest plotted values, then subtract the smaller from the larger. For example, the trail data range from 0 to 1/4 mile, so the difference is 1/4 mile. Keep the plotted unit in the answer.