Free printable practice
Data Graphing Practice Activities
Class 1 children practise sorting, tallying, collecting data, and reading simple pictographs and bar charts.
Explore Data Graphing
Free printable worksheet PDFs
Preview every available page, then download the free worksheet PDF for home, homeschool, tutoring, or classroom practice.
Preview the exact activity before downloading it.
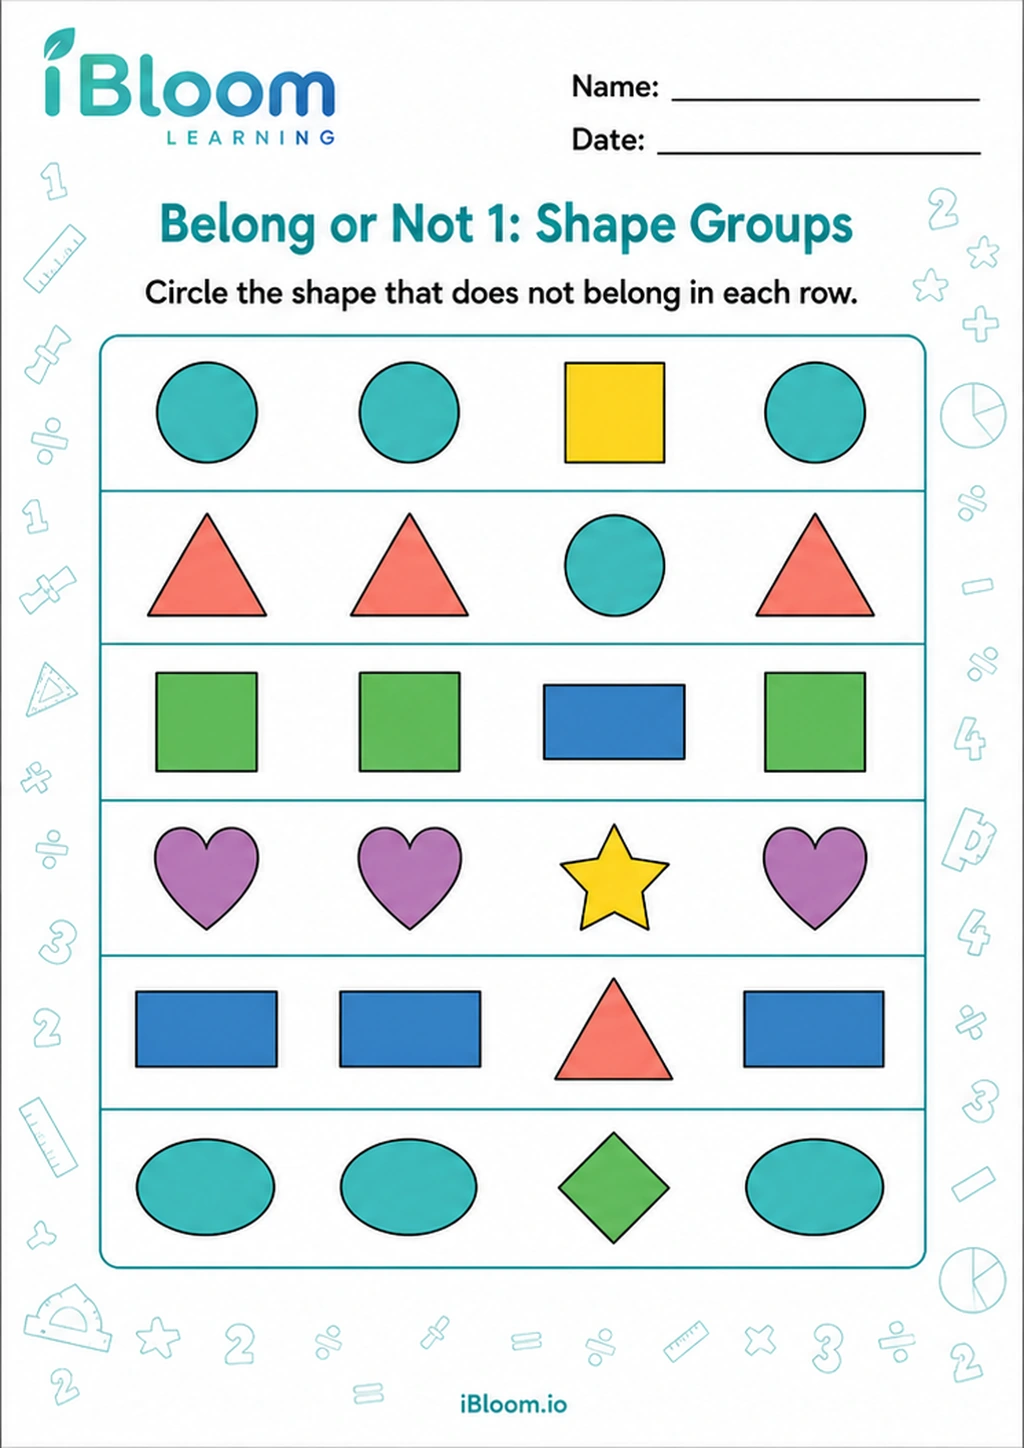 Belong or Not 1: Shape GroupsClass 1 printable practice for Belong and Not Belong.Class 1Free PDF preview
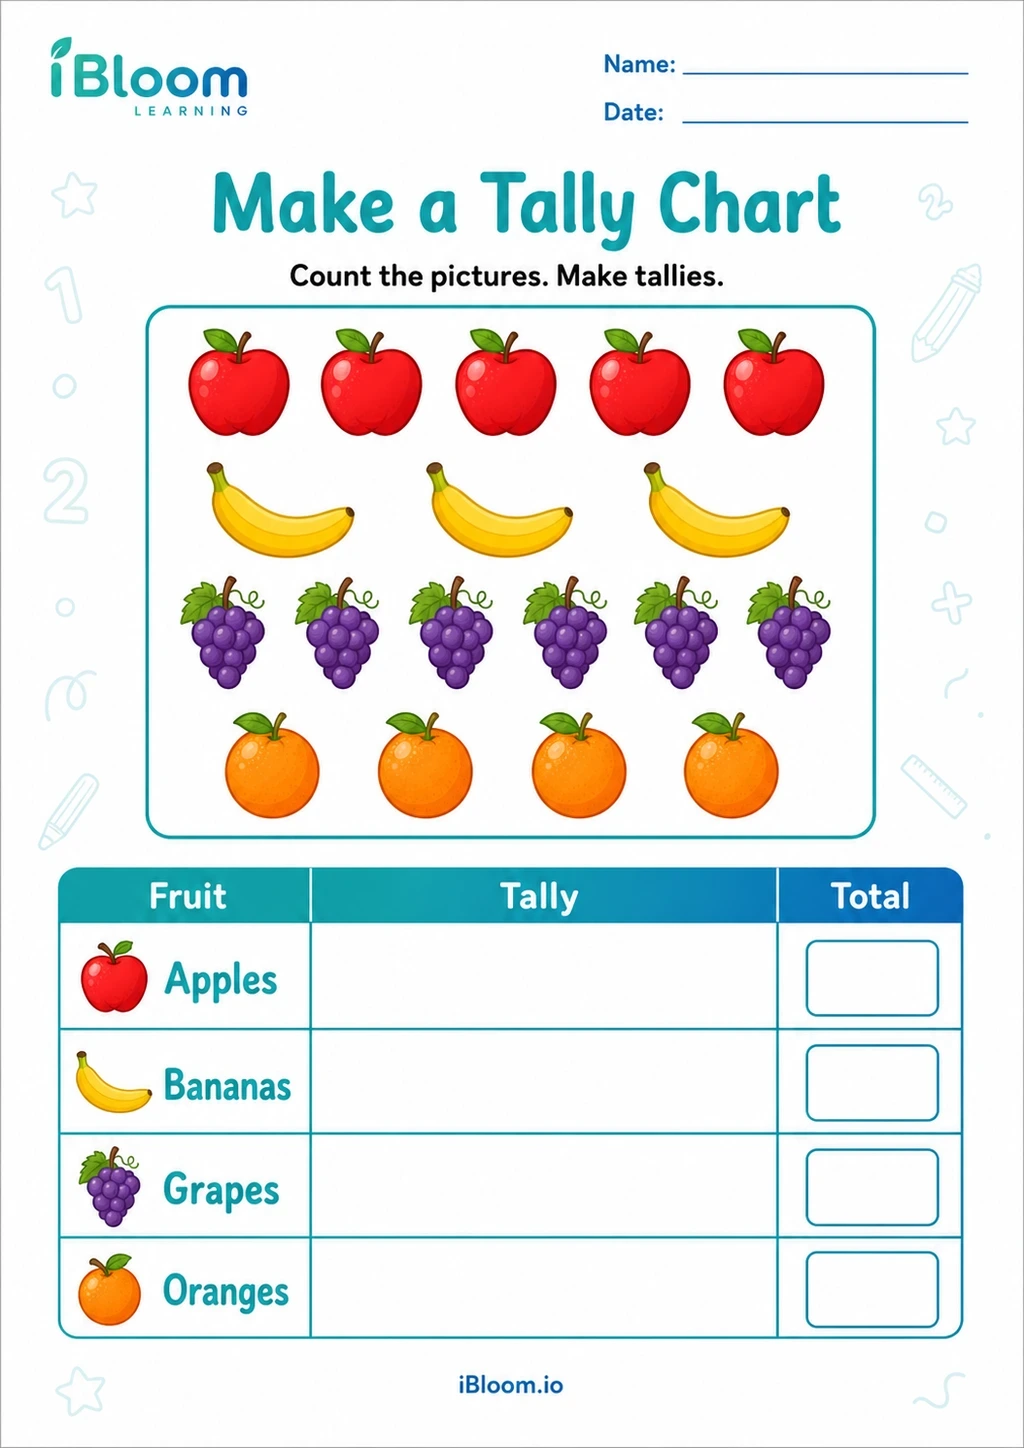 Make a Tally ChartA Class 1 data worksheet where children count fruit pictures and complete a tally chart with totals.Class 1Free PDF preview
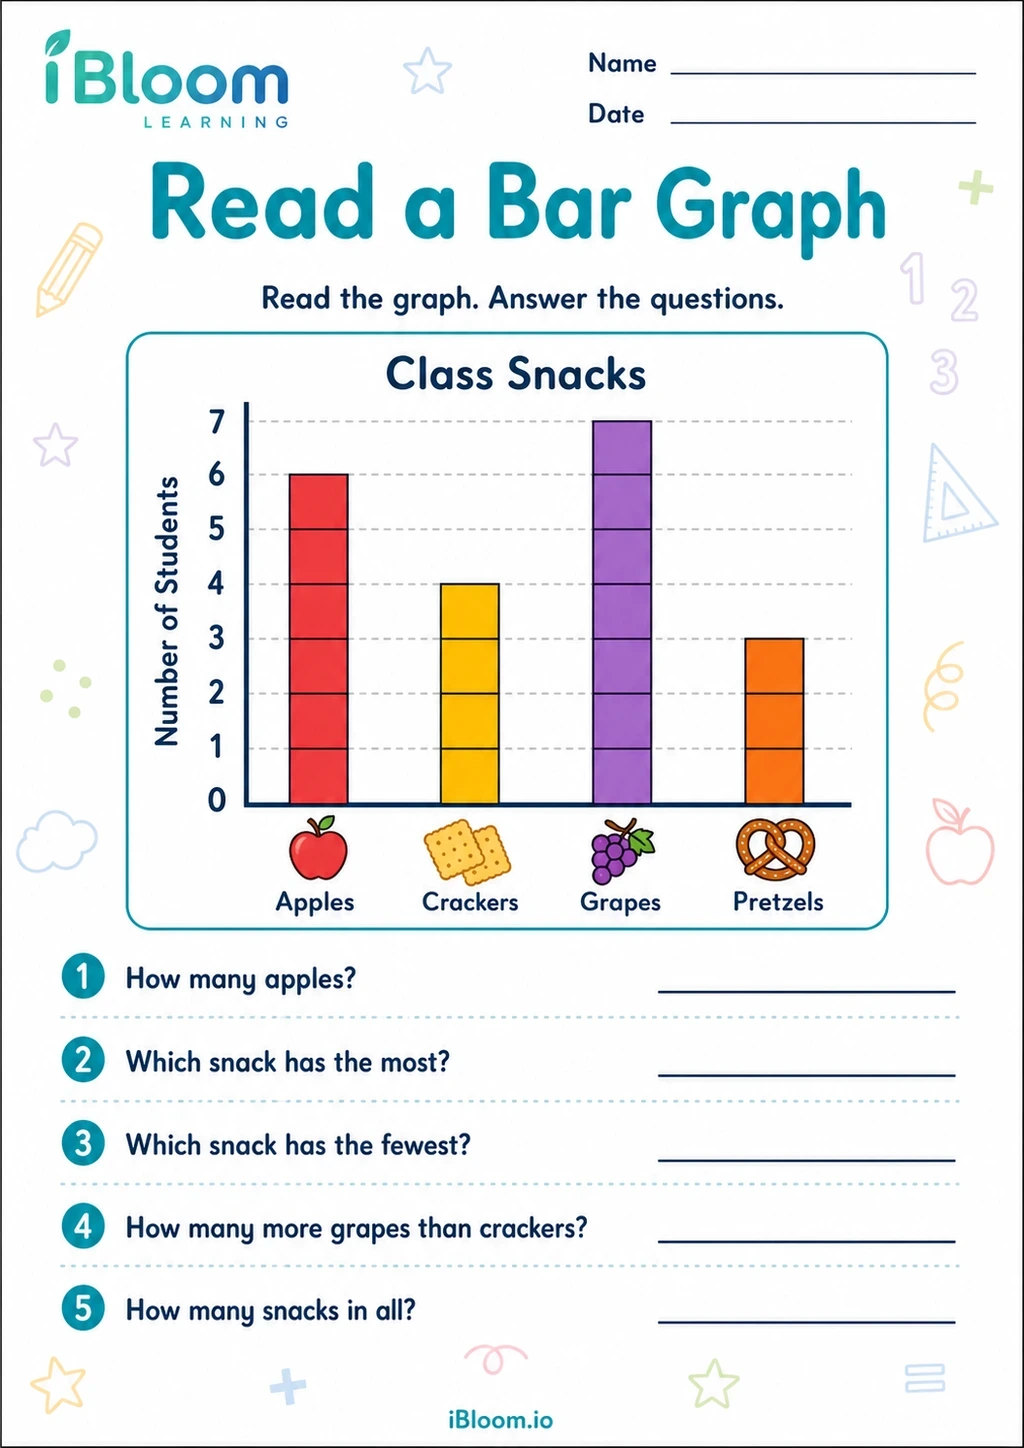 Read a Bar GraphA Class 1 graphing worksheet where children read a class snacks bar graph and answer comparison questions.Class 1Free PDF preview
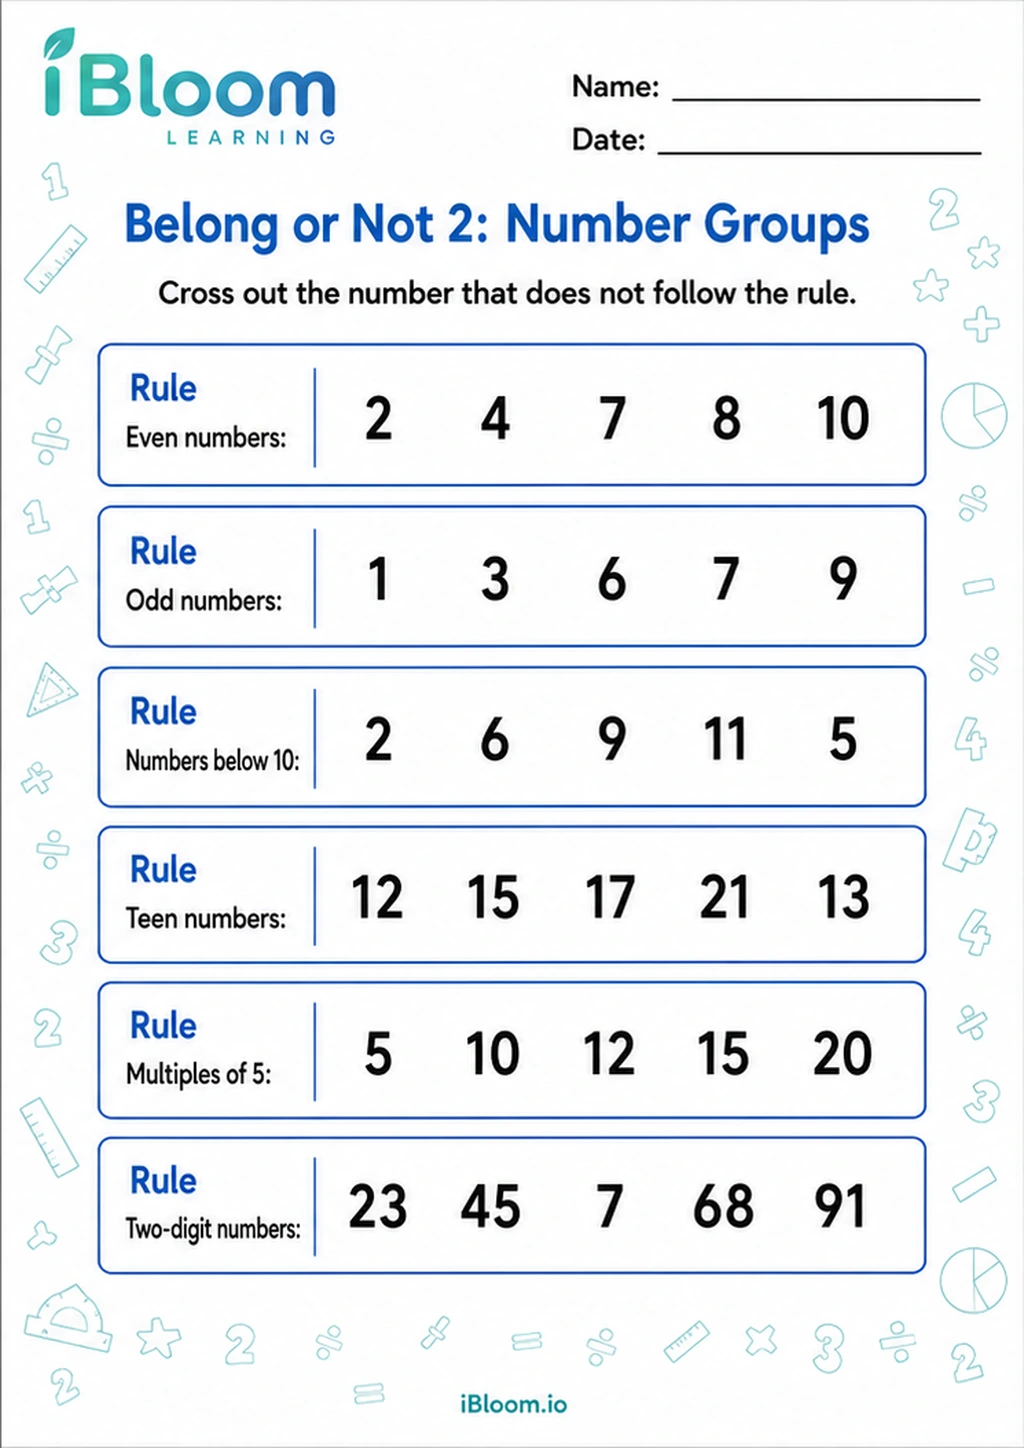 Belong or Not 2: Number GroupsClass 1 printable practice for Belong and Not Belong.Class 1Free PDF preview
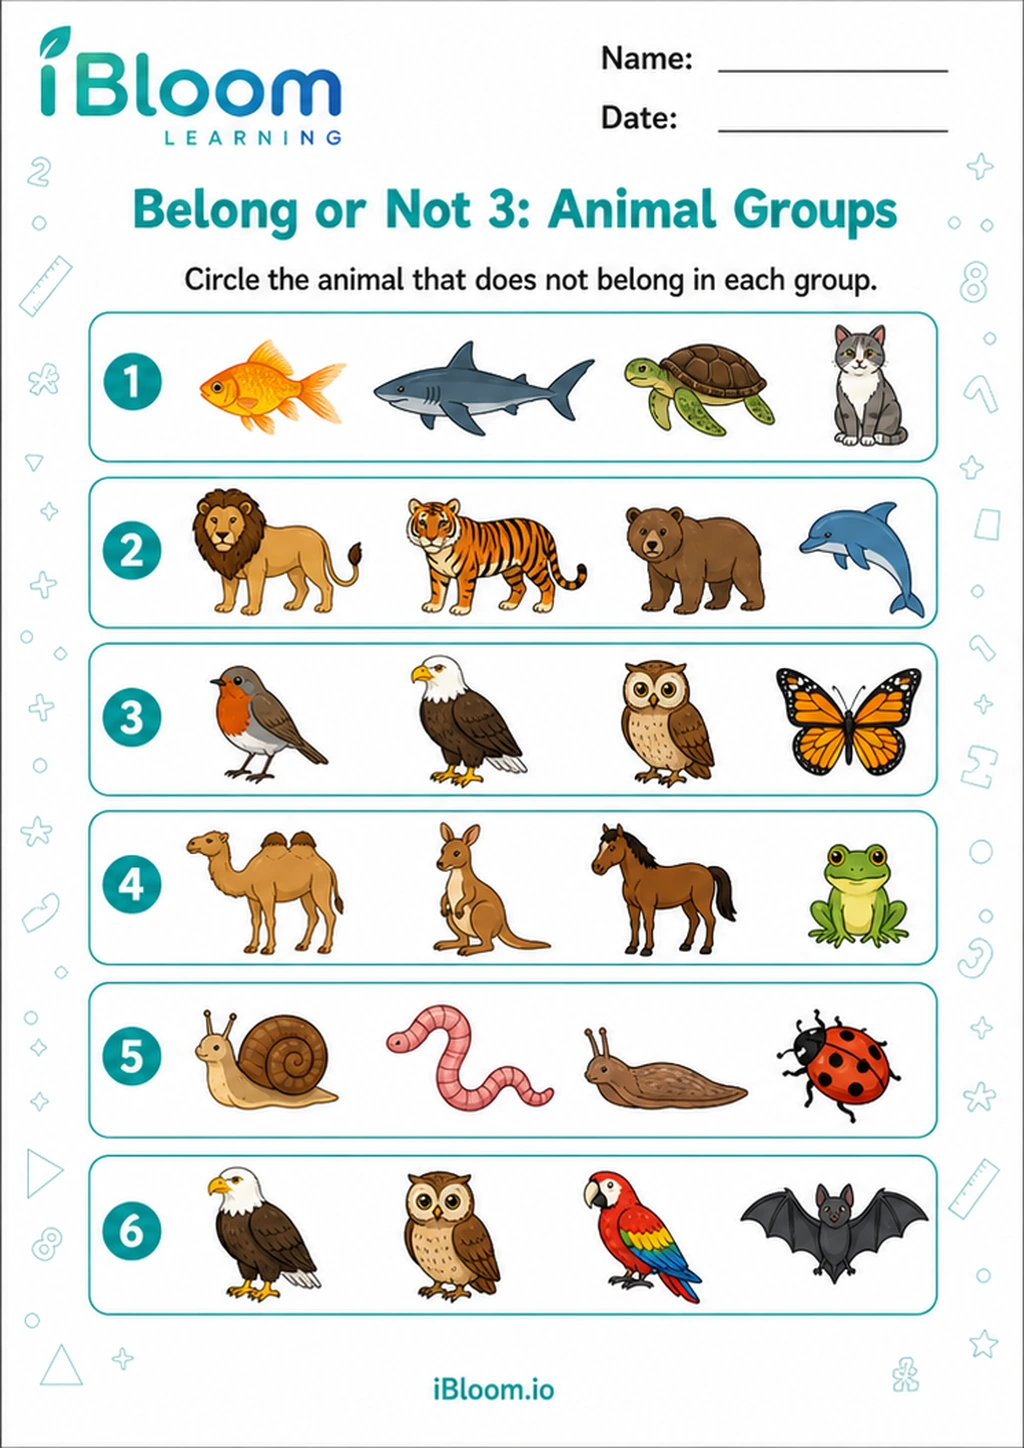 Belong or Not 3: Animal GroupsClass 1 printable practice for Belong and Not Belong.Class 1Free PDF preview
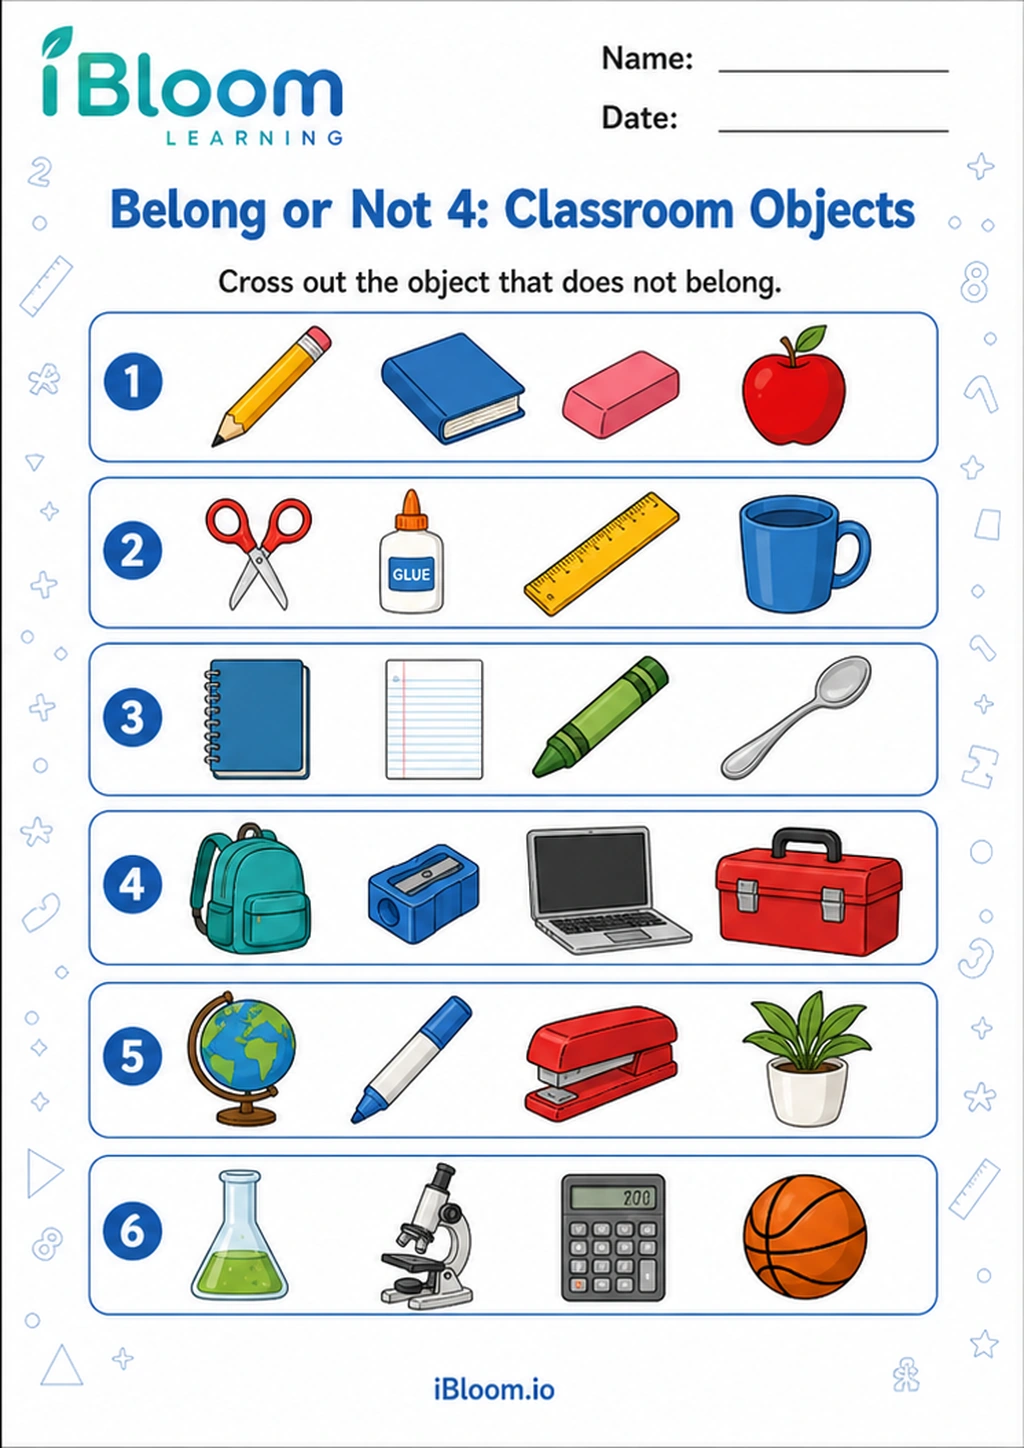 Belong or Not 4: Classroom ObjectsClass 1 printable practice for Belong and Not Belong.Class 1Free PDF preview
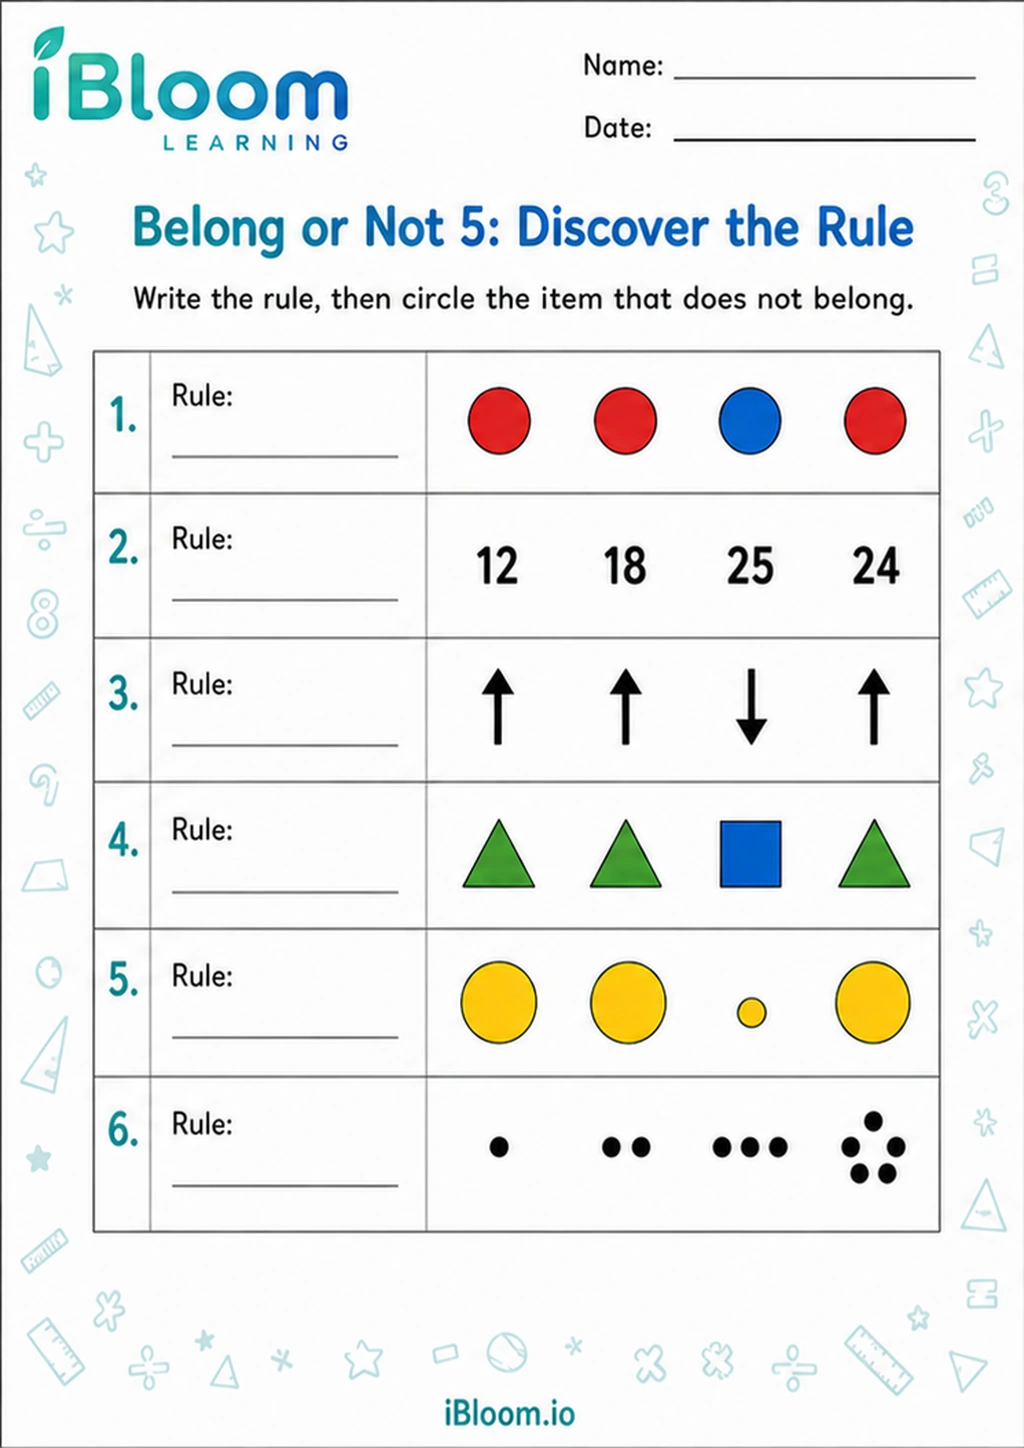 Belong or Not 5: Discover the RuleClass 1 printable practice for Belong and Not Belong.Class 1Free PDF preview
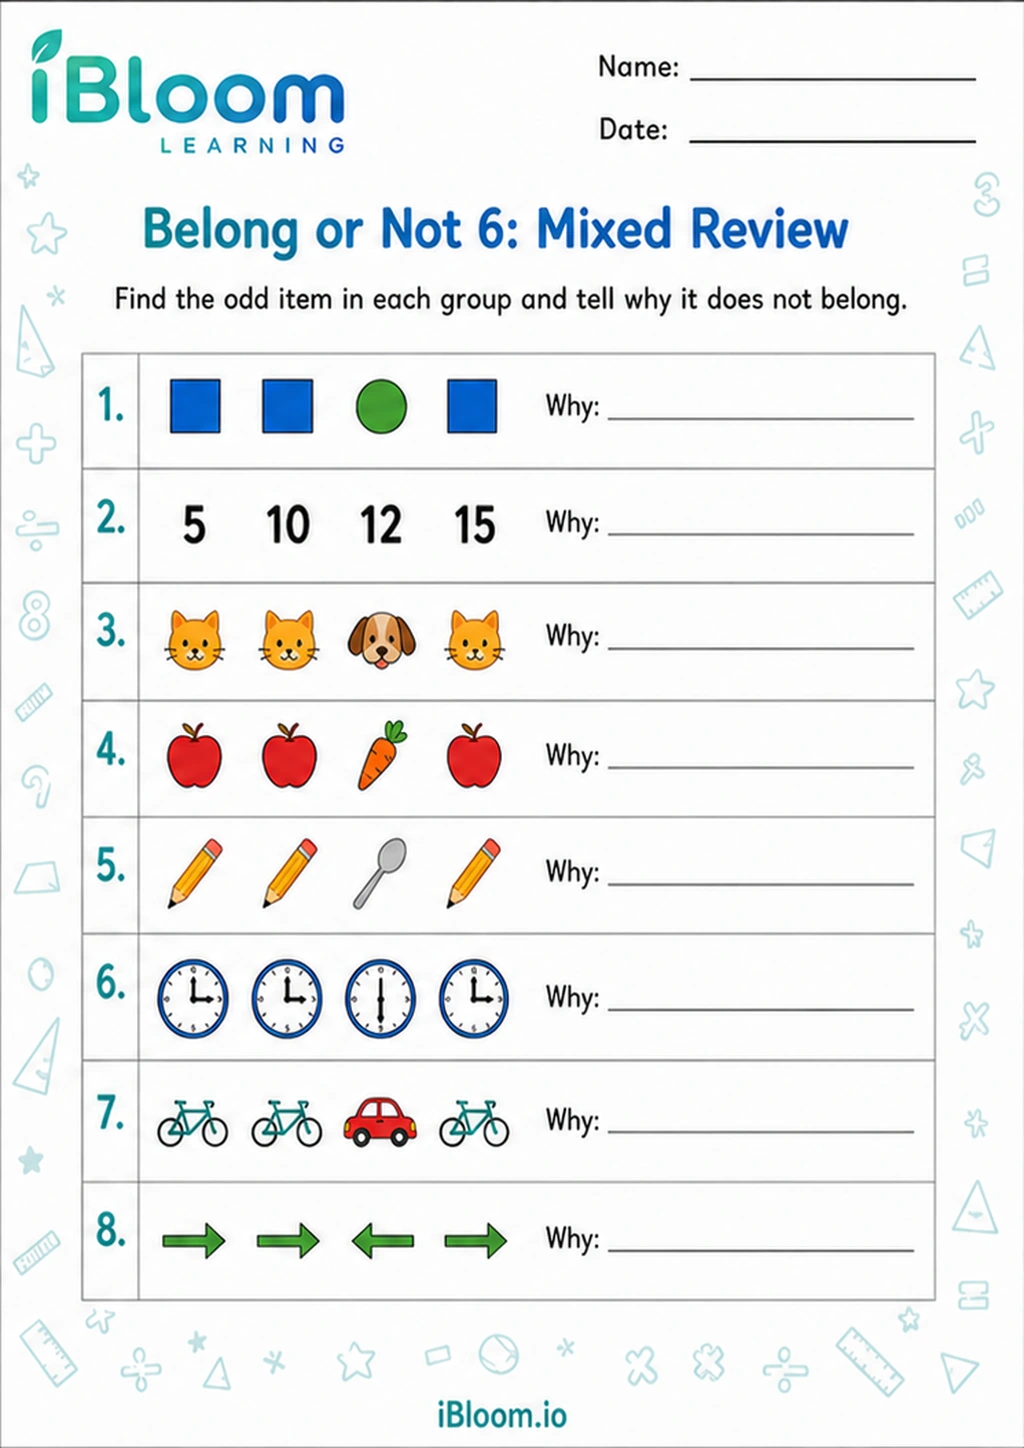 Belong or Not 6: Mixed ReviewClass 1 printable practice for Belong and Not Belong.Class 1Free PDF preview
Practice that builds confidence
From sorting to data
These Class 1 Mathematics data graphing worksheets help children organise information in simple, visual ways. Learners practise sorting objects, spotting same and different items, using tally marks, and turning counted data into charts.
The printable activities cover belong and not belong, sorting, sort and count, collecting data, tally sheets, pictographs, blank bar charts, bar charts, bar graphs, and reading bar charts. Each page builds early data handling step by step.
Young children begin graphing by noticing attributes: colour, shape, size, type, or category. In belong and not belong tasks, they decide which item fits a group. In same and different activities, they compare details. This prepares them to sort objects and count how many are in each group.
Tally marks and counting groups
Tally sheets show data in a compact form. Children practise making one mark for each item and grouping the fifth mark across the first four. This helps them count collected data accurately before drawing a pictograph, bar chart, or bar graph. The vocabulary includes data, sort, count, tally, more, fewer, equal, row, column, and category.
Reading charts and graphs
In pictographs, children read pictures as data. In bar charts and bar graphs, they compare bar heights or lengths. Worksheets may ask which group has the most, which has the least, or how many are in a category. Blank bar charts let students transfer counted information into a simple visual display.
Parent practice routine
At home, collect data from real life. Ask your child to sort spoons and forks, toys by colour, or fruits by type. Make tally marks together, count each group, and draw a simple bar using boxes. Then ask two questions: “Which is more?” and “How many are there?” This connects the worksheet skill to everyday maths.
Classroom uses
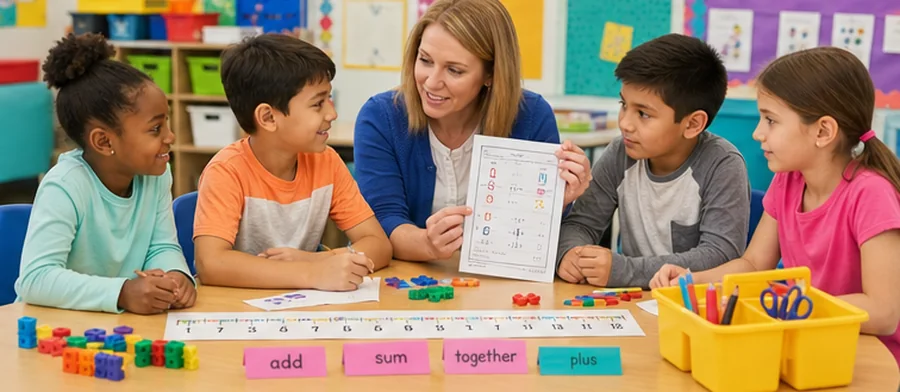
Teachers can use these pages for maths centres, whole-class surveys, notebook practice, or follow-up after a sorting activity. Children can collect data about favourite fruits, transport, classroom colours, or weather, then complete tally sheets and graphs in pairs or independently.
Common errors to watch for
Some children count the same object twice, skip items, or draw bars that do not match the count. Others confuse the tallest bar with the biggest picture rather than the largest number. Encourage pointing to each item once and checking that every tally or bar box represents one object.
Free printable PDF download
Use this class 1 data graphing worksheet page to preview the activity, print it, or download it as a PDF for quick practice. It works well for homework, homeschool lessons, tutoring, morning work, revision, and classroom centers.
Answers and answer key support
After the child completes the worksheet independently, parents and teachers can use the answer support or answer key information to check the work, review mistakes, and choose the next practice step.
Why iBloom worksheets help
The collection moves naturally from concrete sorting to recorded data and then to reading graphs. A child-friendly strategy is: sort first, count carefully, mark the data, draw the chart, and tell what it shows.
Helpful answers
Frequently asked questions
What data graphing skills are suitable for Class 1?
Class 1 children can sort objects, count groups, use tally marks, collect simple data, and read basic pictographs and bar charts.
How are sorting and graphing connected?
Sorting puts items into categories. Once children count each category, they can show the results in a tally sheet, pictograph, or bar chart.
What is the purpose of tally marks in these worksheets?
Tally marks help children record counts one by one, making it easier to organise data before drawing or reading a graph.
Do children draw their own graphs?
Some activities involve reading completed graphs, while blank bar chart and tally sheet pages let children create simple graphs from counted data.
How can I practise data graphing at home?
Ask your child to sort everyday items, make tally marks for each group, draw bars or pictures, and answer which group has more, fewer, or the same.
Is this class 1 data graphing worksheet free?
Yes. You can preview it for free and use the printable worksheet for home or classroom practice.
Can I download this class 1 data graphing worksheet as a PDF?
Yes. Use the worksheet download option to save a printable PDF, or print the worksheet directly from the page.
Does this class 1 data graphing worksheet include answers or an answer key?
When the activity has fixed answers, iBloom includes answer support so parents and teachers can check the completed worksheet.