

About this worksheet
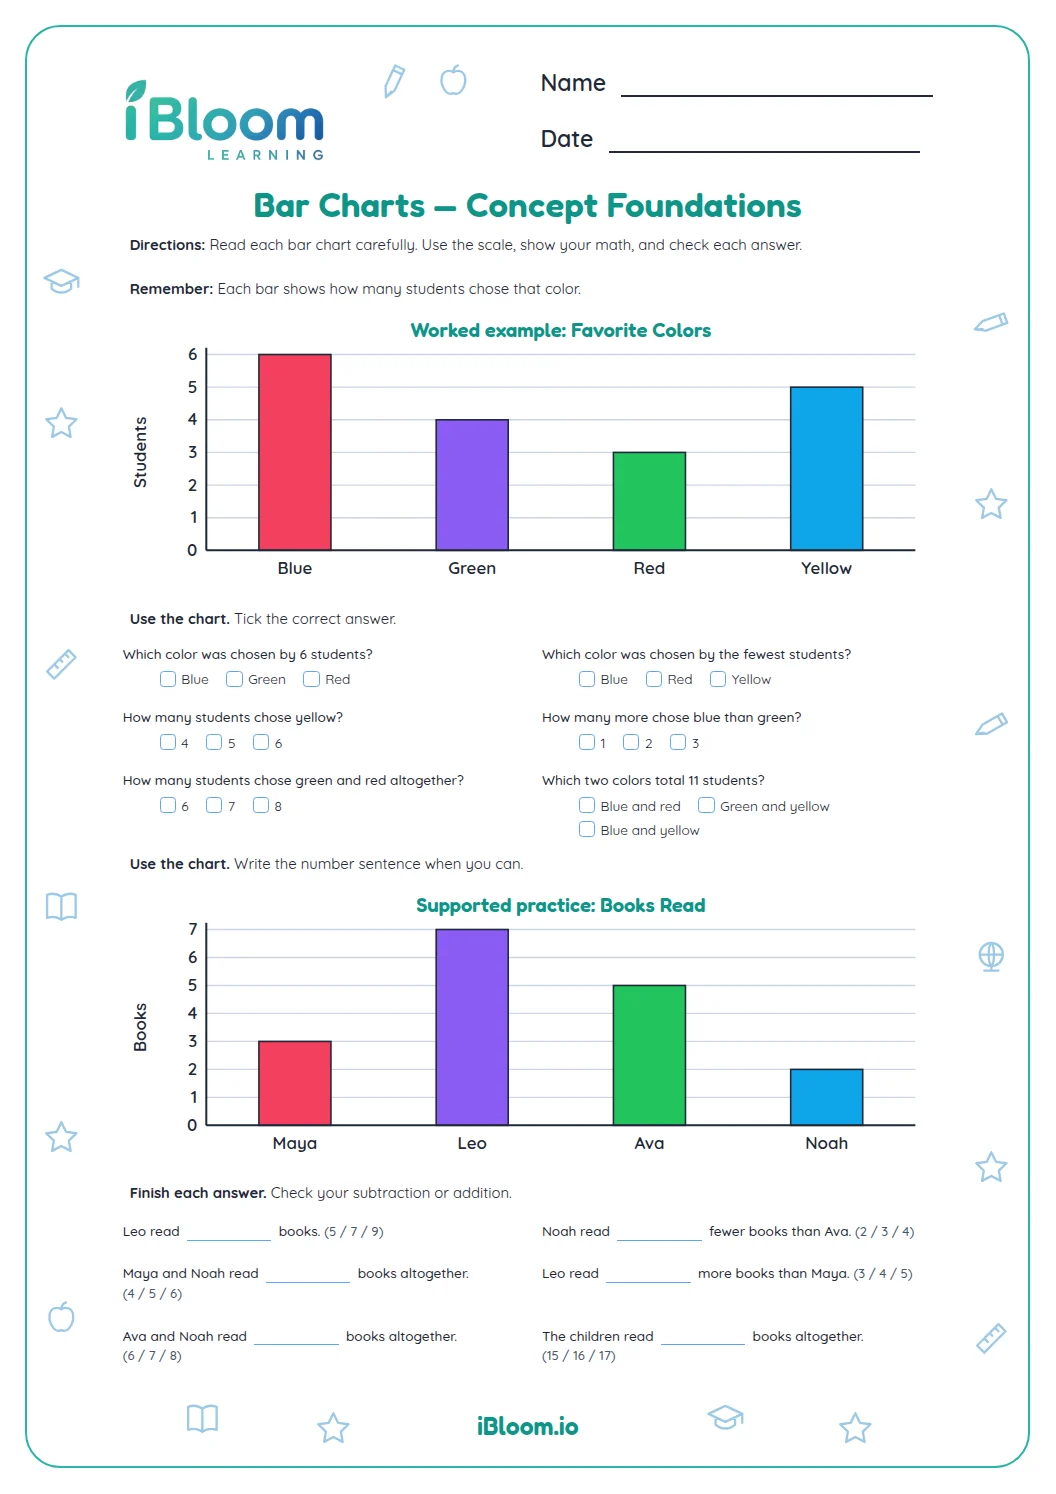
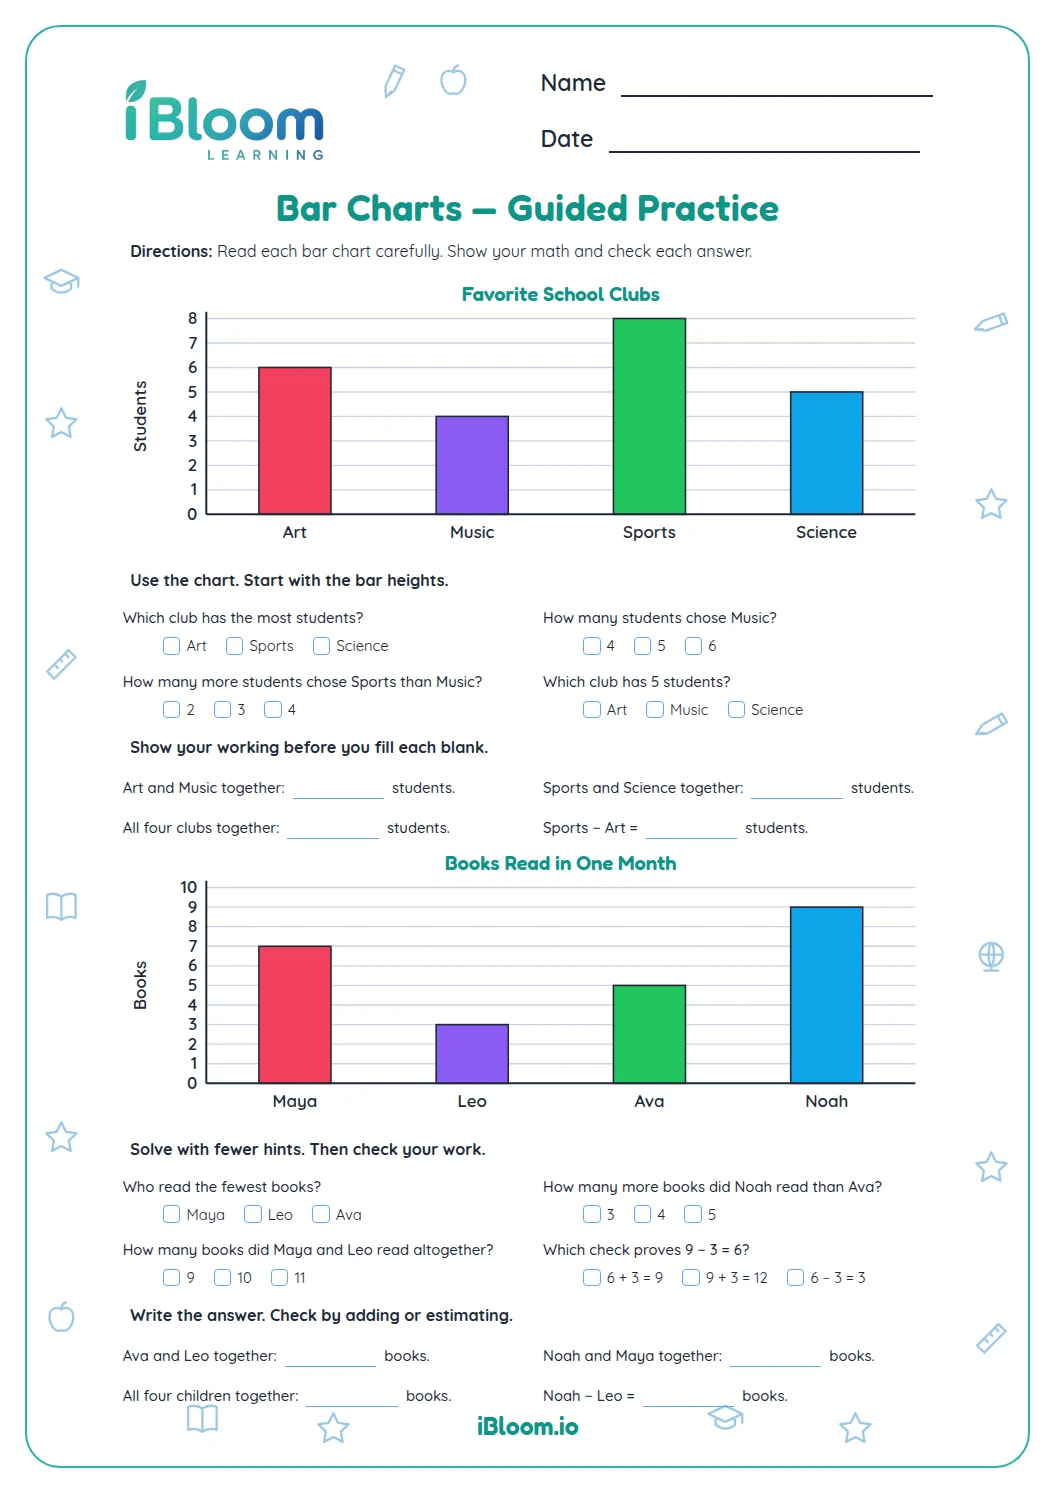
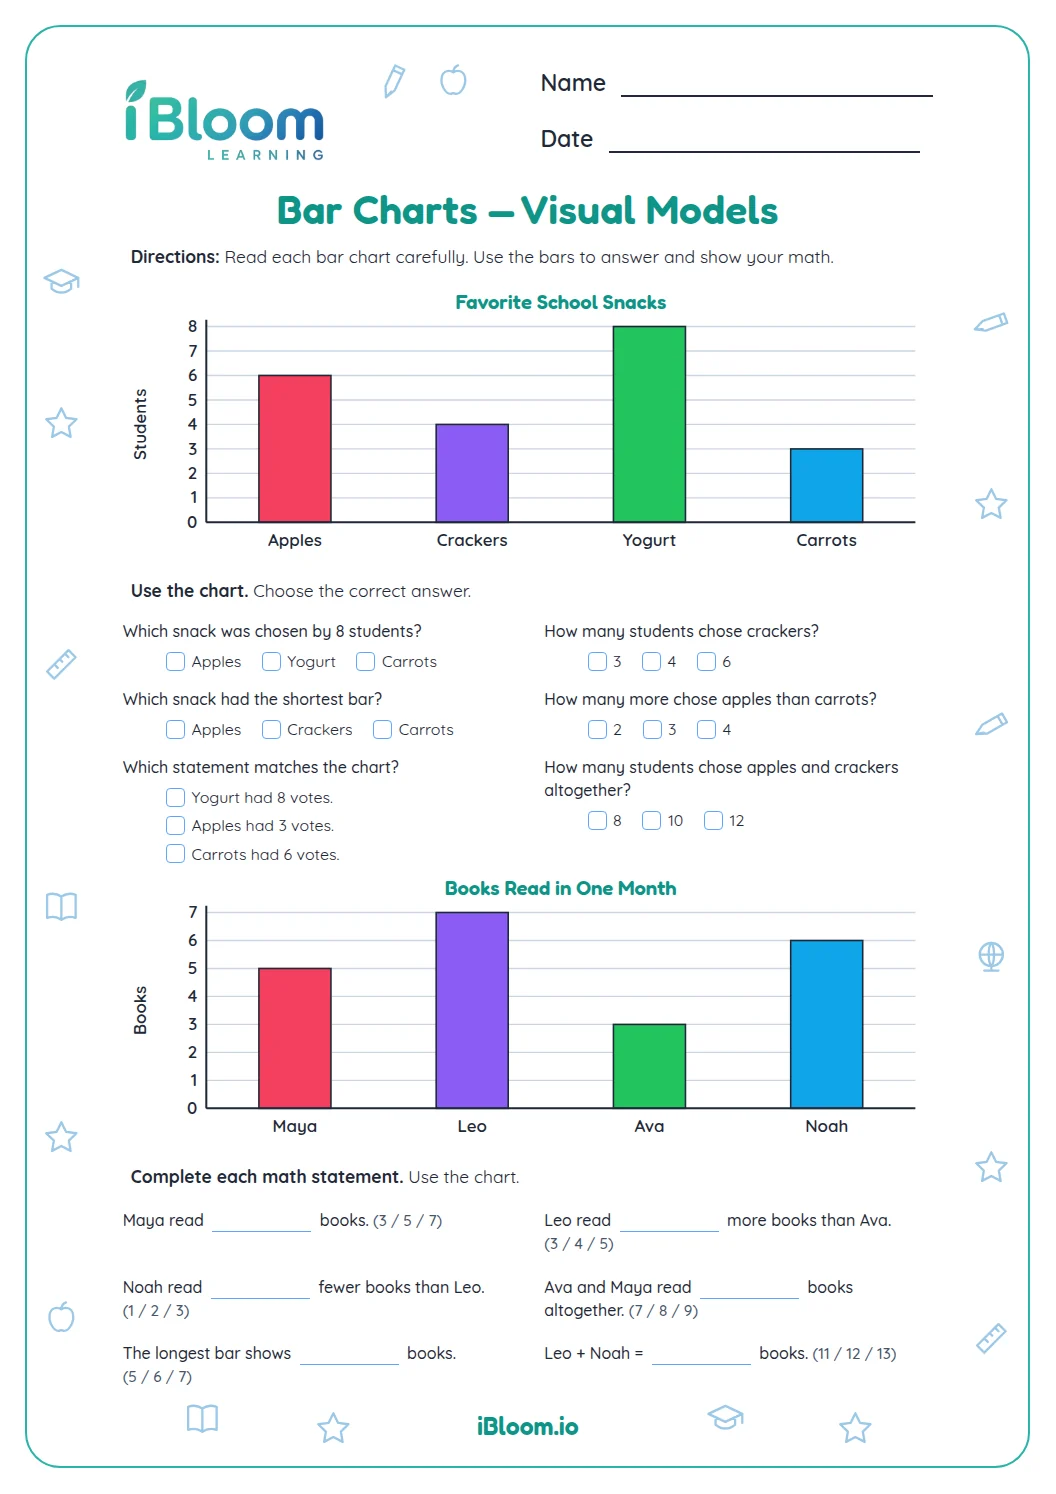
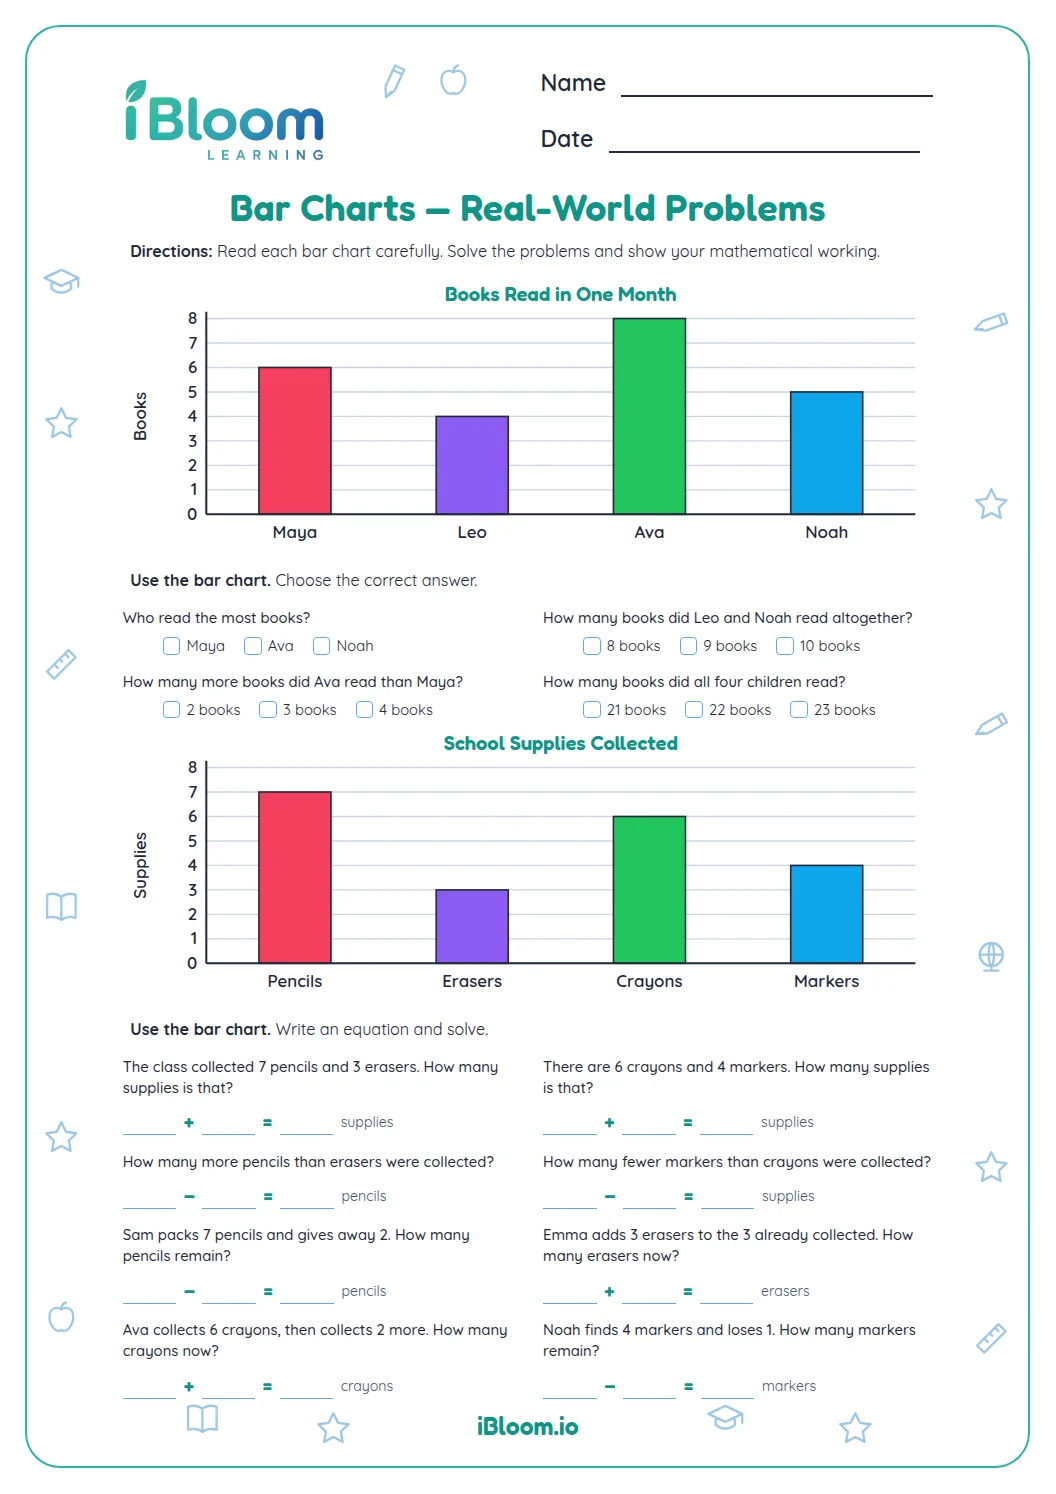
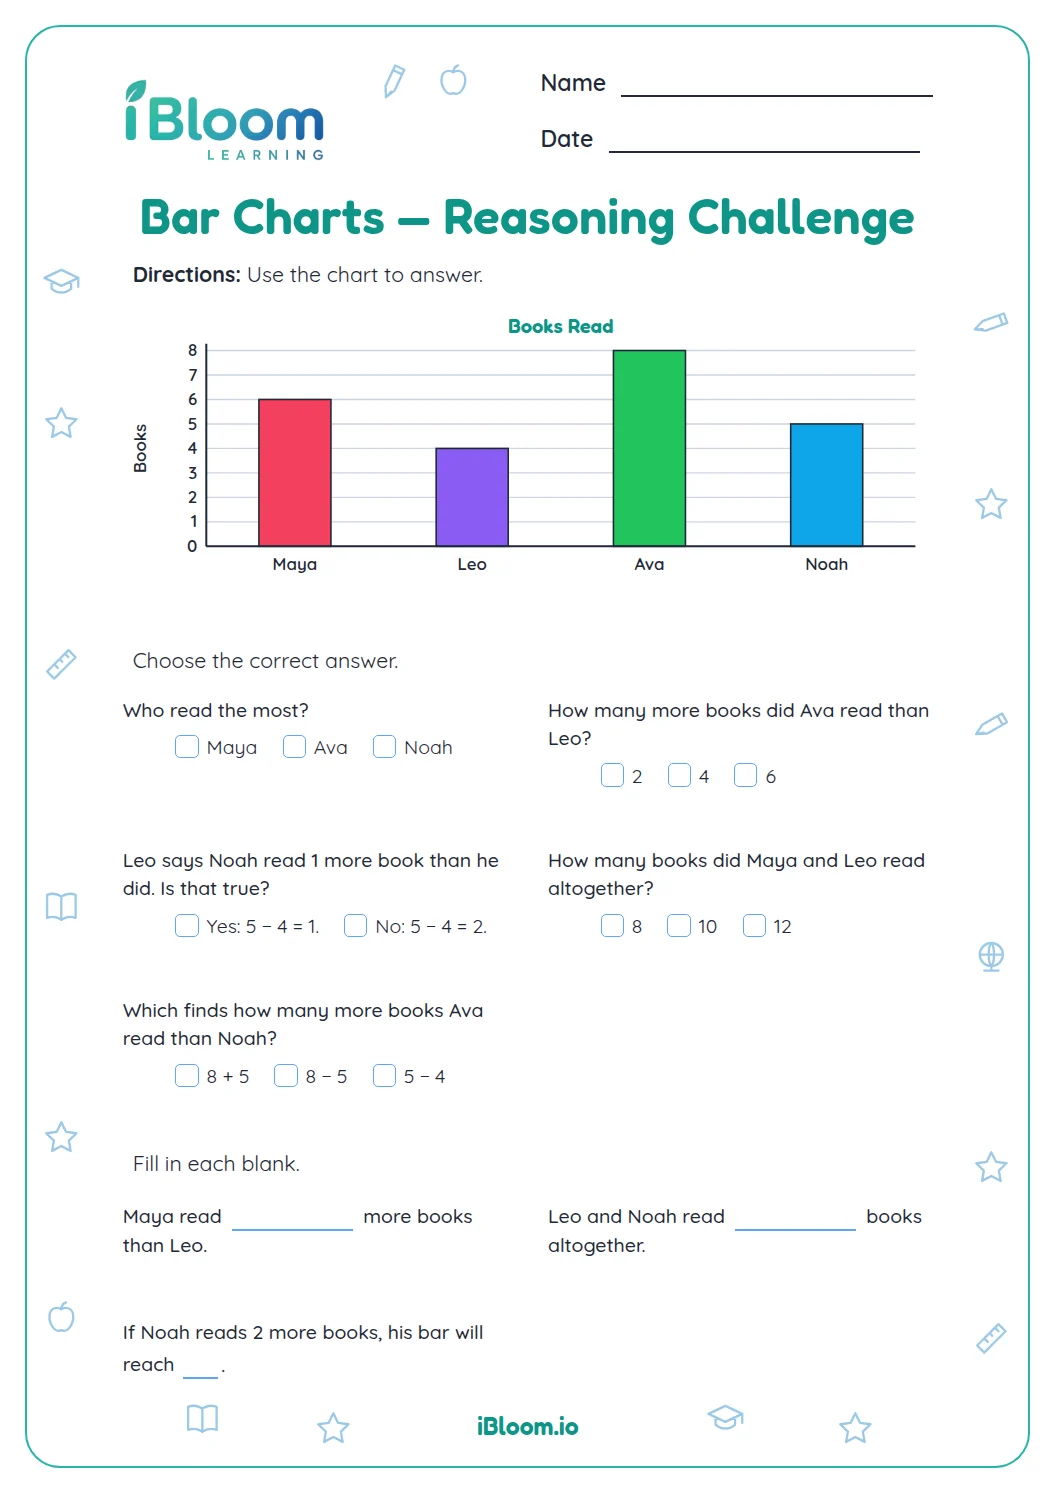
This Grade 2 printable uses a bar graph of class votes for apples, bananas, grapes, and oranges. Children identify the most and fewest votes and the total, then answer 15 follow-up questions that combine or compare values read from the bars. The graph uses one-vote intervals. A separate answer key shows the expected responses, and the practice connects to CCSS 2.MD.D.10.
Aligned to 2.MD.D.10
How do you read a bar in this graph?
Read the height of each bar using the one-vote scale. Grapes has 8 votes, the most; oranges has 2, the fewest. Adding 6 + 4 + 8 + 2 gives 20 votes altogether.
- 1Apples 6 + bananas 4 + grapes 8 + oranges 2
- 2Total: 20 votes
How can children find a total or a difference?
The follow-up questions reuse the four bar values. Some combine categories, while others ask how many more or fewer votes one category received.
- 1Grapes 8 − oranges 2
- 26 more votes for grapes
What do the two graphs help children practice?
The answer key shows the expected total or difference for each item. Children can check the graph first, then use the named values to work accurately.
How to use this worksheet
- 1Find the category named in the question.
- 2Read its bar height on the single-unit scale.
- 3For a total, add the values from the named categories.
- 4For “how many more” or “how many fewer,” subtract the smaller value.
- 5Check each result against the answer key.
Common mistakes and quick fixes
The mistake
Reading the gridline beside a bar instead of its top.
The fix
Follow the bar to its endpoint, then read across to the scale.
The mistake
Adding when the question asks how many more.
The fix
Compare the two values and subtract the smaller from the larger.
The mistake
Leaving out a category in a total.
The fix
Underline each category named in the question before adding.
Common Core alignment
This worksheet practices the letter and number skills named in the standard below.
Read a single-unit bar graph and solve compare and total questions.
On this sheet: Children read two four-category bar graphs and answer total, difference, and comparison questions.
Show the official wordingHide the official wording
Draw a picture graph and a bar graph (with single-unit scale) to represent a data set with up to four categories. Solve simple put-together, take-apart, and compare problems 1 using information presented in a bar graph.
What to practice next
Make more practice
Further reading
Questions parents and teachers ask
What is the scale on the bar graphs?
The graph uses four categories and a single-unit scale. Apples have 6 votes, bananas 4, grapes 8, and oranges 2. Children read the bar heights in question 1, then use these counts in the follow-up total and comparison problems. Reading the full prompt once more is a useful way to check before moving on.
How many categories are in each graph?
The graph has four fruit categories: apples, bananas, grapes, and oranges. Their bars show 6, 4, 8, and 2 votes. The worksheet uses these counts for adding, comparing, and finding the difference between categories. Reading the full prompt once more is a useful way to check the answer before moving on.
How do children solve “how many more” questions?
Read both category values and subtract the smaller from the larger. For grapes and oranges, the values are 8 and 2, so 8 − 2 = 6. The answer describes how many more votes grapes received. Reading the full prompt once more is a useful way to check the answer before moving on.
Why are there two graphs with the same data?
One graph keeps the model simple and gives children a consistent set of values to interpret. The questions then vary: some ask for a total, while others ask which category has more or how many votes separate two bars. Reading the full prompt once more is a useful way to check the answer before moving on.
Is the answer key included?
Yes. The answer key is a separate page with the fruit named in the graph question and the result for each of the 15 vote-count number sentences. Children can check their number work after reading the bars. Read the full clue once more to confirm which object or point is the reference.