

About this worksheet
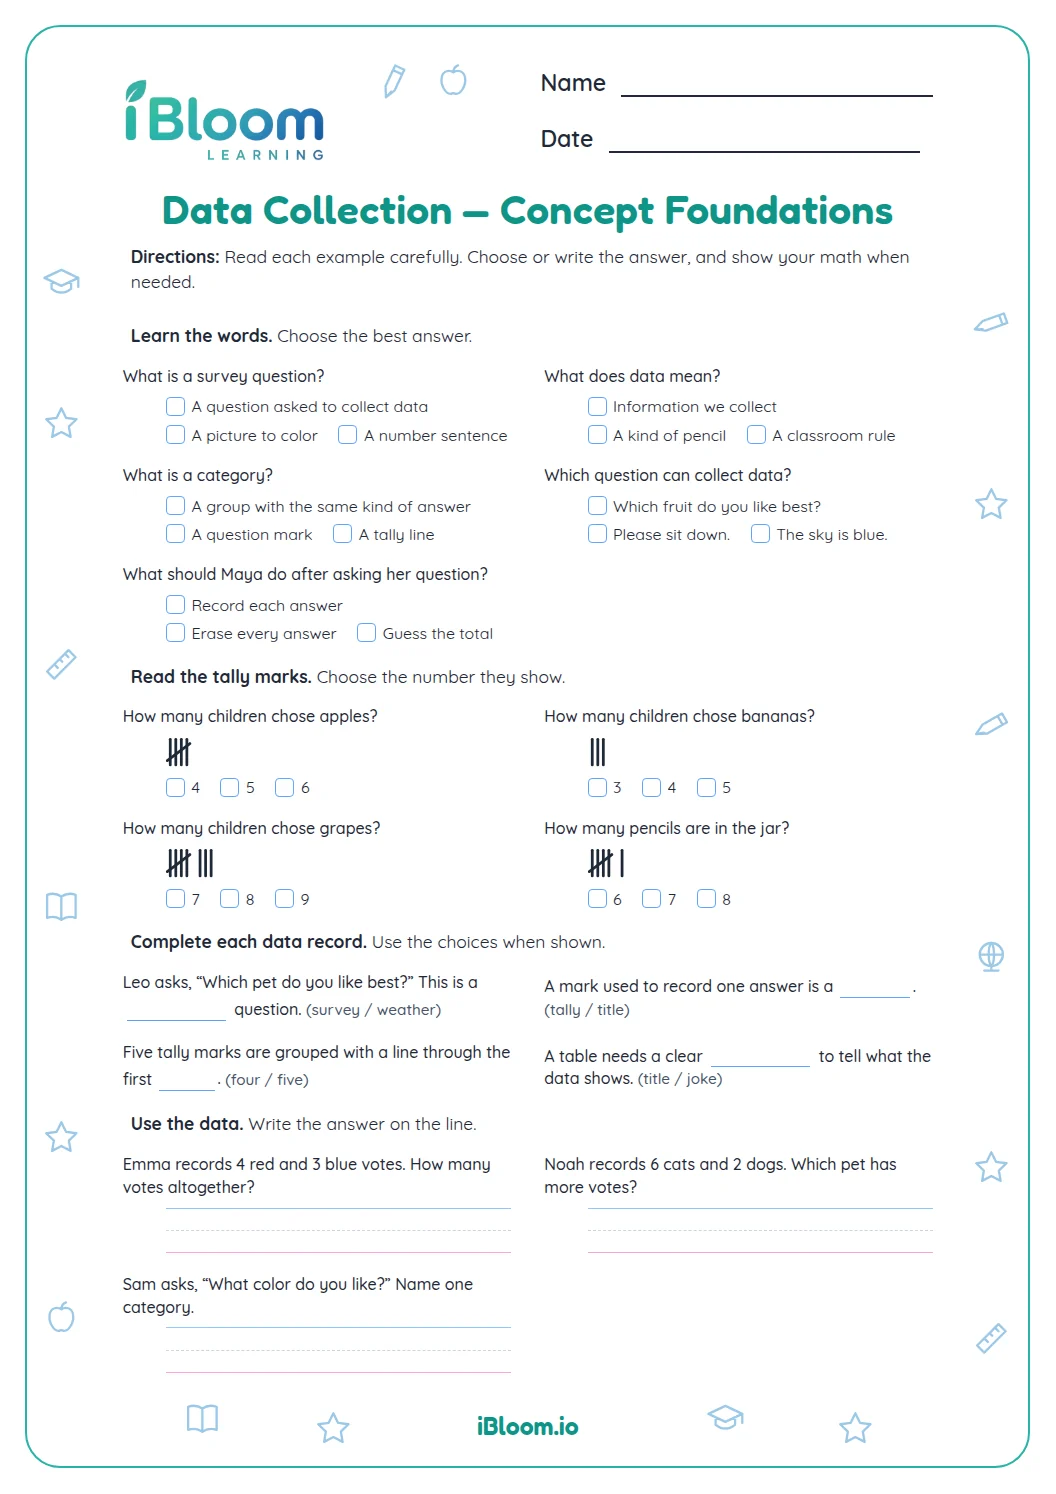
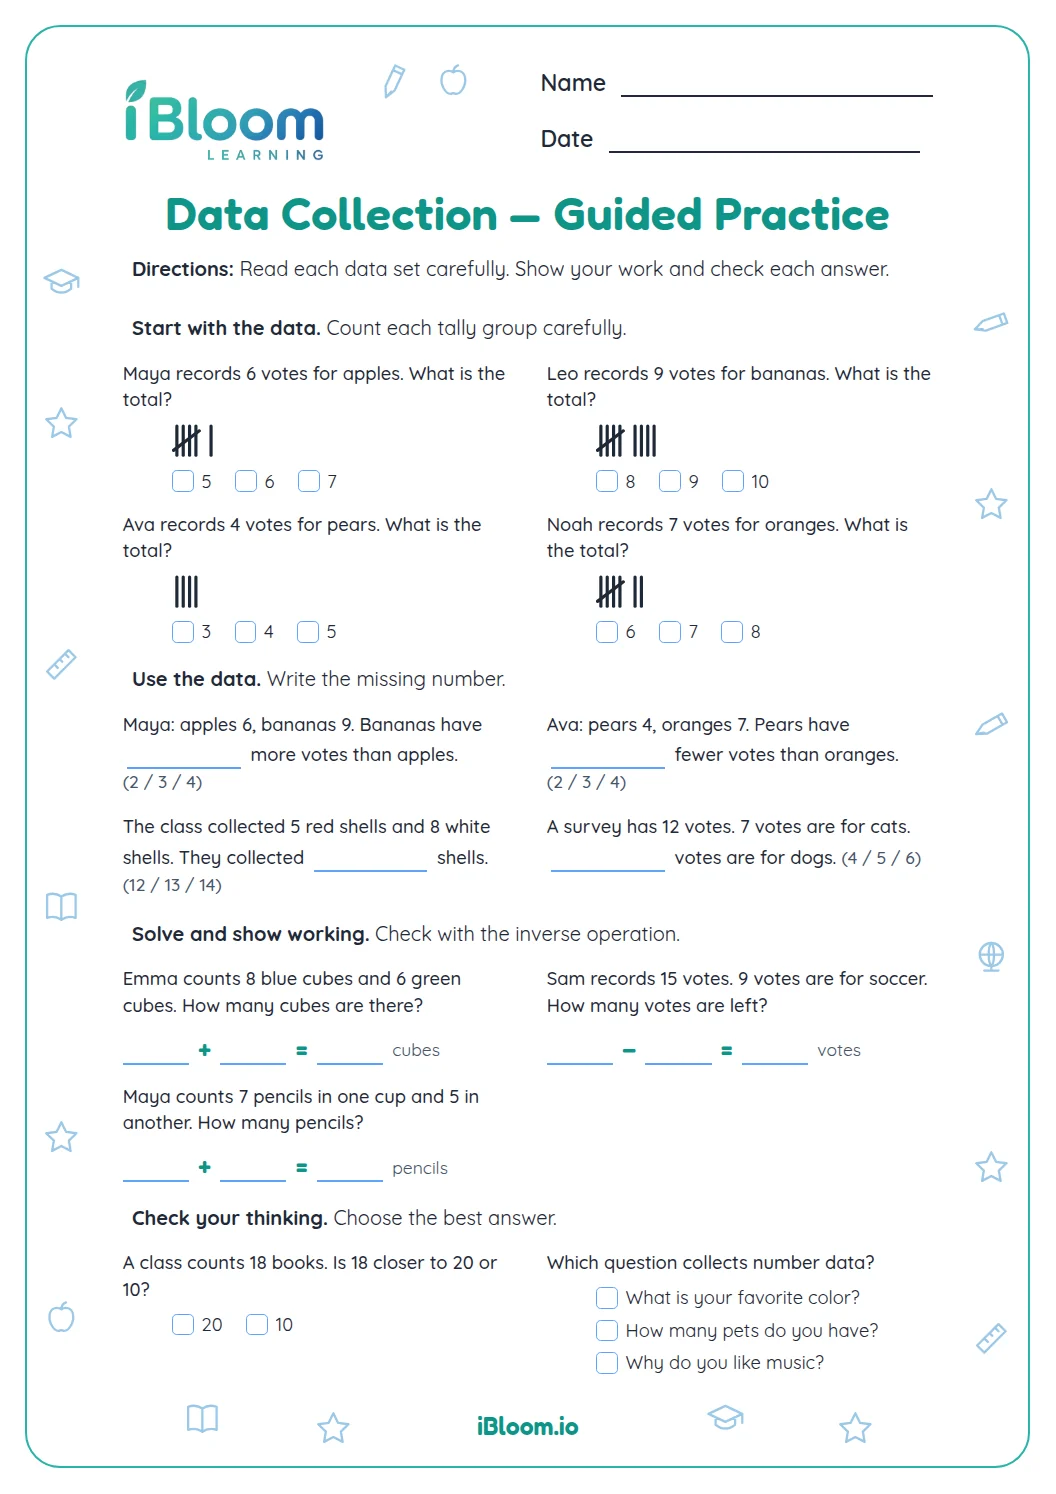
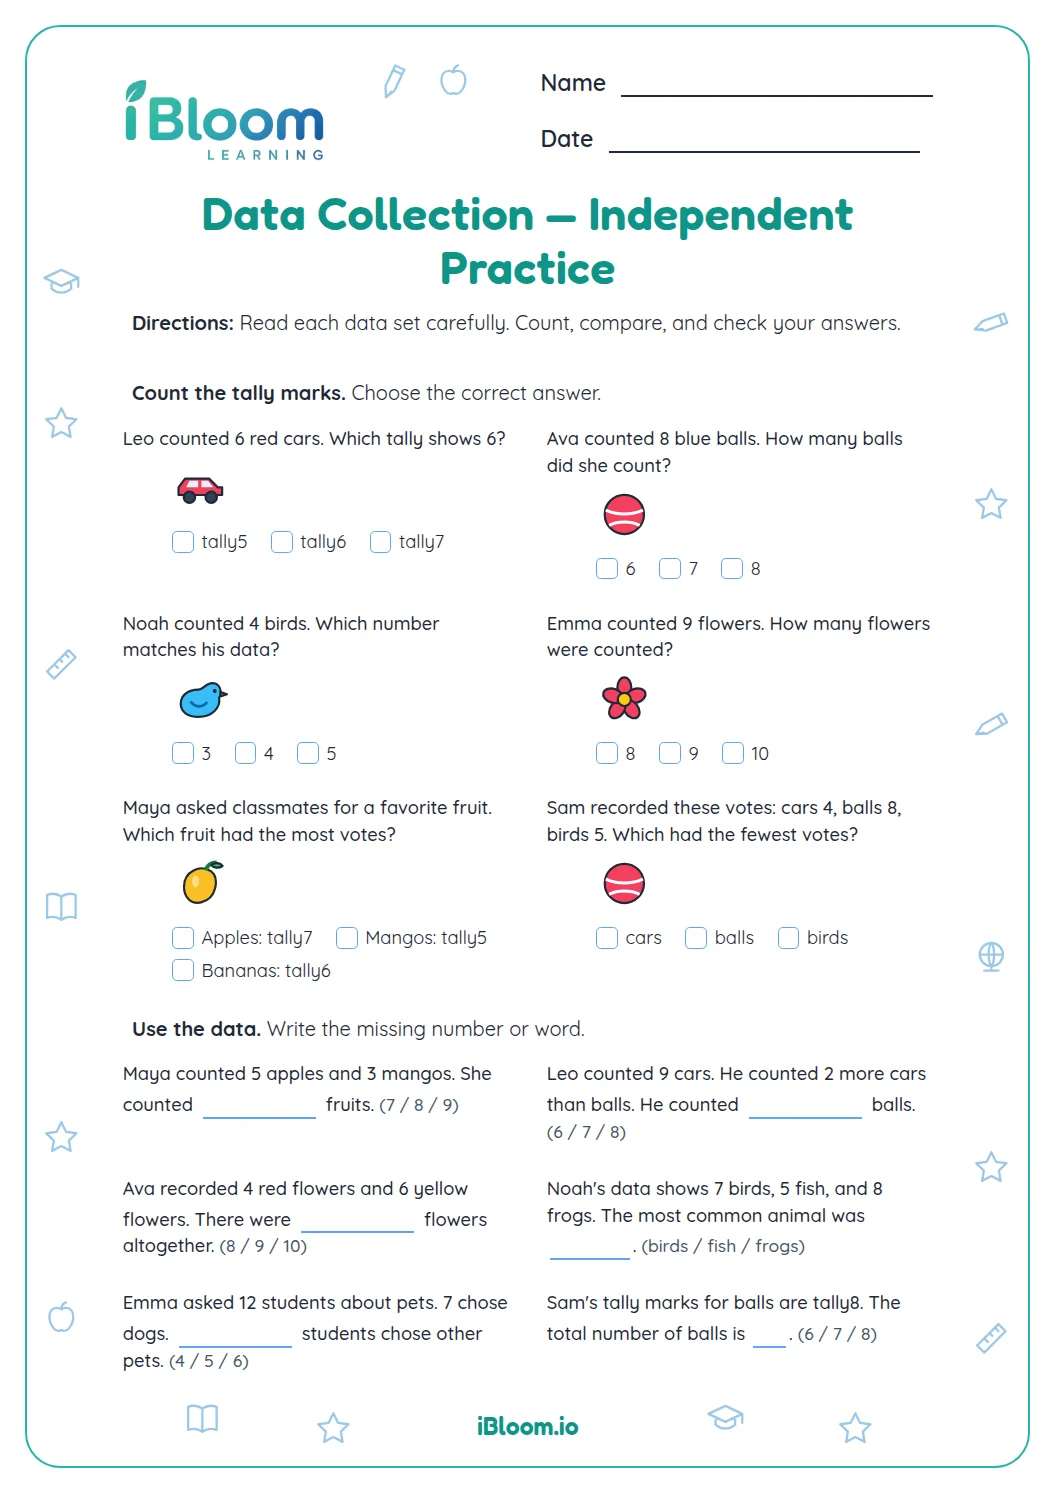
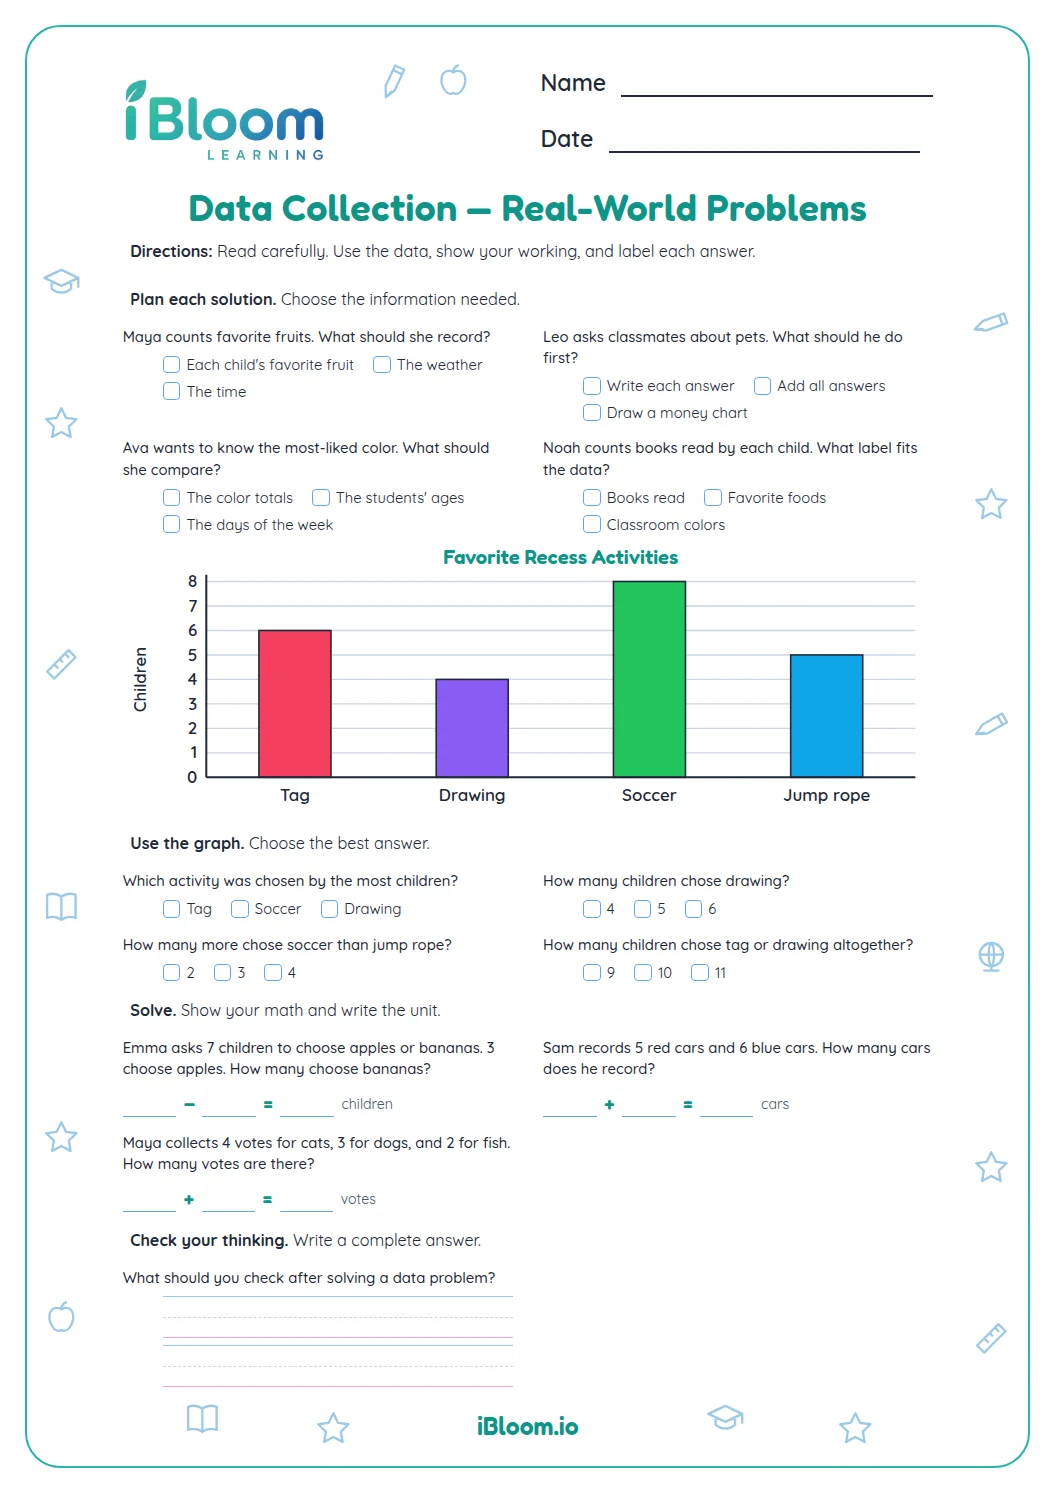
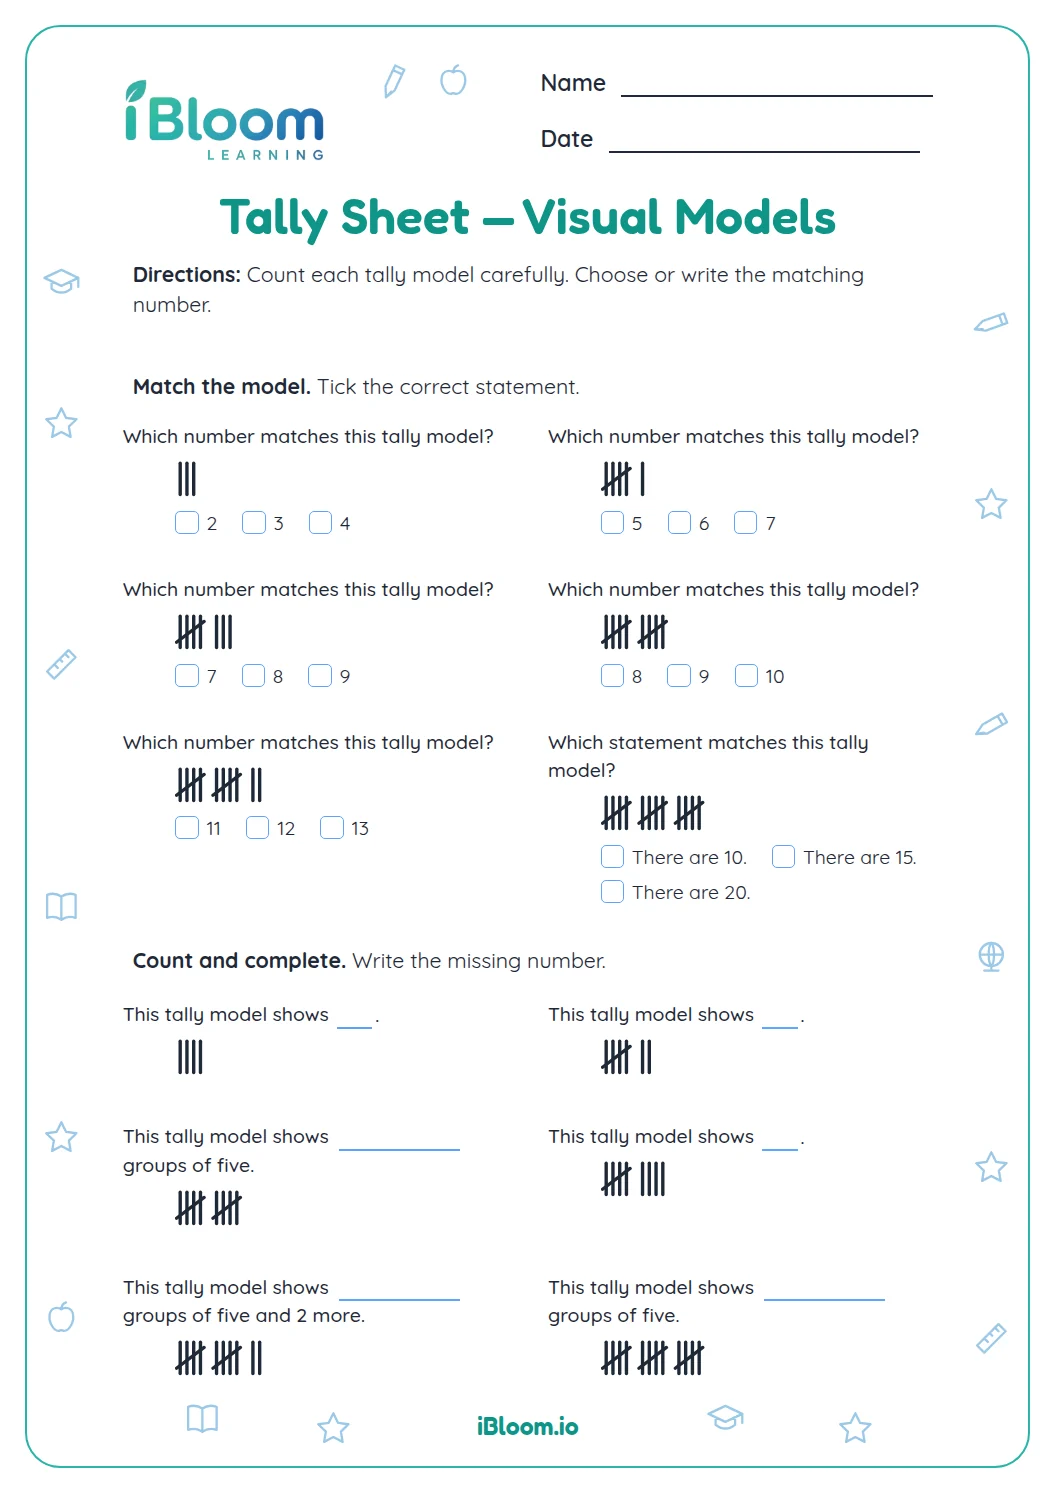
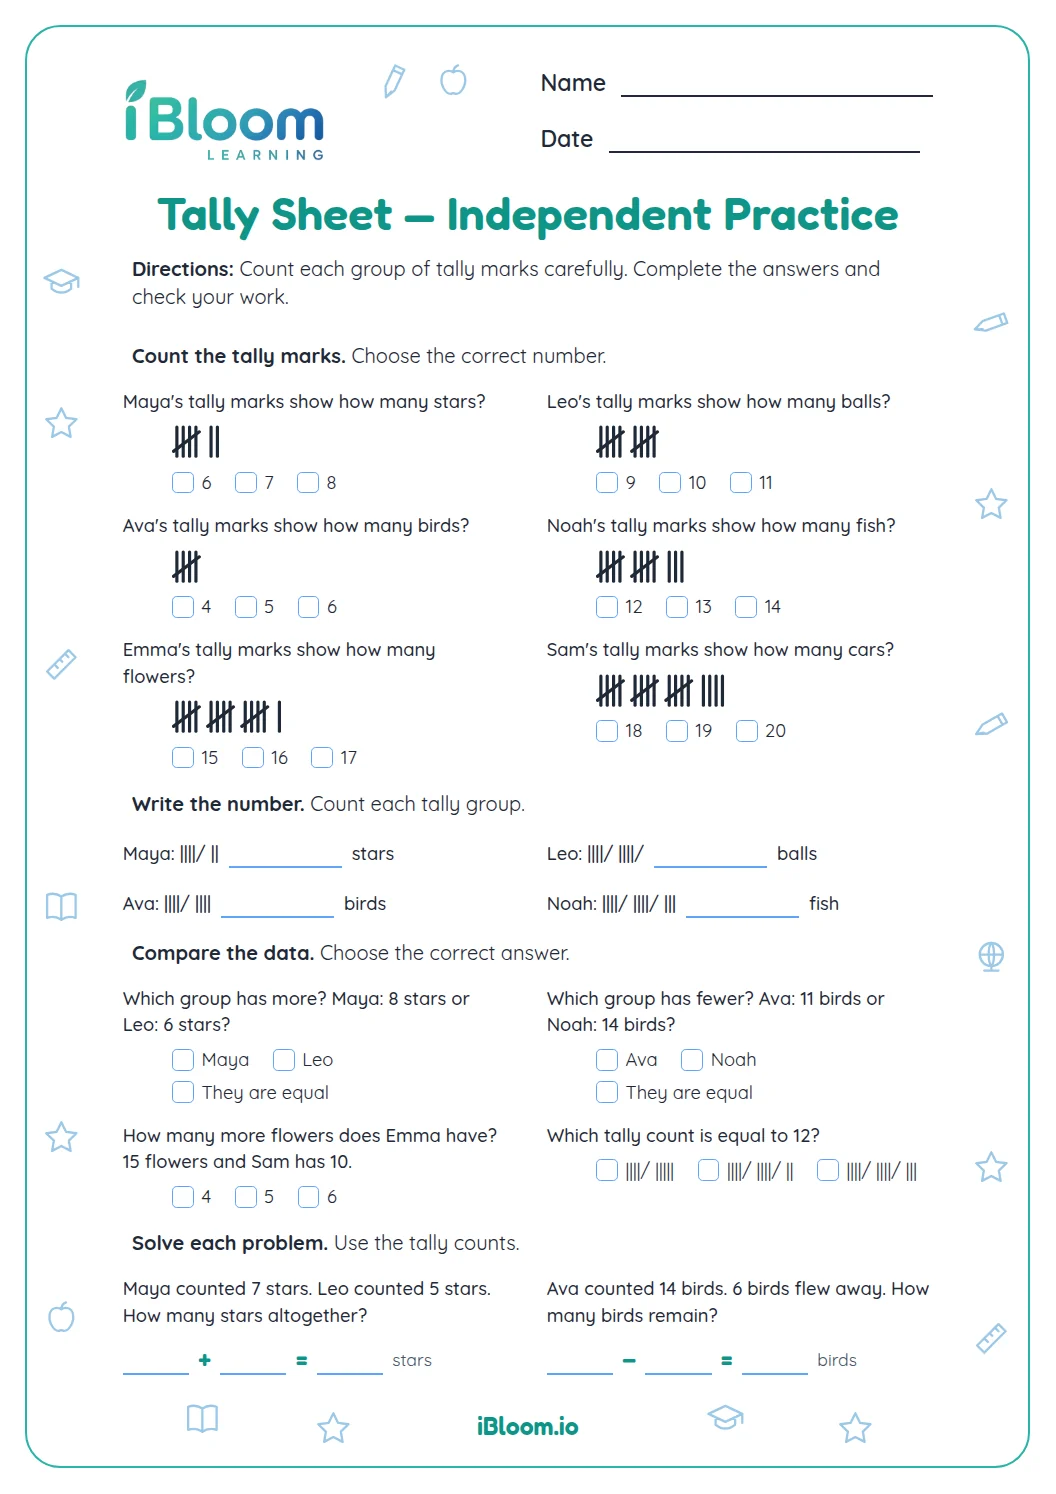
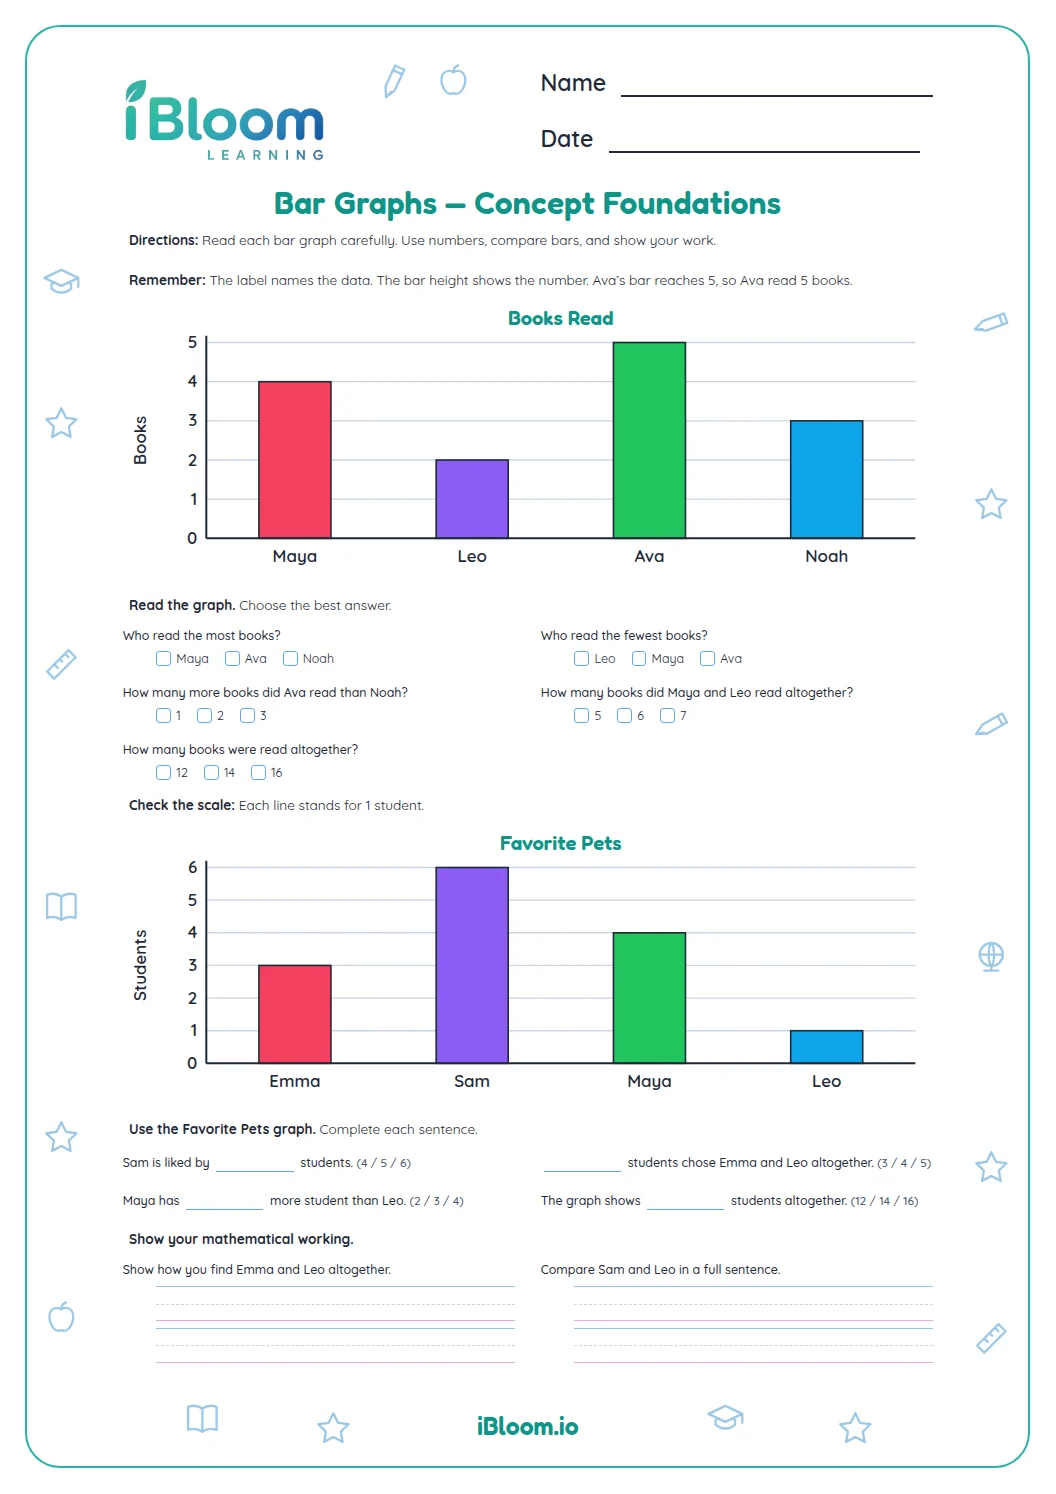
This printable Grade 2 worksheet practices reading data in two visual forms. Children count 12 tally models, then answer two questions by reading a single-unit bar graph about favorite fruits: a comparison and the total number of votes. It practices CCSS 2.MD.D.10. The answer key is provided on its own page.
Aligned to 2.MD.D.10
How do tally marks record a count?
Each upright mark records one response. A diagonal slash across four upright marks completes a bundle of five, making the count easier to check. Part A asks children to read 12 tally models.
How can a bar graph answer questions?
Read the category label, then follow its bar to the numbered axis. In this worksheet, the grapes bar reaches 8 and the oranges bar reaches 5, so grapes received 3 more votes.
- 1Grapes: 8 votes; oranges: 5 votes
- 28 − 5 = 3
- 3Grapes received 3 more votes.
What is on the worksheet?
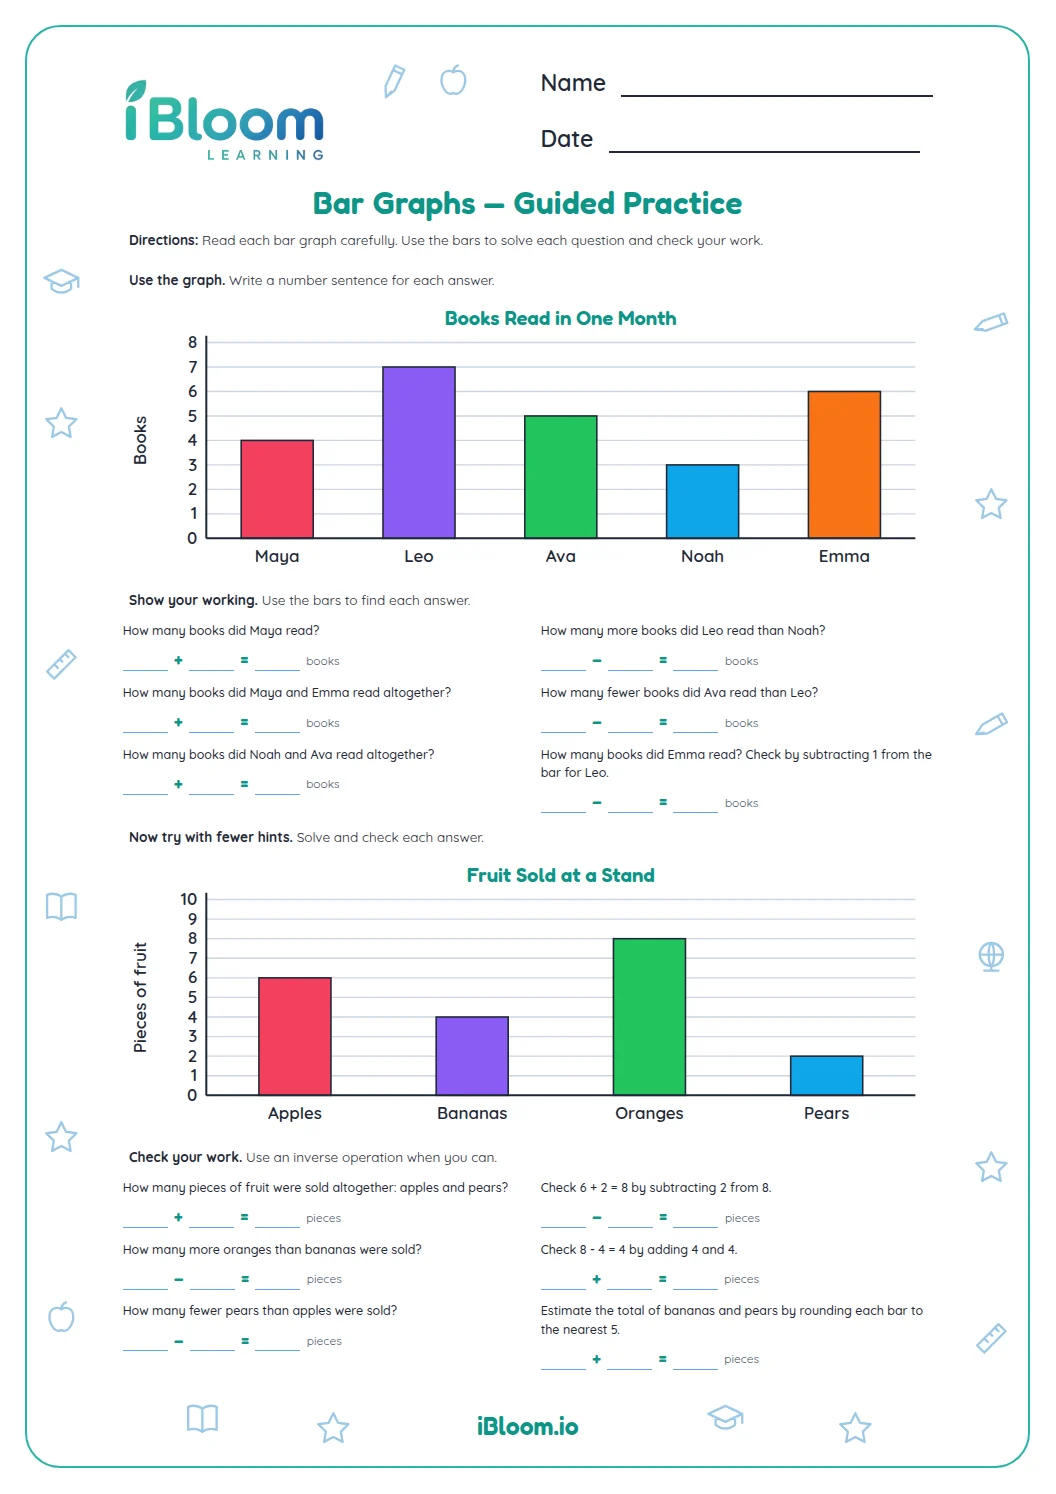
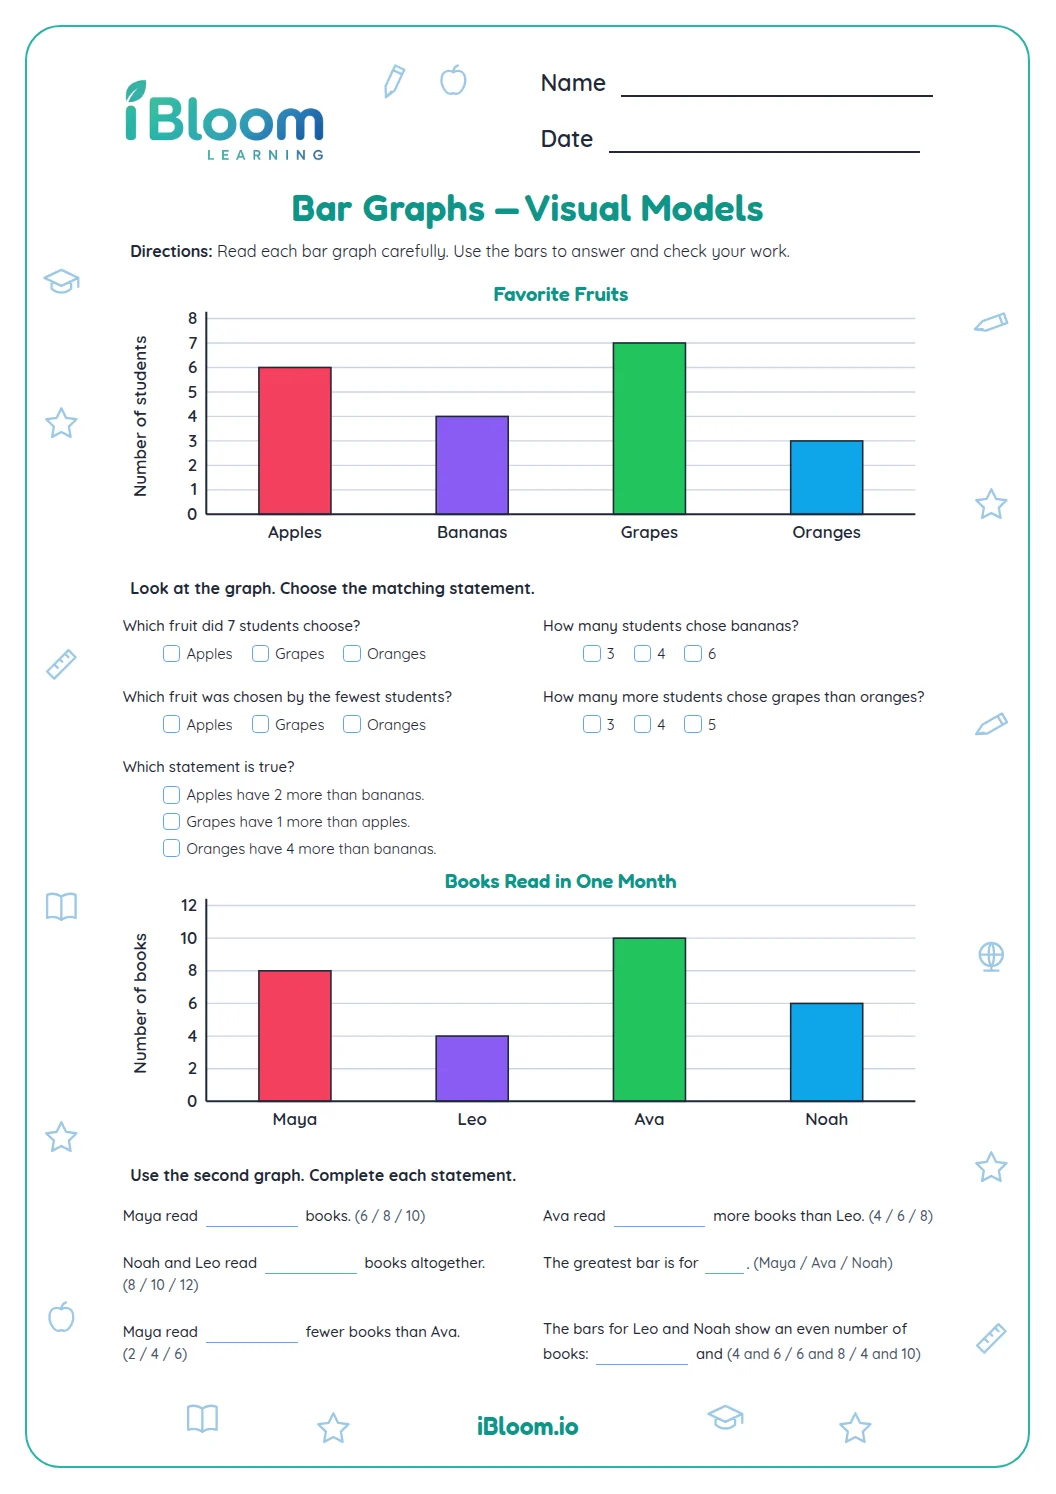
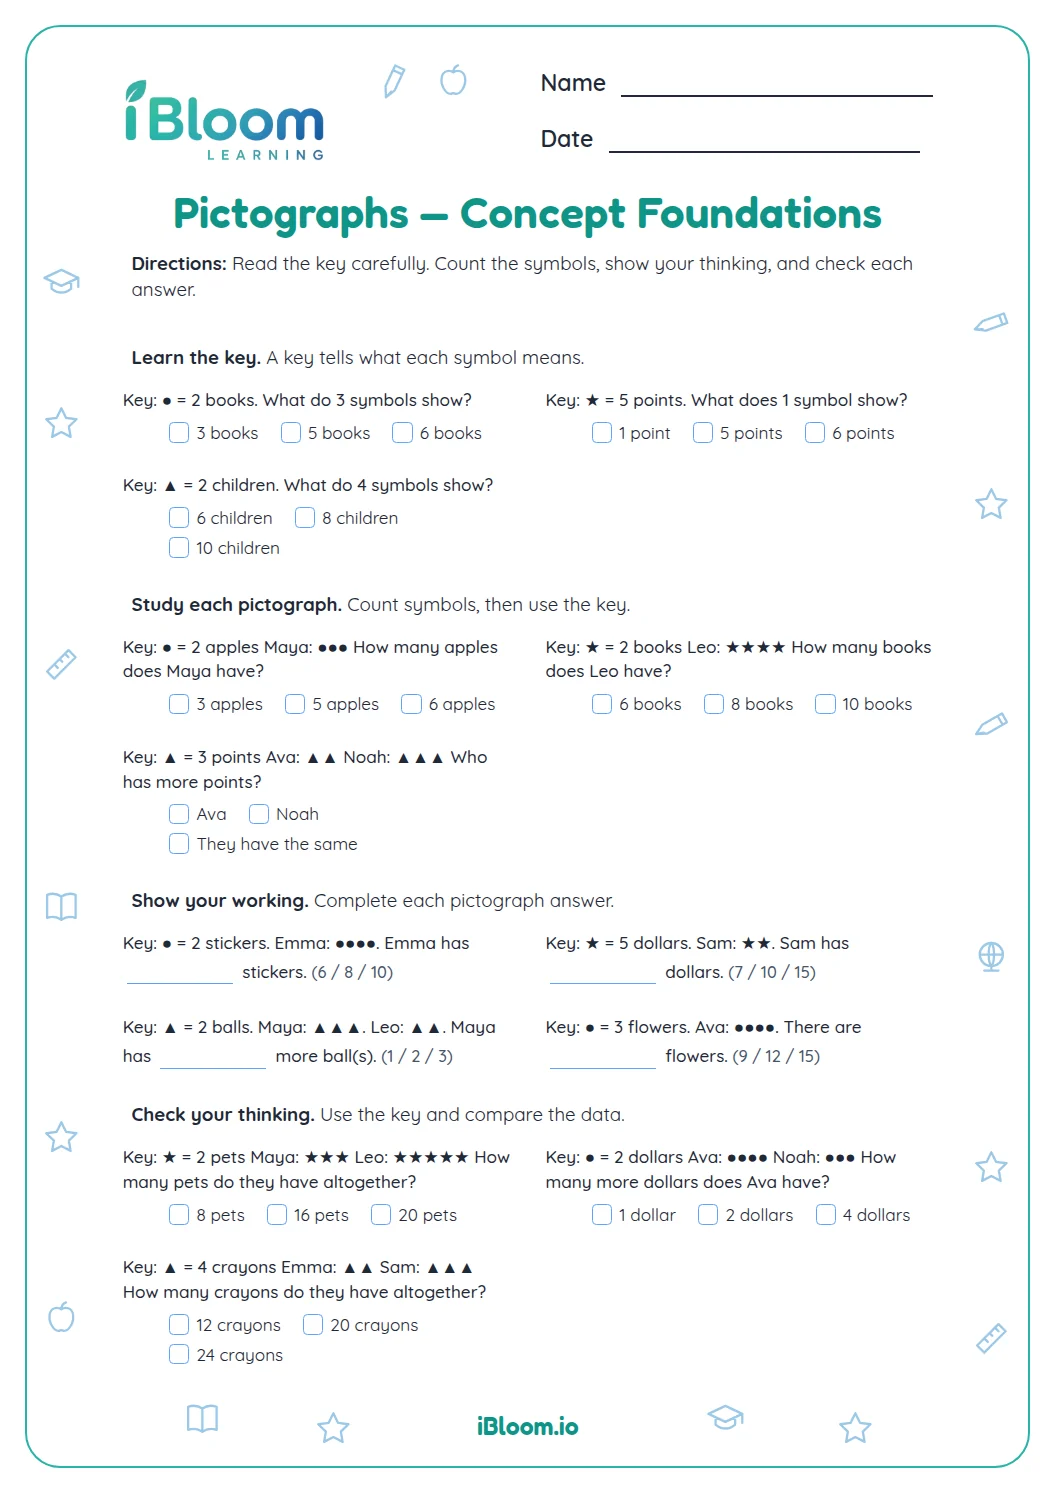
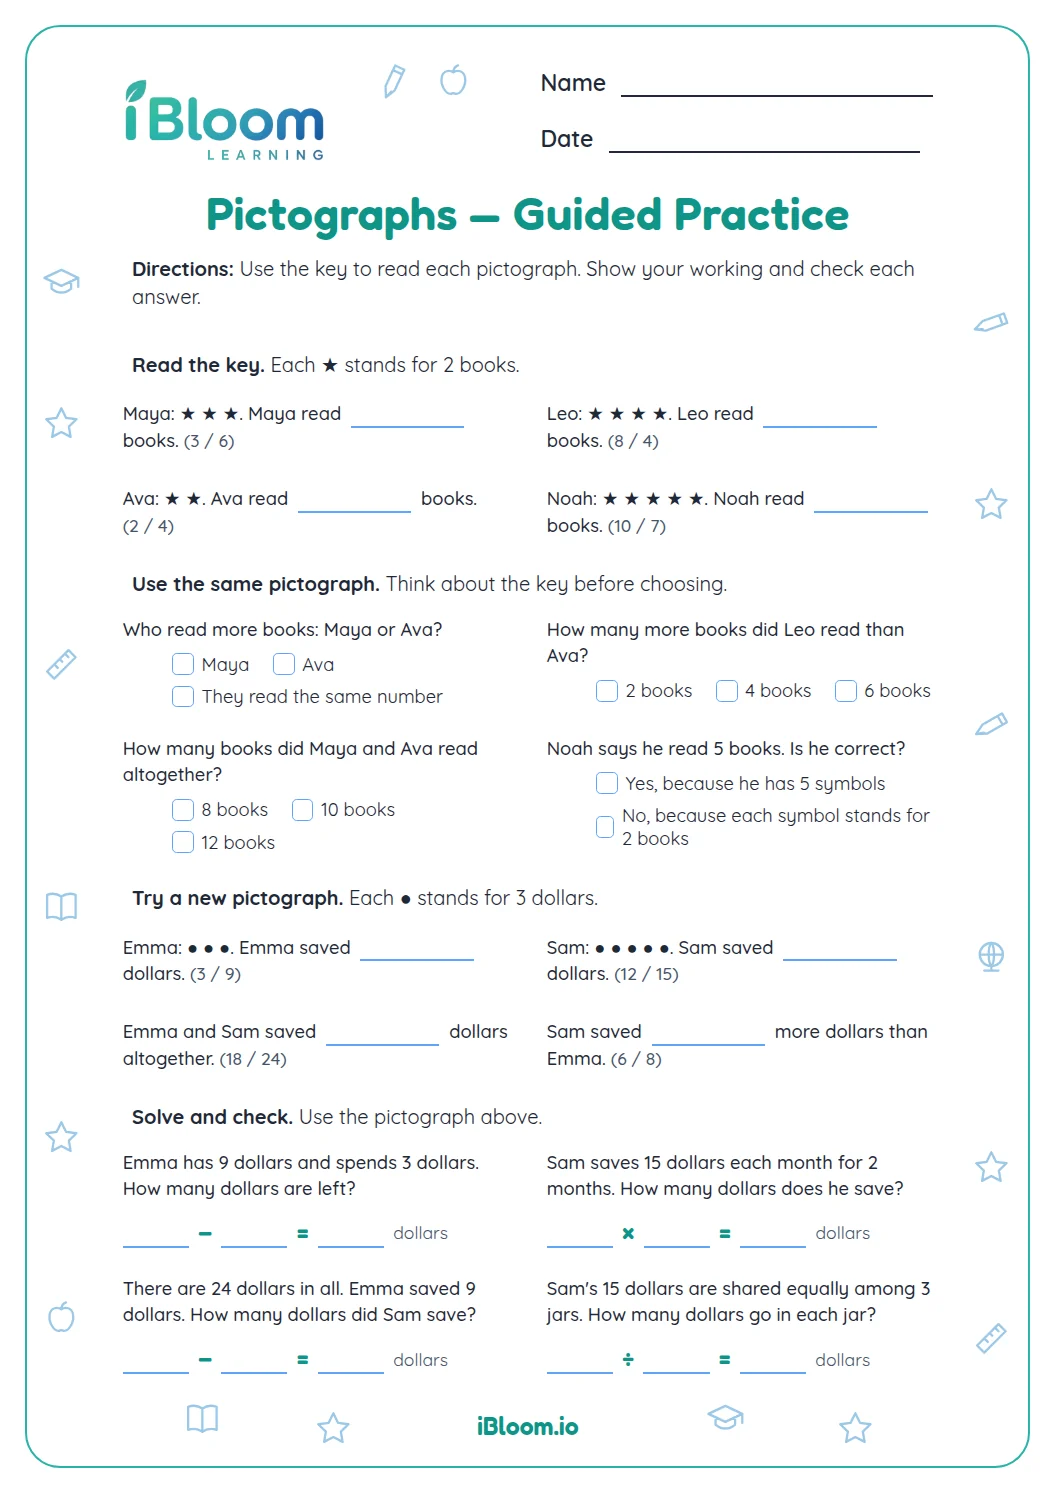
Part A has 12 tally counts. Part B uses one fruit bar graph for two questions: comparing two categories and finding the total votes. The answer key shows each count and calculation.
How to use this worksheet
- 1Count each group of tally marks, bundling every five.
- 2Write the tally count requested in each Part A item.
- 3For Part B, find the named fruit along the graph axis.
- 4Trace its bar to the numbered scale to read the count.
- 5For comparison and total questions, calculate with the graph values.
Common mistakes and quick fixes
The mistake
Counting a diagonal tally as an extra sixth mark.
The fix
The diagonal crosses four upright marks, making a group of five.
The mistake
Reading the graph from the wrong bar.
The fix
Match the fruit label first, then follow that bar to the axis.
The mistake
Adding only some fruit counts for the total.
The fix
Add all four bar values: 6 + 4 + 8 + 5 = 23.
Common Core alignment
Children read and compare category counts on a four-category bar graph.
Read four-category data in a single-unit bar graph and compare counts.
On this sheet: Part B reads a four-category single-unit bar graph, compares two counts, and finds the total.
Show the official wordingHide the official wording
Draw a picture graph and a bar graph (with single-unit scale) to represent a data set with up to four categories. Solve simple put-together, take-apart, and compare problems¹ using information presented in a bar graph.
What to practice next
Make more practice
Further reading
Questions parents and teachers ask
How many questions are on this worksheet?
There are 14 questions in all. Twelve ask children to count tally models, and two ask them to read a bar graph about favorite fruit, compare two categories, and find the total vote count. The graph has four fruit categories, and the tally models include groups of five.
What does the diagonal tally mark mean?
The diagonal mark completes a group of five tally marks. Count four upright marks and the diagonal crossing them together as five responses, then count any marks left over. For example, one bundle and three more marks represent eight responses.
What information is on the bar graph?
The graph shows votes for apples, bananas, grapes, and oranges. Children use the bars to compare grapes with oranges and to find how many votes were counted altogether. Each bar starts at zero, and the numbered axis makes the count visible.
How do children find the difference between two bars?
Read both values from the graph, then subtract the smaller count from the larger one. Grapes received 8 votes and oranges received 5, so grapes received 3 more votes. This compares the categories using the values shown by their bars.
Does the worksheet include an answer key?
Yes. A separate answer key gives the count for each tally model and the answers to both bar-graph questions, including the comparison and the total number of votes. It follows the same question order as the printable worksheet. The answer key follows the worksheet from start to finish.