
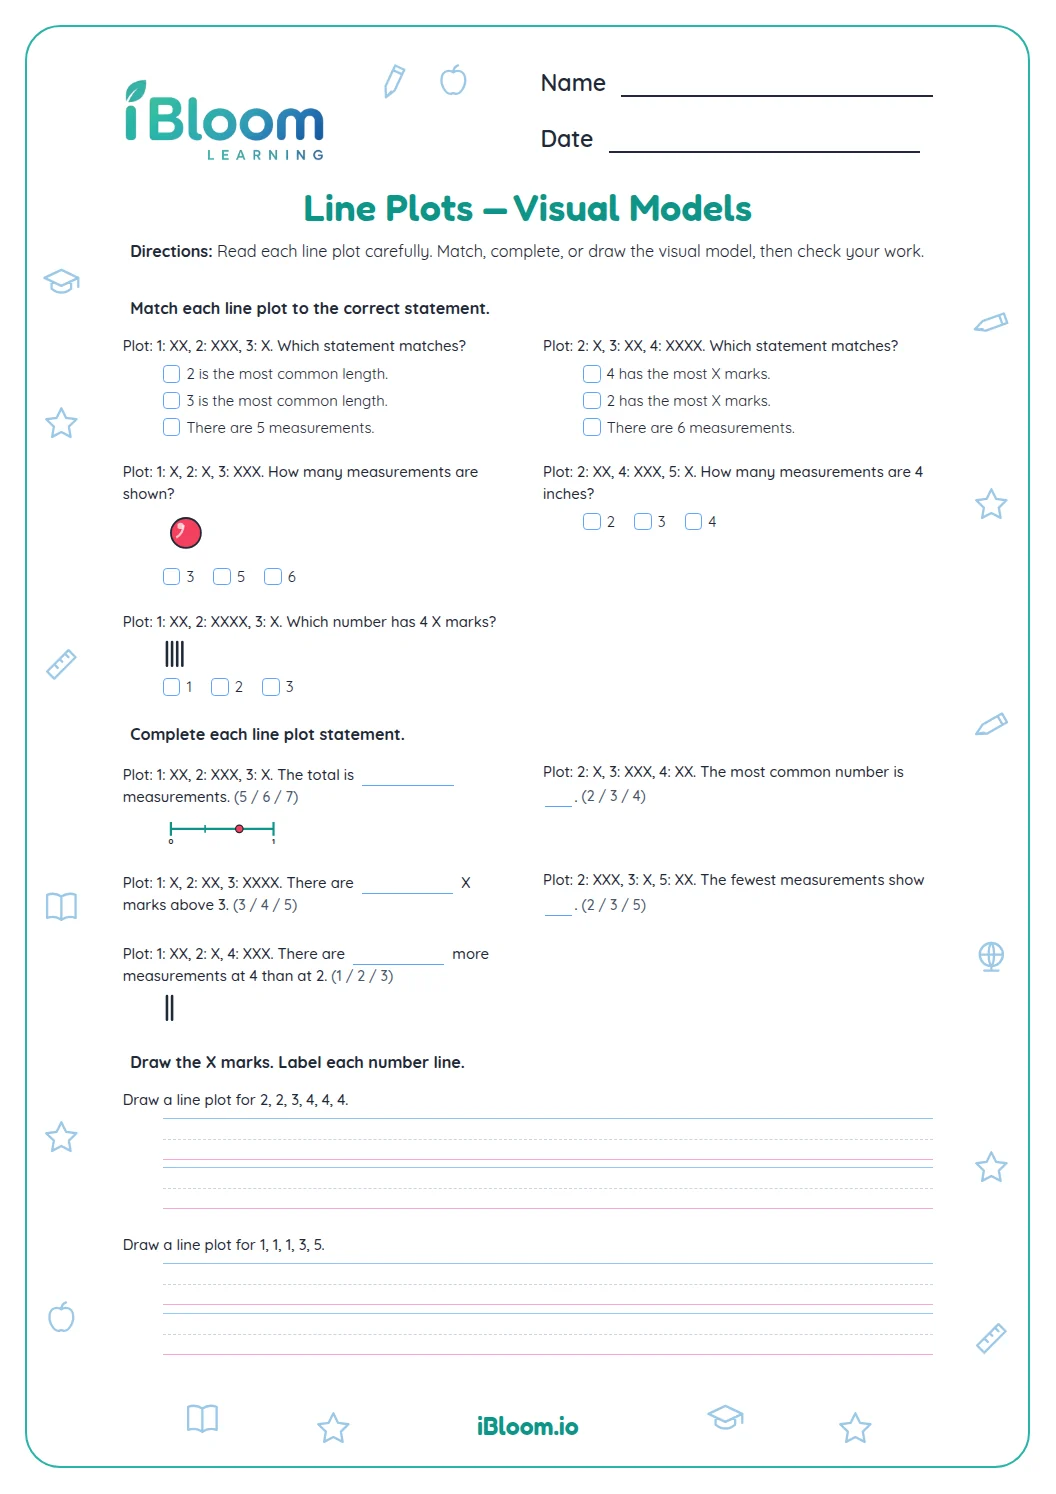
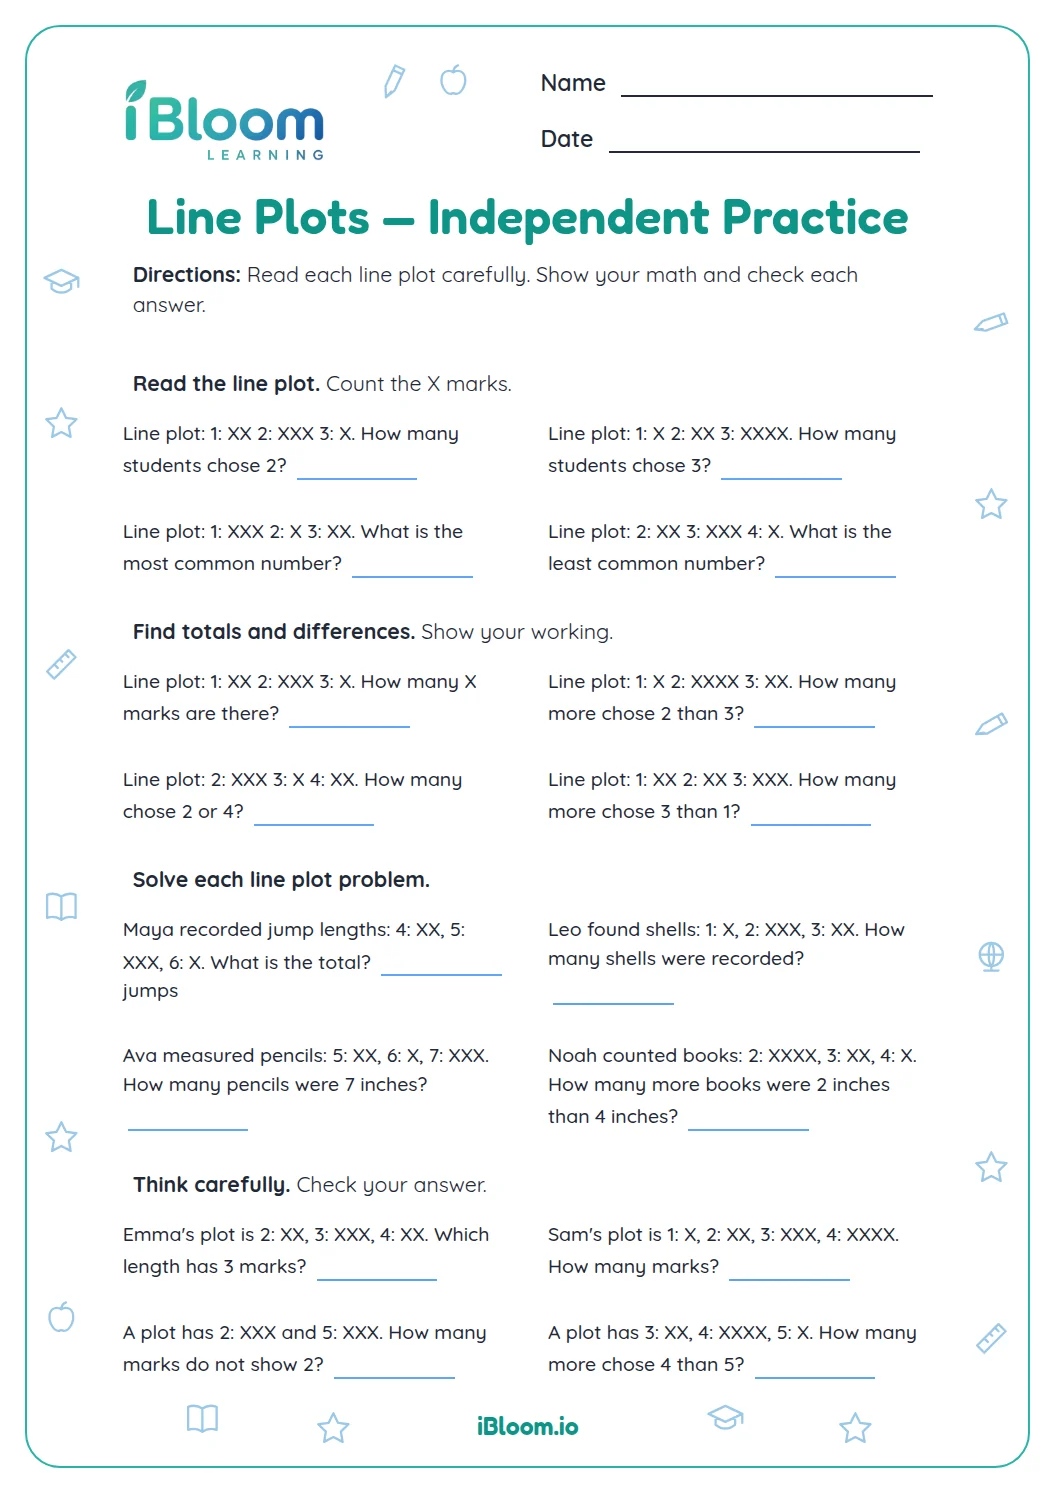
About this worksheet
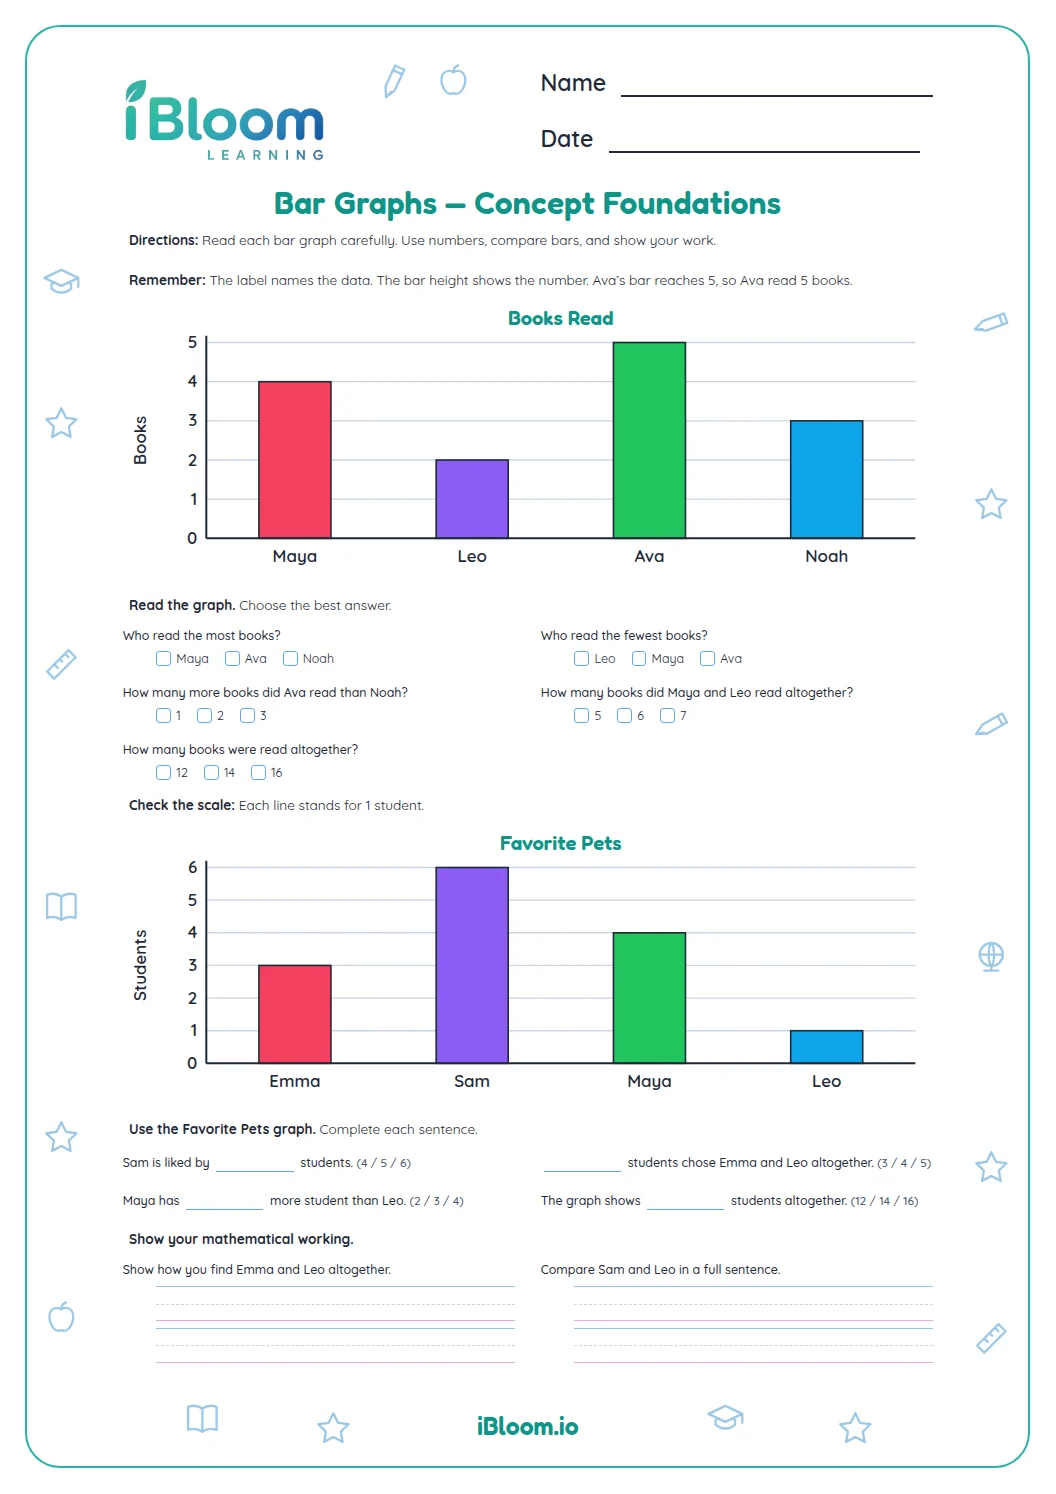
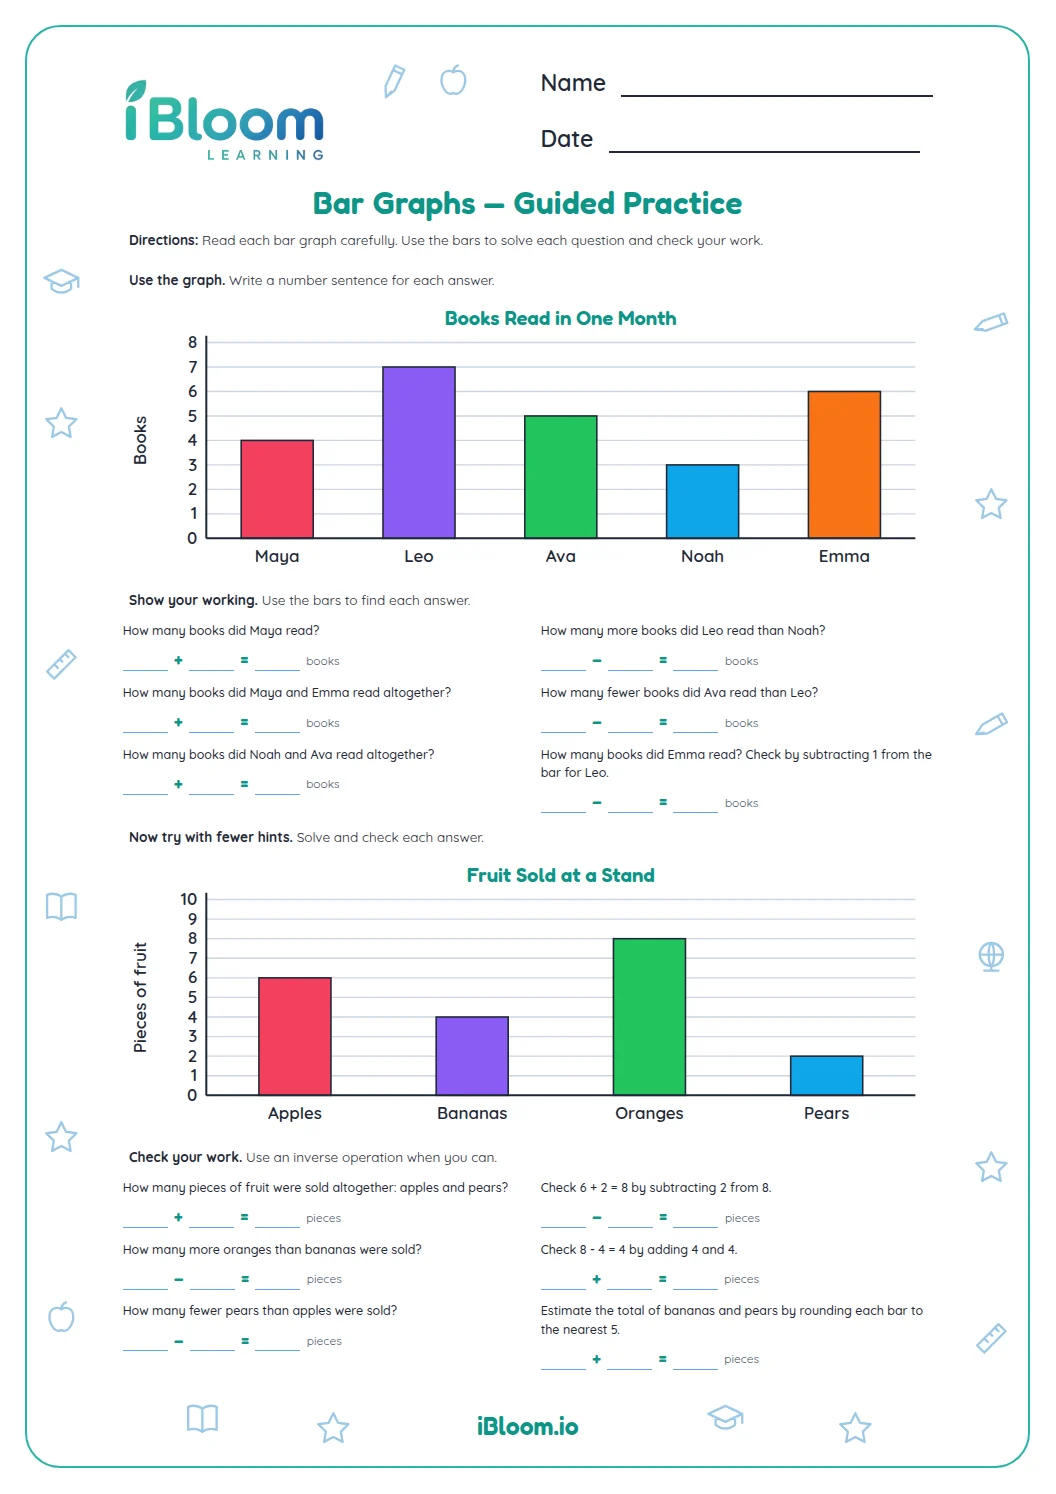
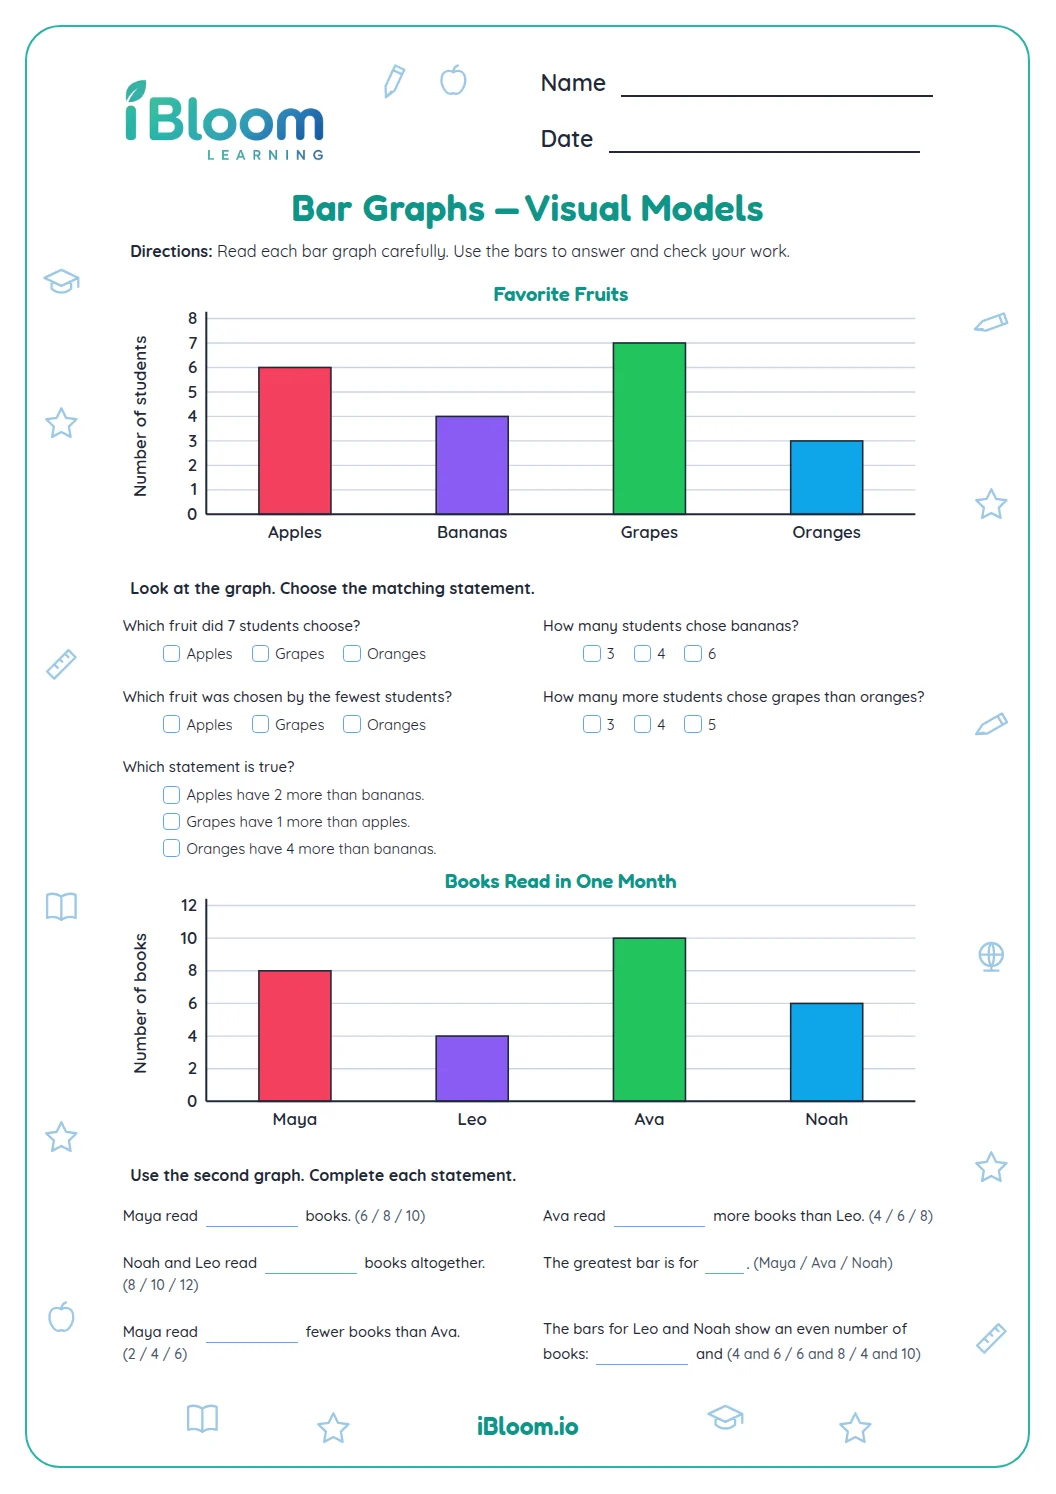
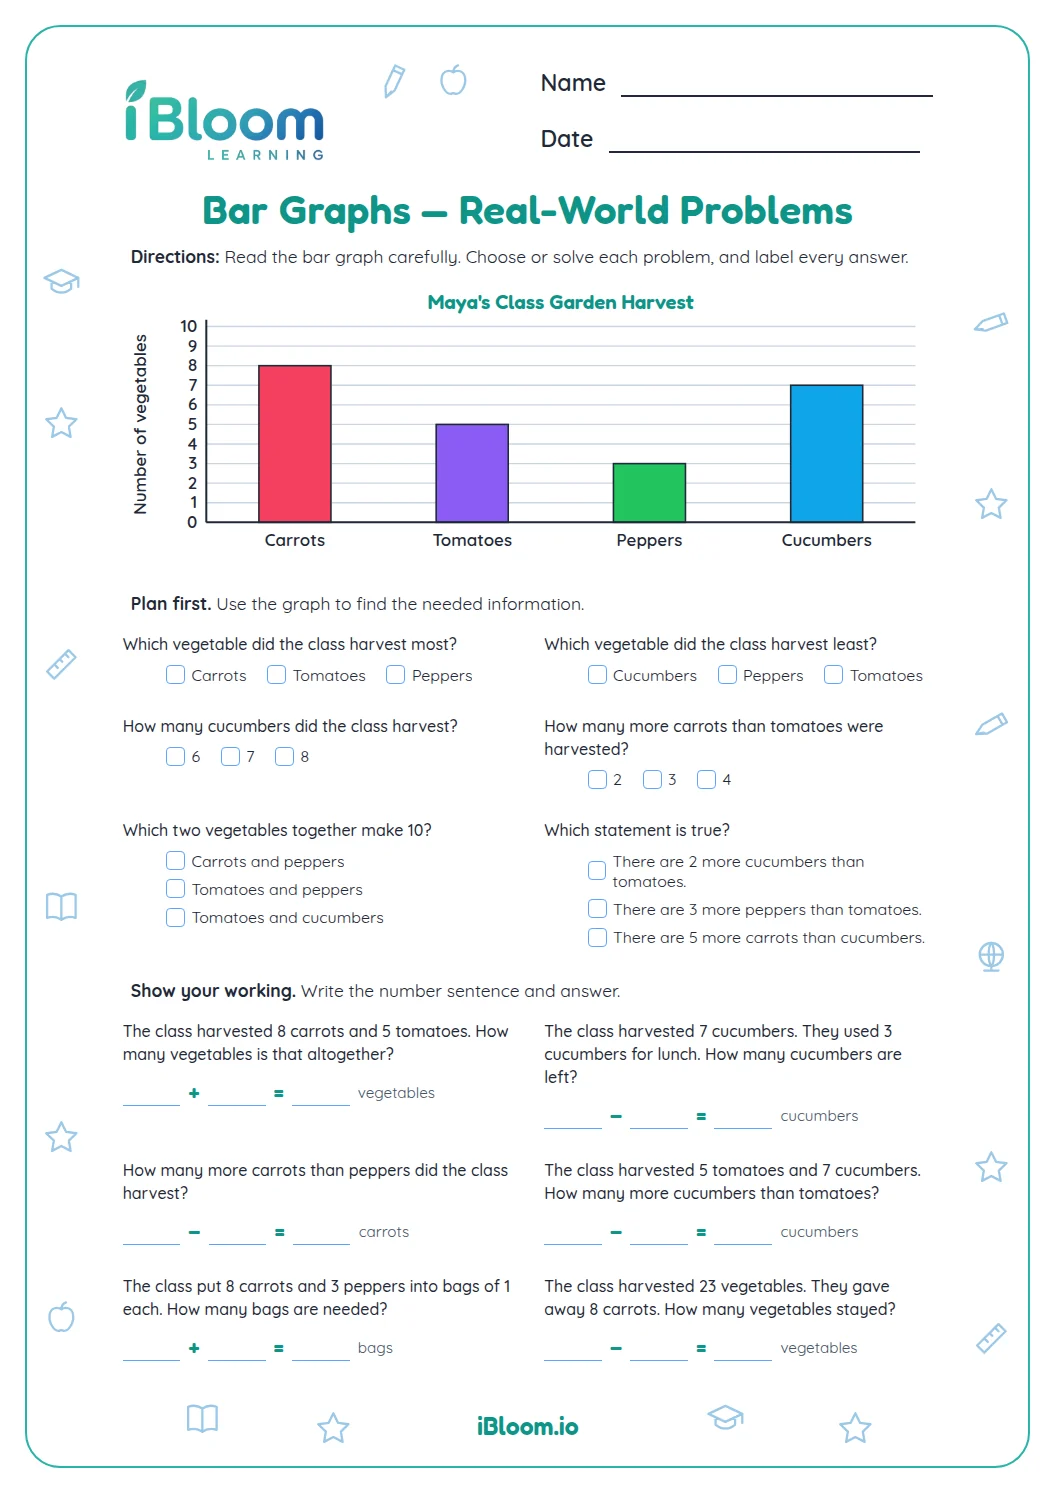
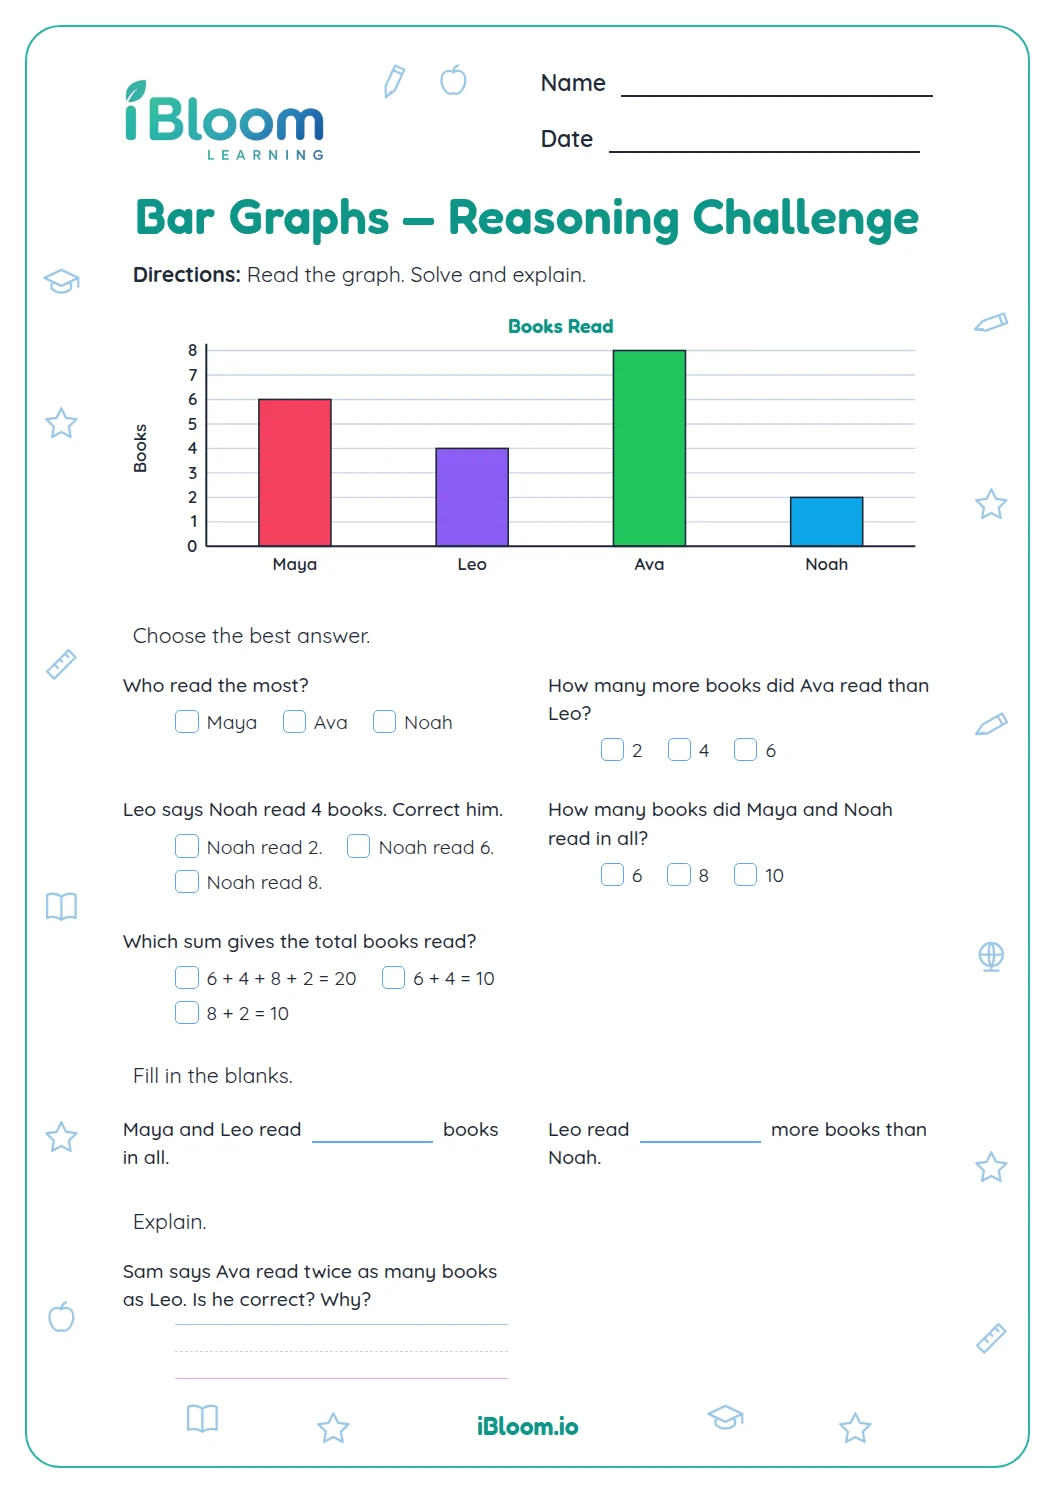
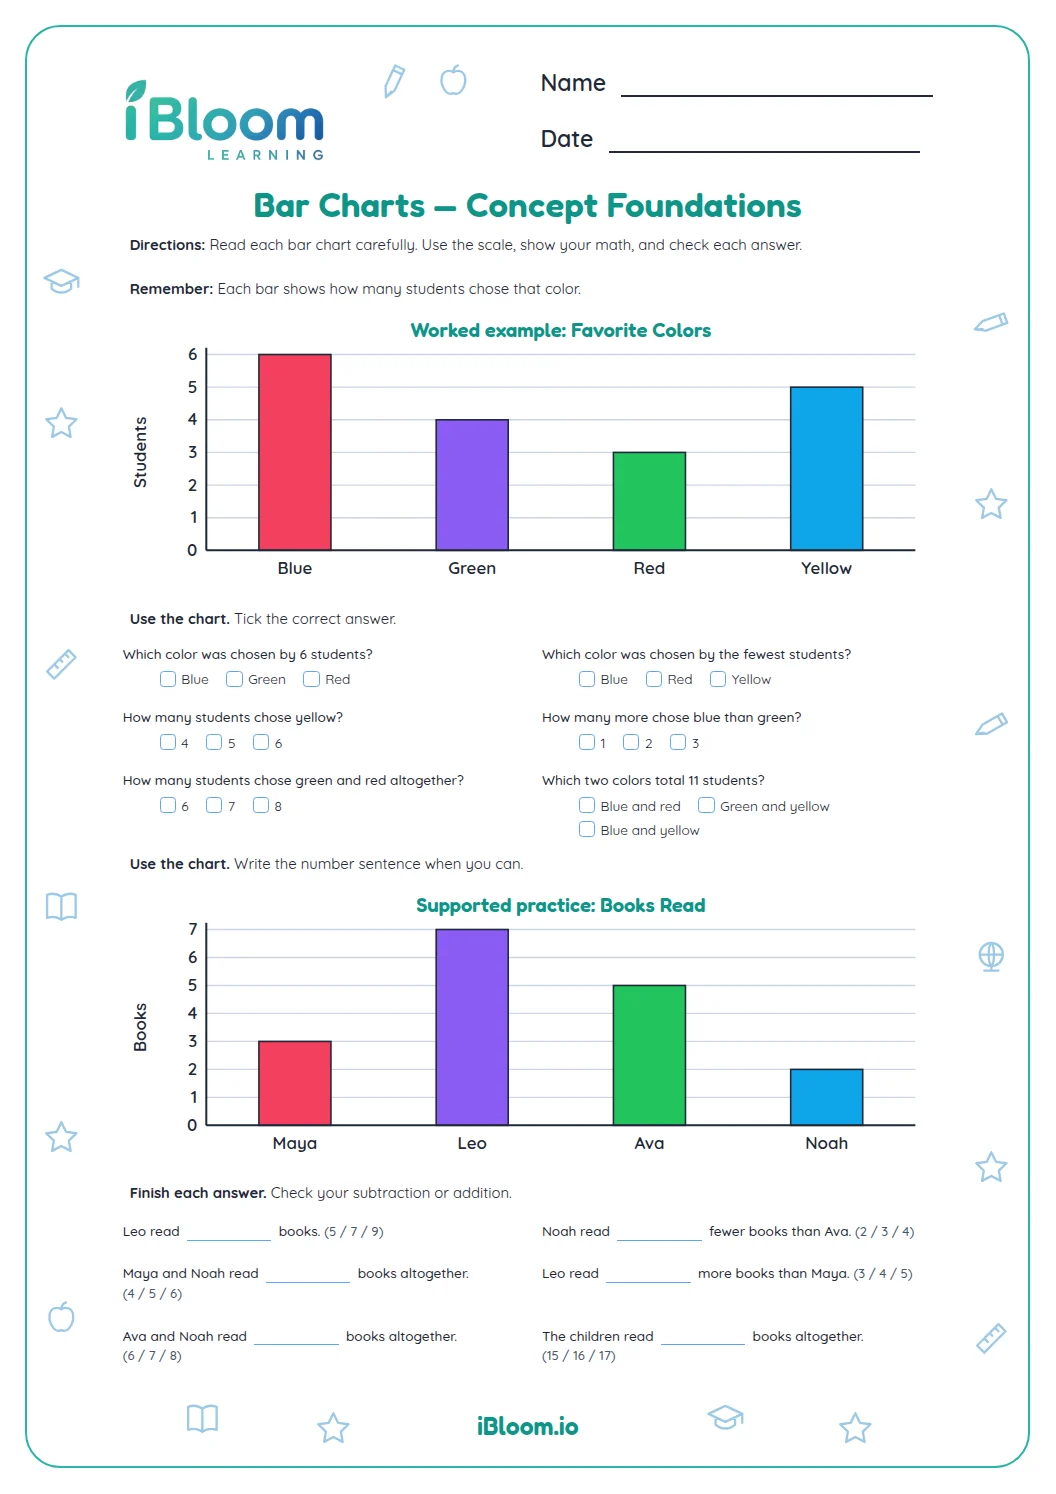
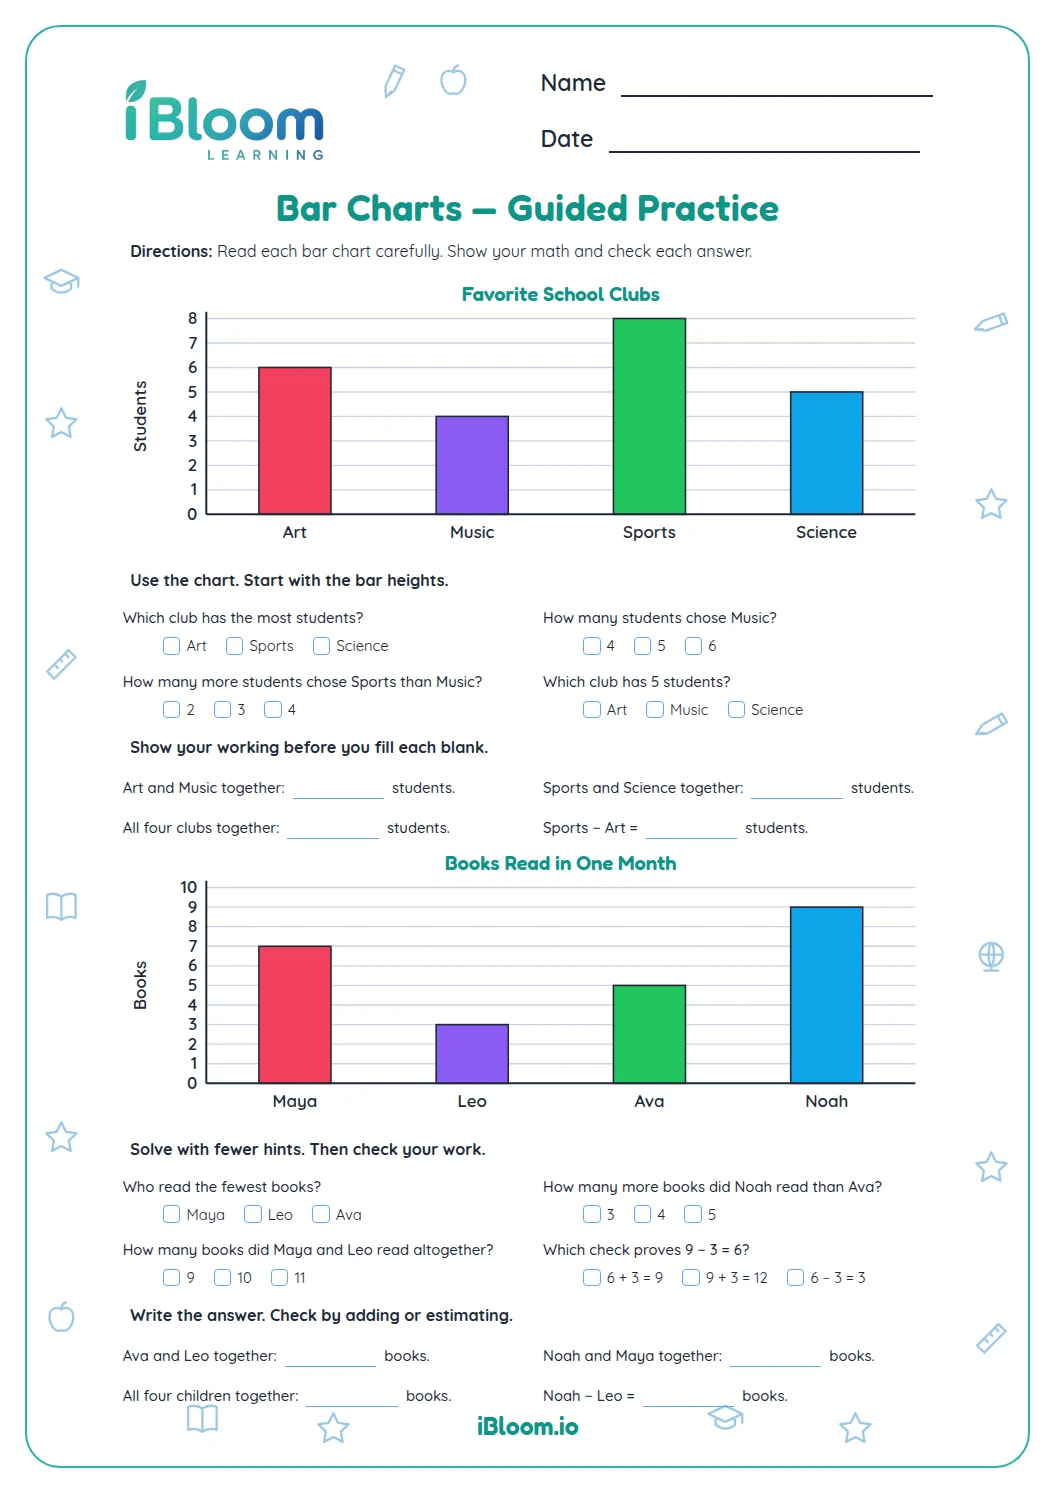
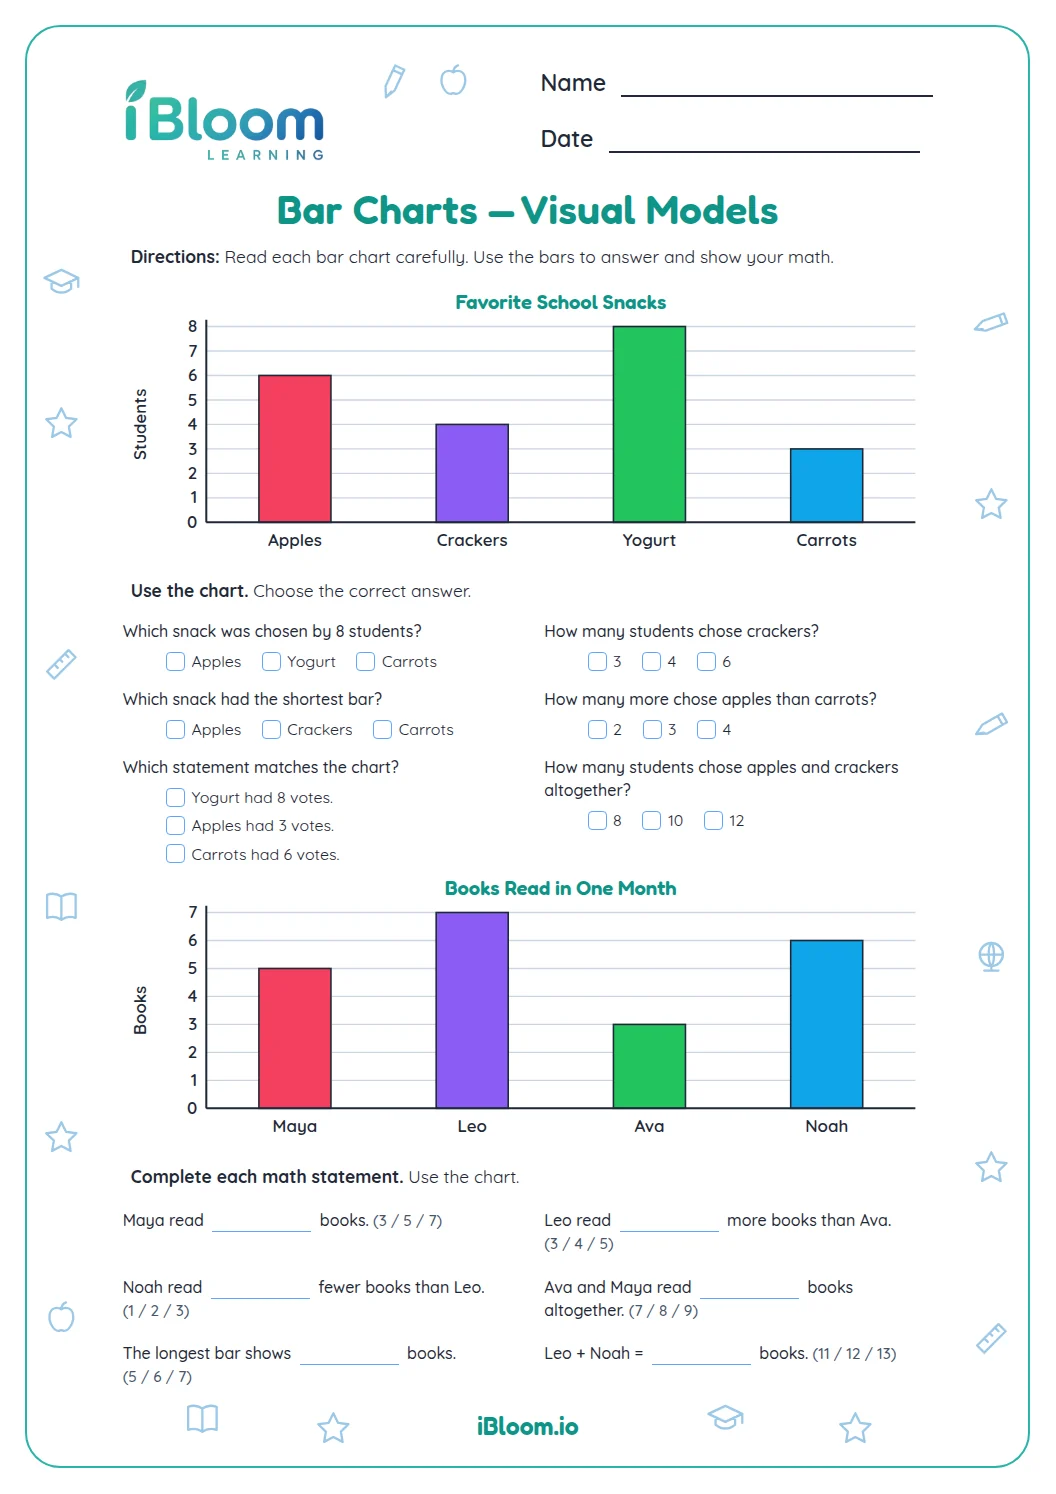
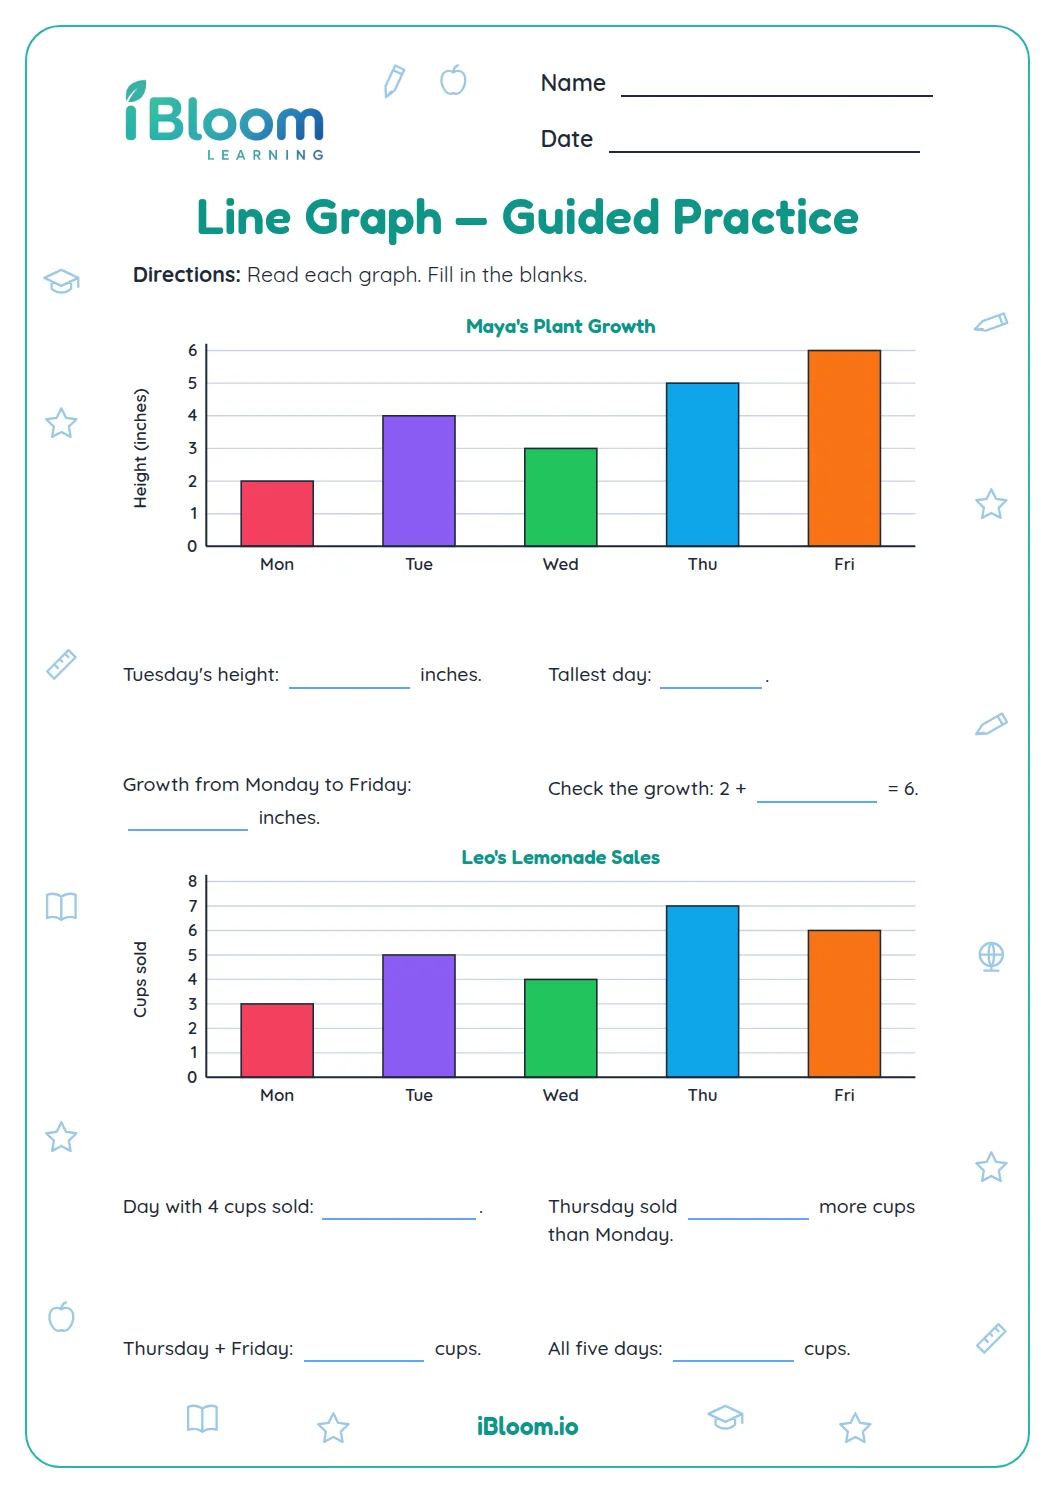
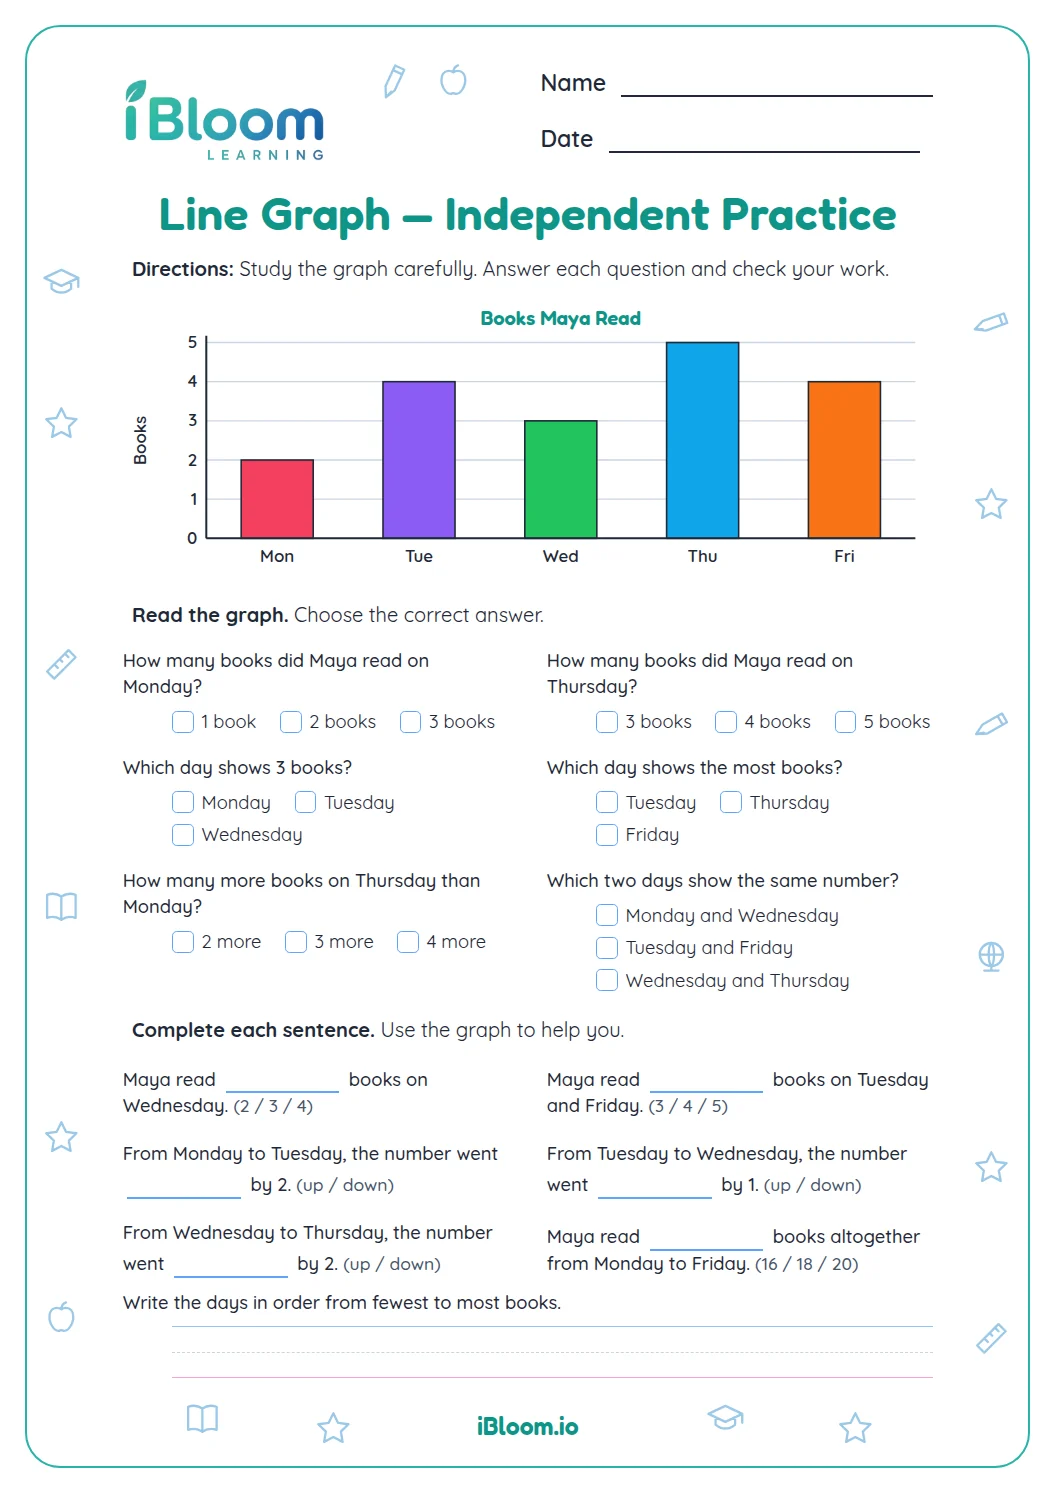
This Grade 2 printable has 14 questions about reading and comparing bar-graph data. Four questions use drawn bar graphs; the remaining items use compact category displays with the same counts to practice values, comparisons, and totals. A separate answer key is included. The page practices CCSS 2.MD.D.10.
Aligned to 2.MD.D.10
How do you read a bar value?
Follow the category label to its bar, then count the grid steps from zero to the bar top. In question 1, the Dogs bar reaches 12 votes.
- 1Find Dogs on the horizontal labels.
- 2Follow its bar to 12.
- 3Dogs received 12 votes.
How do you compare two bars?
Read both category values before subtracting or naming which is greater. A “how many more” question asks for the difference between the taller and shorter bars.
How do you find a total from a graph?
Read each requested category separately, then add the counts. Keep the category names in view so you combine the bars named in the question.
How to use this worksheet
- 1Read the graph title and category labels.
- 2Find the bar named in the question.
- 3Match its height to the value scale.
- 4For “how many more,” compare the two values.
- 5For a total, add only the requested categories.
Common mistakes and quick fixes
The mistake
Reading the label instead of the bar height.
The fix
Trace from the category along the bar to the value grid.
The mistake
Counting grid spaces starting at one above zero.
The fix
Begin at zero and count each unit step.
The mistake
Adding every bar for a two-category question.
The fix
Underline the categories named and use only those values.
This worksheet gives learners practice with the stated skill.
read a single-unit bar graph and solve compare and total questions from its data
On this sheet:
Show the official wordingHide the official wording
Draw a picture graph and a bar graph (with single-unit scale) to represent a data set with up to four categories. Solve simple put-together, take-apart, and compare problems using information presented in a bar graph.
What to practice next
Make more practice
Further reading
Questions parents and teachers ask
What does this Grade 2 worksheet practice?
Read each category count, then find a value, rank, difference, or total. The opening items use a drawn bar graph; later prompts show concise category data. The answer key lists all 14 results and supports checking each comparison.
How do you read a bar graph value?
A bar’s height shows the count for its category. Read the axis, then compare or combine the requested counts. The page begins with a drawn bar graph and continues with concise category-data questions so students practice interpreting graph information throughout.
How can a student answer “how many more” from a graph?
Read both bar values, then subtract the smaller value from the larger one. In question 2, dogs have 6 votes and fish have 2, so 6 − 2 = 4 more votes went to dogs. Use the page to check each step.
Does the worksheet ask children to combine graph values?
Yes. Some questions ask for a total across two or more categories. In question 4, the Cats and Fish bars show 4 and 2 votes; together they represent 6 votes. The worked examples use the same kind of quantities and relationships that appear in these questions, so learners can follow the reasoning and check a result.
Is an answer key included?
Yes. A separate answer key shows the response for all 14 questions. Children can point to the category and bar used for each answer, then use the scale to check the value. The worked examples use the same kind of quantities and relationships that appear in these questions, so learners can follow the reasoning and check a result.