

About this worksheet
This free printable worksheet teaches Grade 2 children to read a line graph and compare what it shows. The line graph tracks Maya's plant from Monday to Friday, with a dot for each day's height in inches. Children read heights, find the tallest day, spot where the line goes down and work out how much the plant grew. Page 2 adds a bar graph of lemonade cups sold, so children answer the same kind of questions from bars. It practices Common Core 2.MD.D.10, solving put-together and compare problems with information in a graph. A two-page answer key is included.
Aligned to 2.MD.D.10
What is on this line graph worksheet?
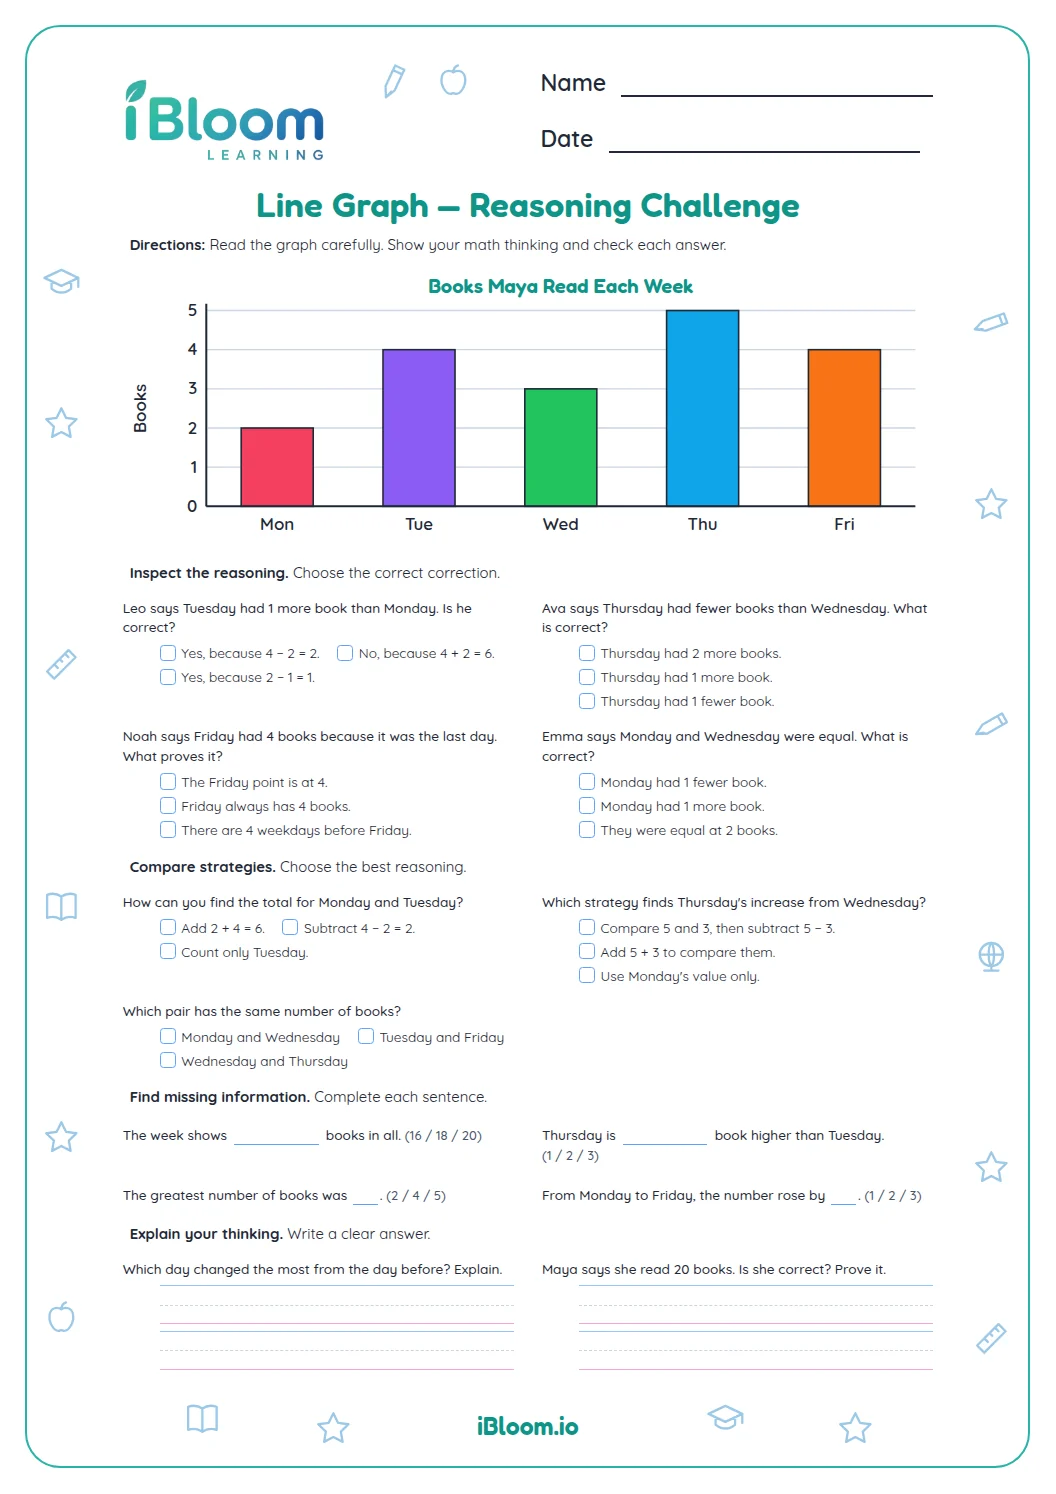
Page 1 is a line graph called Maya's Plant Height. The days Monday to Friday run along the bottom, the height in inches runs up the side from 0 to 6, and a dot for each day is joined by a line. The plant is 2 inches on Monday, 4 on Tuesday, 3 on Wednesday, 5 on Thursday and 6 on Friday.
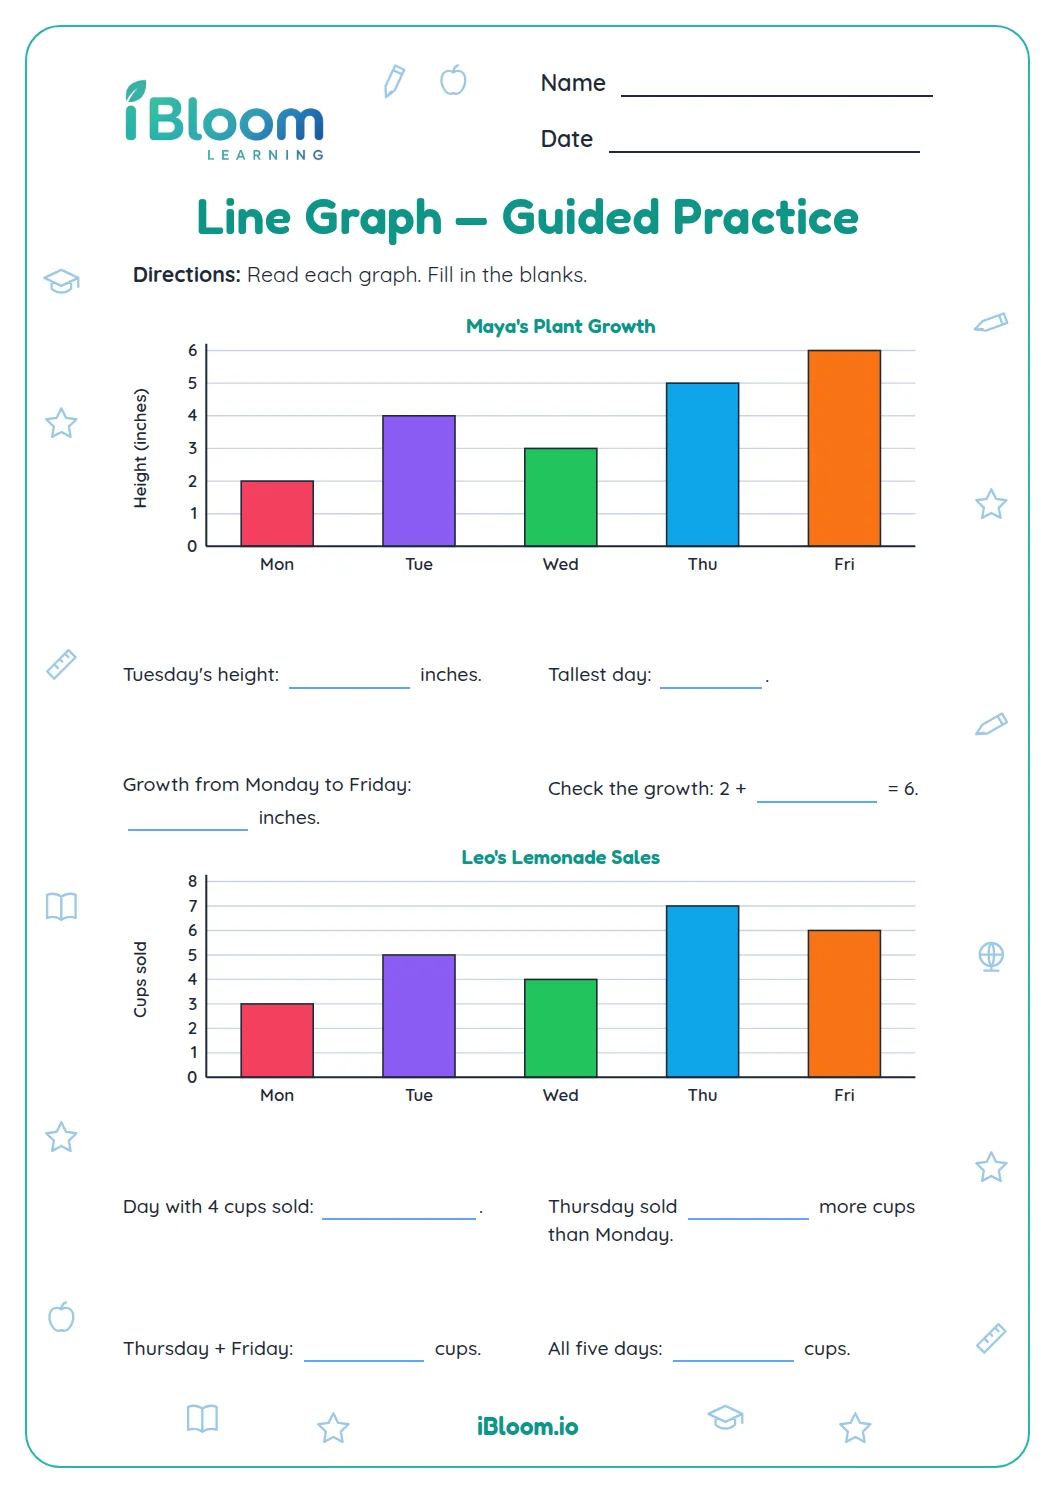
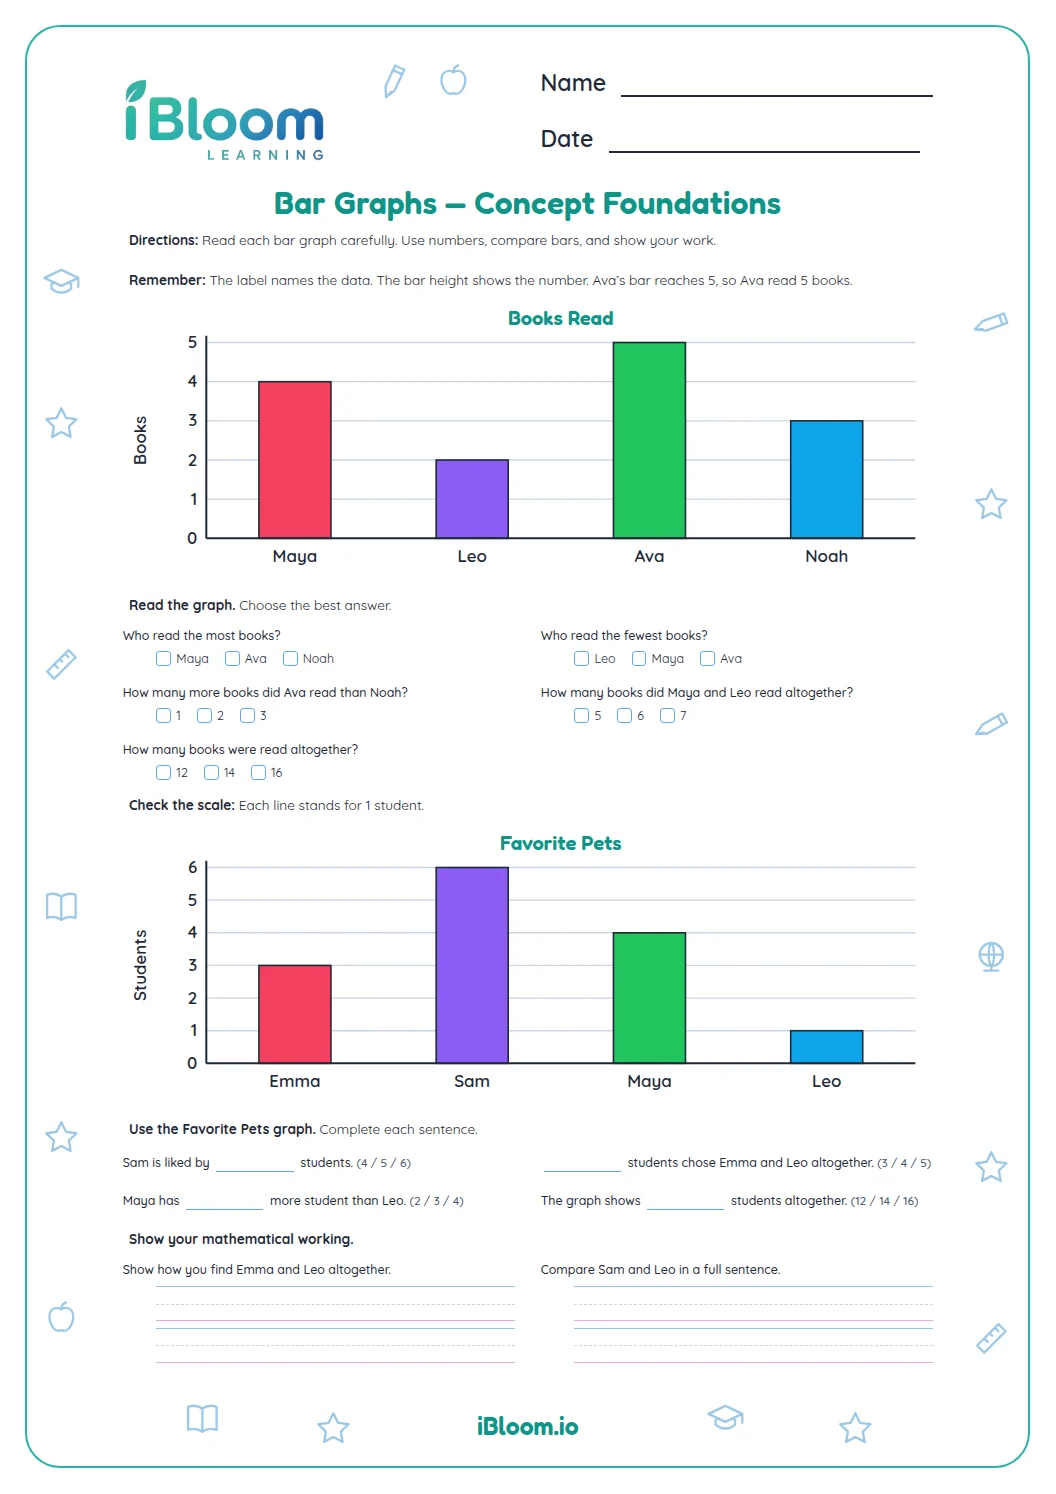
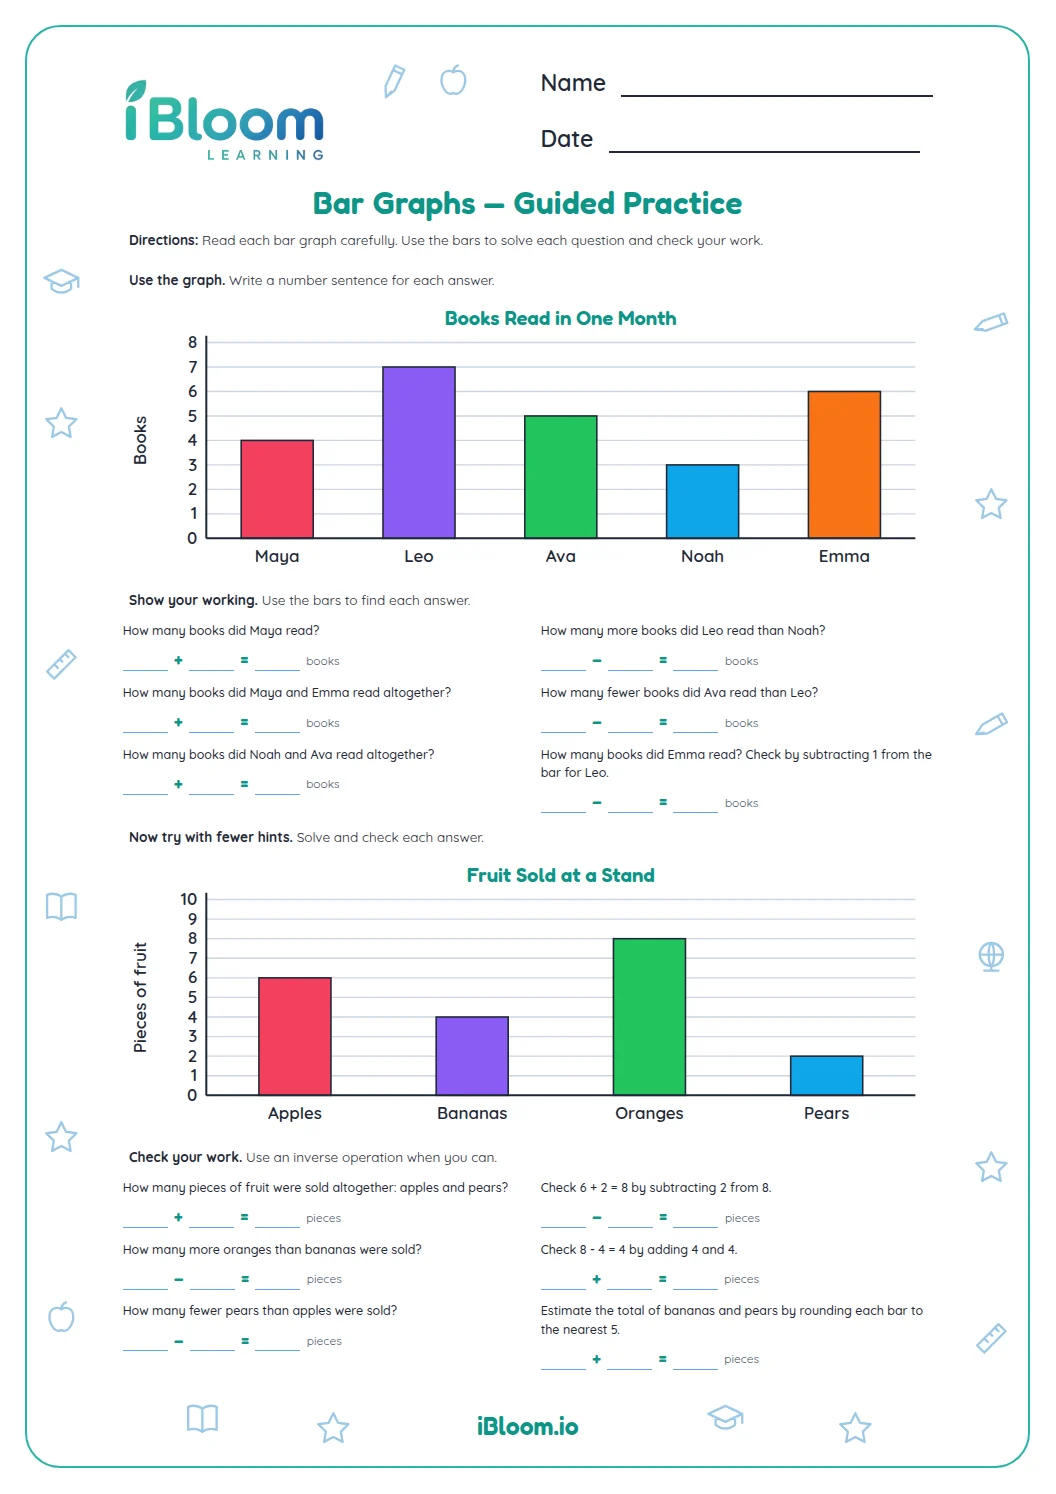
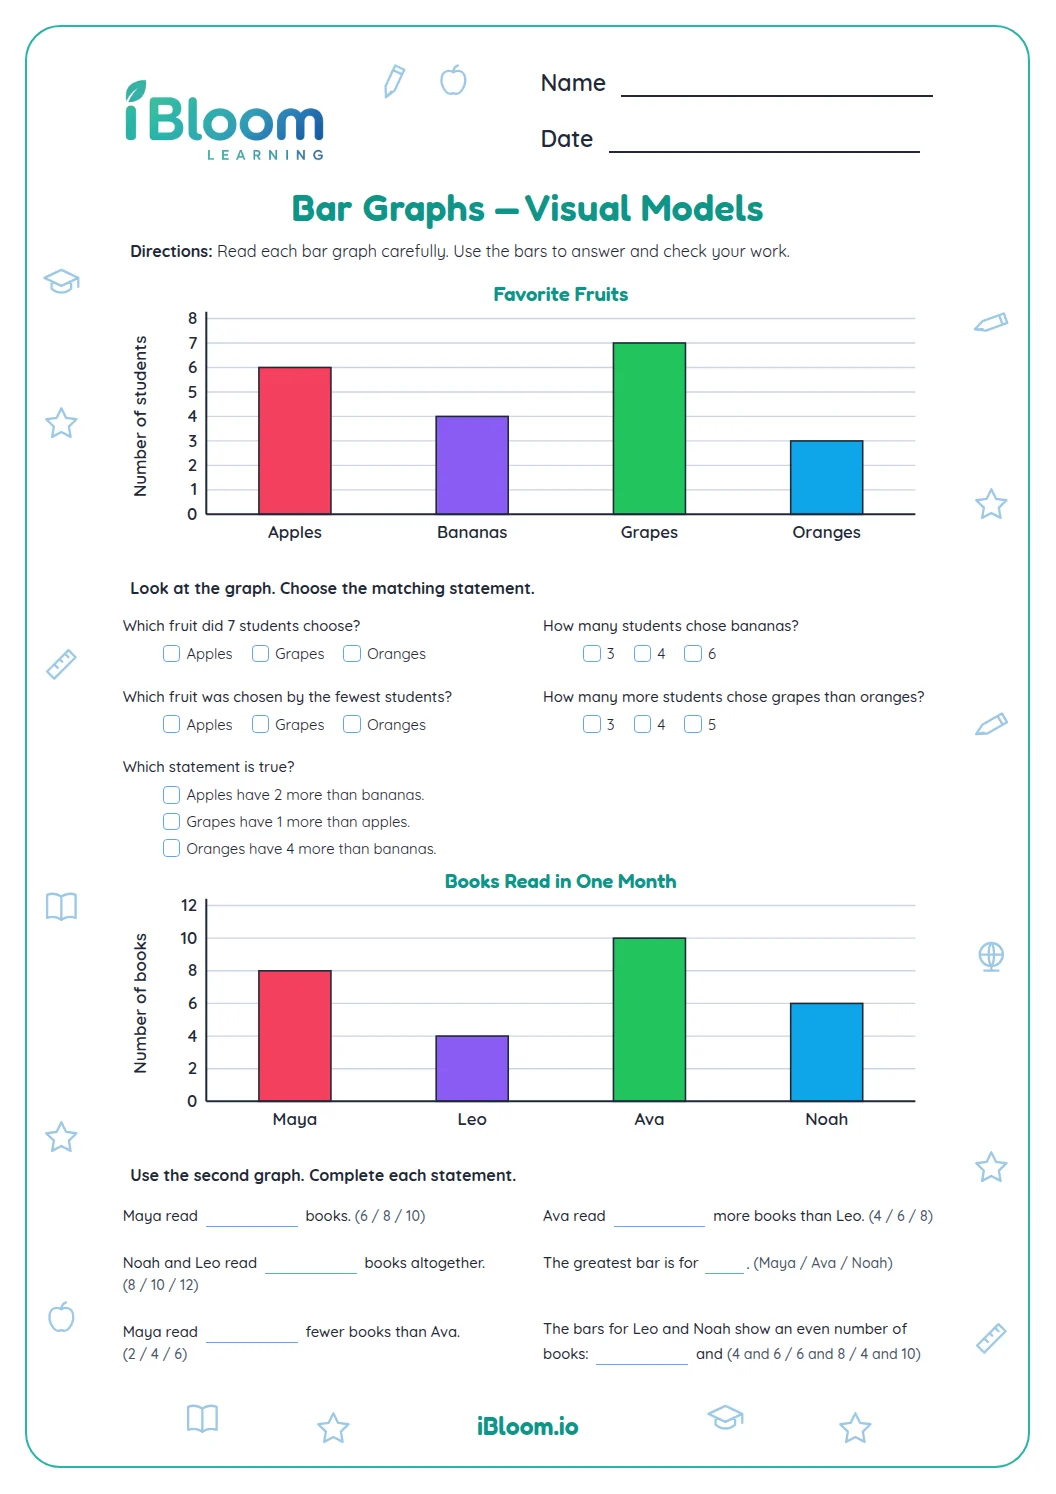
Page 2 starts with two fill-in questions about how much the plant grew, then switches to a bar graph of lemonade cups sold on the same five days: 4, 6, 6, 9 and 7. Seeing a line graph and a bar graph side by side shows children that both are read the same way, against the numbers on the side.
- Part A: read the line graph, 4 multiple-choice questions
- Part B: how much did the plant grow, 2 fill-in questions
- Part C: read the bar graph, 2 multiple-choice questions
- Part D: solve with the bar graph, 2 fill-in questions
How do you read a value on a line graph?
Put a finger on the day at the bottom, slide it up to the dot, then slide across to the scale. Wednesday's dot sits on the line marked 3, so the plant was 3 inches tall that day.
The line between two dots shows the change. When it slants up, the plant grew; when it slants down, the height dropped. On Maya's graph the line goes down only once, from Tuesday at 4 to Wednesday at 3, which is question 4.
- 1From Wednesday to Thursday, Maya's plant ___.
- 2Wednesday's dot is at 3. Thursday's dot is at 5.
- 3The line goes up, and 5 − 3 = 2.
- 4Answer: went up 2 inches
How do children find how much something changed?
Read both values first, then subtract the smaller from the larger. For question 6, Monday is 2 inches and Friday is 6 inches, so the plant grew 6 − 2 = 4 inches. Children can also count the gridlines between the two dots: 3, 4, 5, 6 is four steps.
The bar graph questions use the same idea. Thursday's bar reaches 9 and Monday's reaches 4, so 5 more cups were sold on Thursday. Question 10 puts two days together instead: 4 cups on Monday and 6 on Tuesday make 10 cups.
Why does the sheet have a line graph and a bar graph?
A line graph is a good fit for something that changes over time, like a plant's height, because the line shows whether it went up or down. A bar graph is a good fit for comparing amounts, like cups sold each day. Grade 2 children read both by lining up the top of a bar or a dot with the scale, so practicing them together builds one habit that works for every graph.
How to use this worksheet at home or in class
- 1Look at Maya's graph together and read each day's height aloud with its unit: "Monday, 2 inches."
- 2Ask your child where the line goes up and where it goes down before starting Part A.
- 3For each question, have your child touch the dot or bar first, then slide across to the number.
- 4In Parts B and D, ask "How do we find the difference?" and let your child subtract or count the gridlines.
- 5Check with the answer key, and for any miss, go back to the graph and read the two values again.
Common mistakes and quick fixes
The mistake
Answering question 3 with went up 1 inch because Thursday is the next day after Wednesday.
The fix
Read both dots before choosing: Wednesday is 3 and Thursday is 5. The change is 5 − 3 = 2, not one step along the bottom.
The mistake
Writing 4 for question 5, the height on Tuesday, instead of how much taller Tuesday was than Monday.
The fix
Point out the word taller. It asks for the difference: Tuesday is 4 and Monday is 2, so Tuesday is 2 inches taller.
The mistake
Reading a bar from the wrong gridline, such as calling Friday's lemonade bar 8 cups.
The fix
Lay a ruler or the edge of a paper across the top of the bar to the scale. Friday's bar lines up with 7.
Common Core alignment
Grade 2 children use graphs to solve put-together and compare problems, and this sheet does that with a line graph and a bar graph.
Use a graph to answer compare and put-together questions, such as how many more cups on Thursday.
On this sheet: Parts C and D read a single-unit bar graph to compare days and add two days; Parts A and B ask compare questions about a line graph.
Show the official wordingHide the official wording
Draw a picture graph and a bar graph (with single-unit scale) to represent a data set with up to four categories. Solve simple put-together, take-apart, and compare problems using information presented in a bar graph.
What to practice next
Make more practice
Further reading
Questions parents and teachers ask
What does this line graph worksheet show?
Page 1 is a line graph of Maya's plant height in inches from Monday to Friday, with one dot for each day. Page 2 asks how much the plant grew, then adds a bar graph of lemonade cups sold on the same five days. All 10 questions are answered by reading one of the two graphs.
What is the difference between a line graph and a bar graph?
A line graph puts a dot at each value and joins the dots, so you can see a change over time, like a plant growing. A bar graph uses a separate bar for each item. Children read both the same way: line up the dot or the top of the bar with the numbers on the side.
Why does the line on Maya's graph go down on Wednesday?
The plant measured 4 inches on Tuesday and 3 inches on Wednesday, so the dot is lower and the line slopes down. A plant can droop on a hot day. Question 4 asks children to find that spot, which teaches them that a line going down means the value got smaller.
What are the answers?
Part A: 3 inches, Friday, went up 2 inches, and Tuesday and Wednesday. Part B: 2 and 4. Part C: 9 cups, and Tuesday and Wednesday. Part D: 5 more cups and 10 cups in all. The two-page answer key marks each choice and fills in each number.
How can I help if my child misreads the graph?
Slow down the reading. Have your child put a finger on the day, slide up to the dot or bar top, then slide across to the scale and say the number aloud with its unit. A strip of paper laid across the graph keeps the eye on one gridline.
How long does the sheet take?
Plan on about 15 minutes. Page 1 is the line graph and page 2 is mostly the bar graph, so you can do one page a day. For an extra challenge, ask your child to say one sentence comparing Monday and Friday, such as "Friday was 4 inches taller."