



About this worksheet
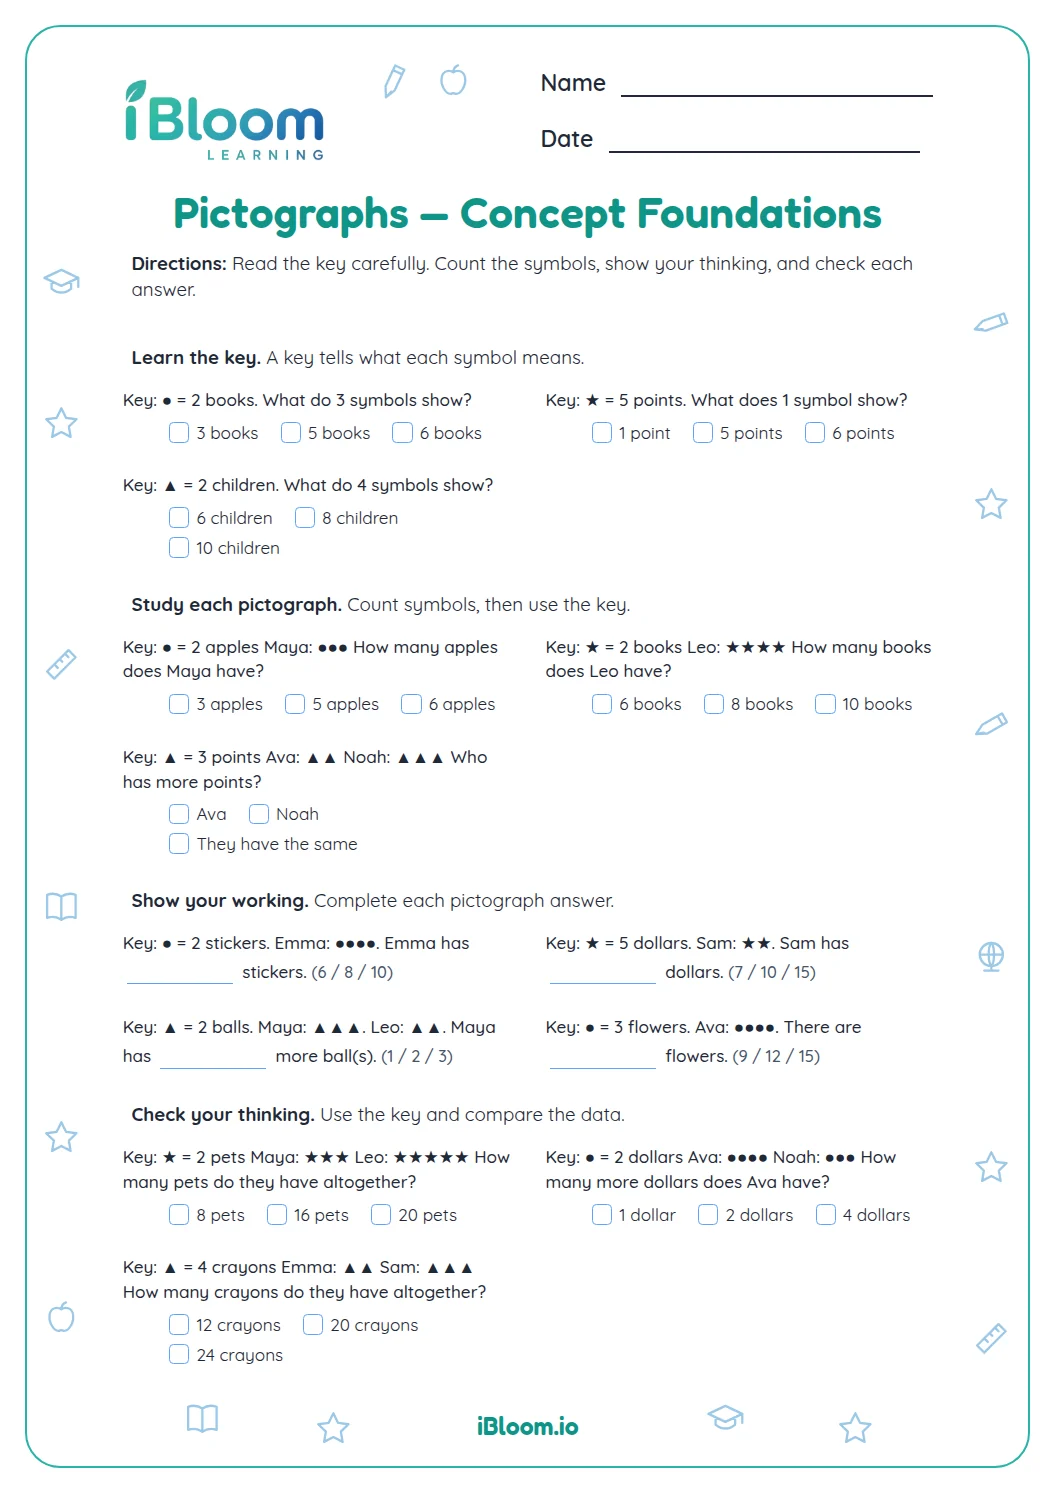
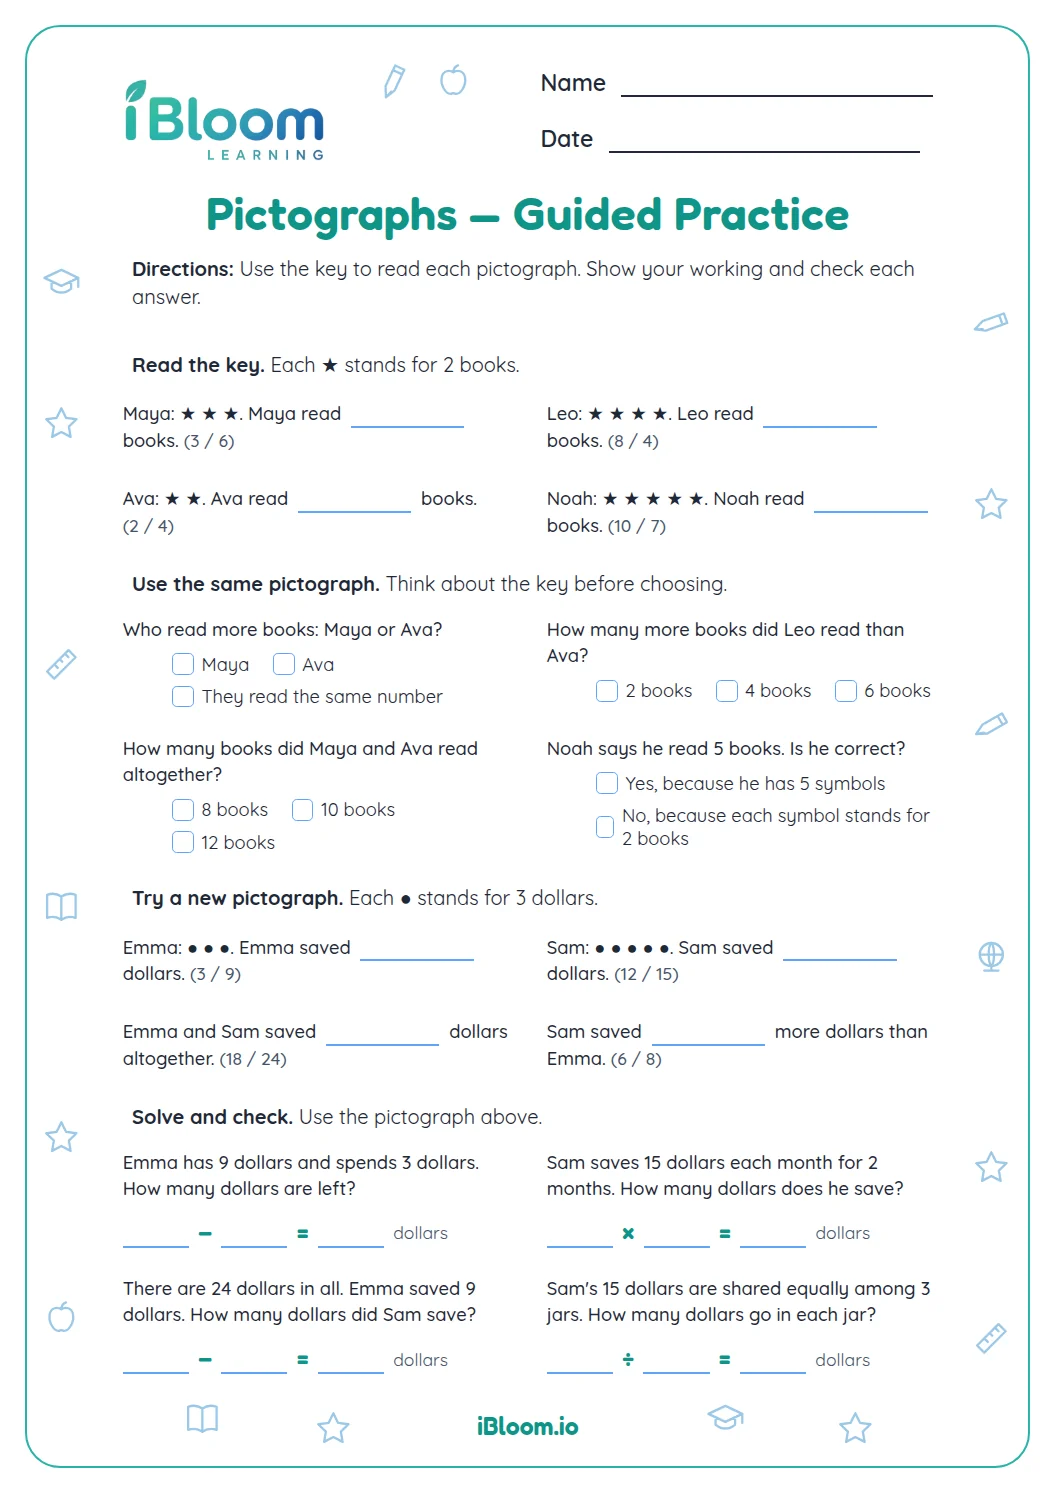
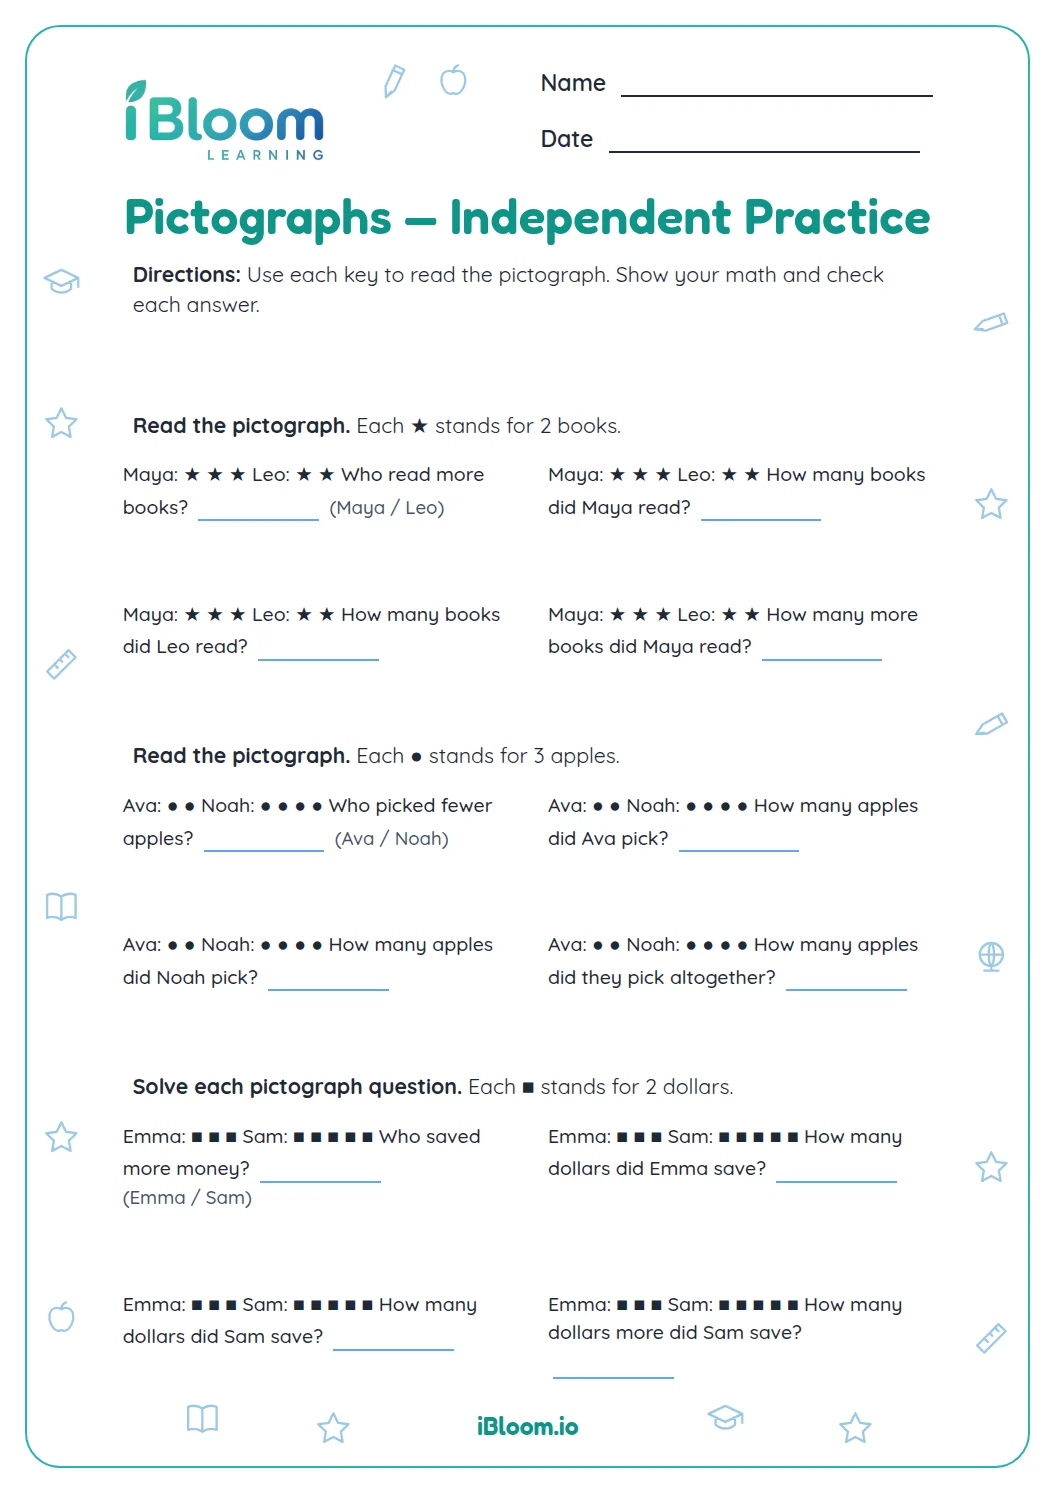
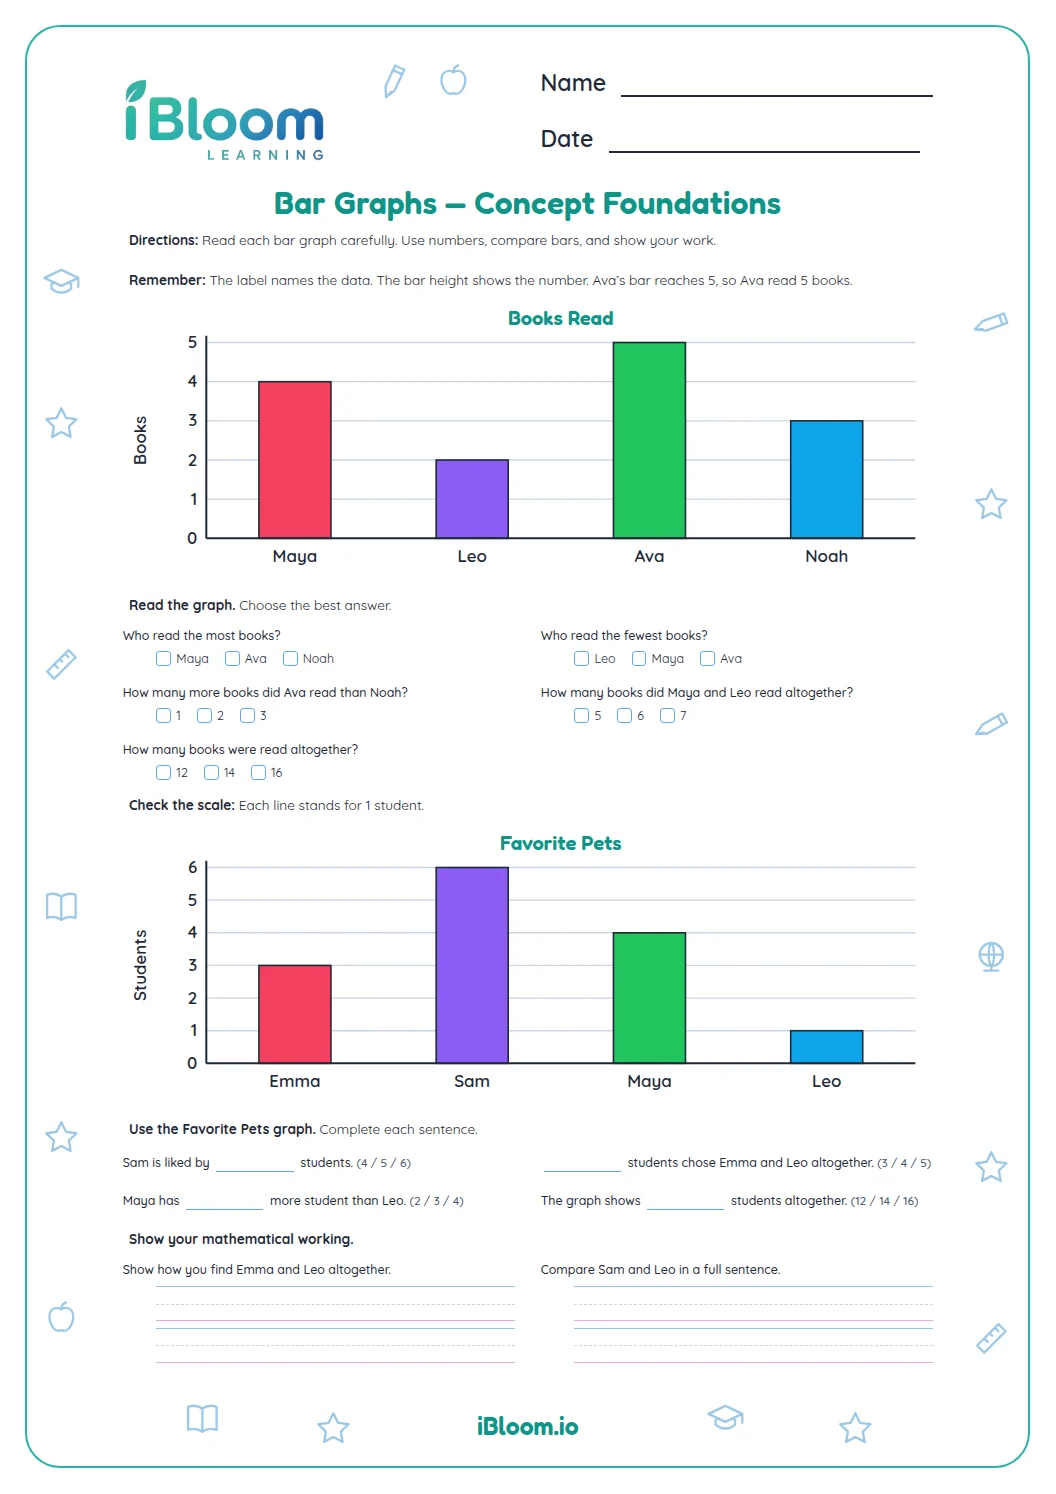
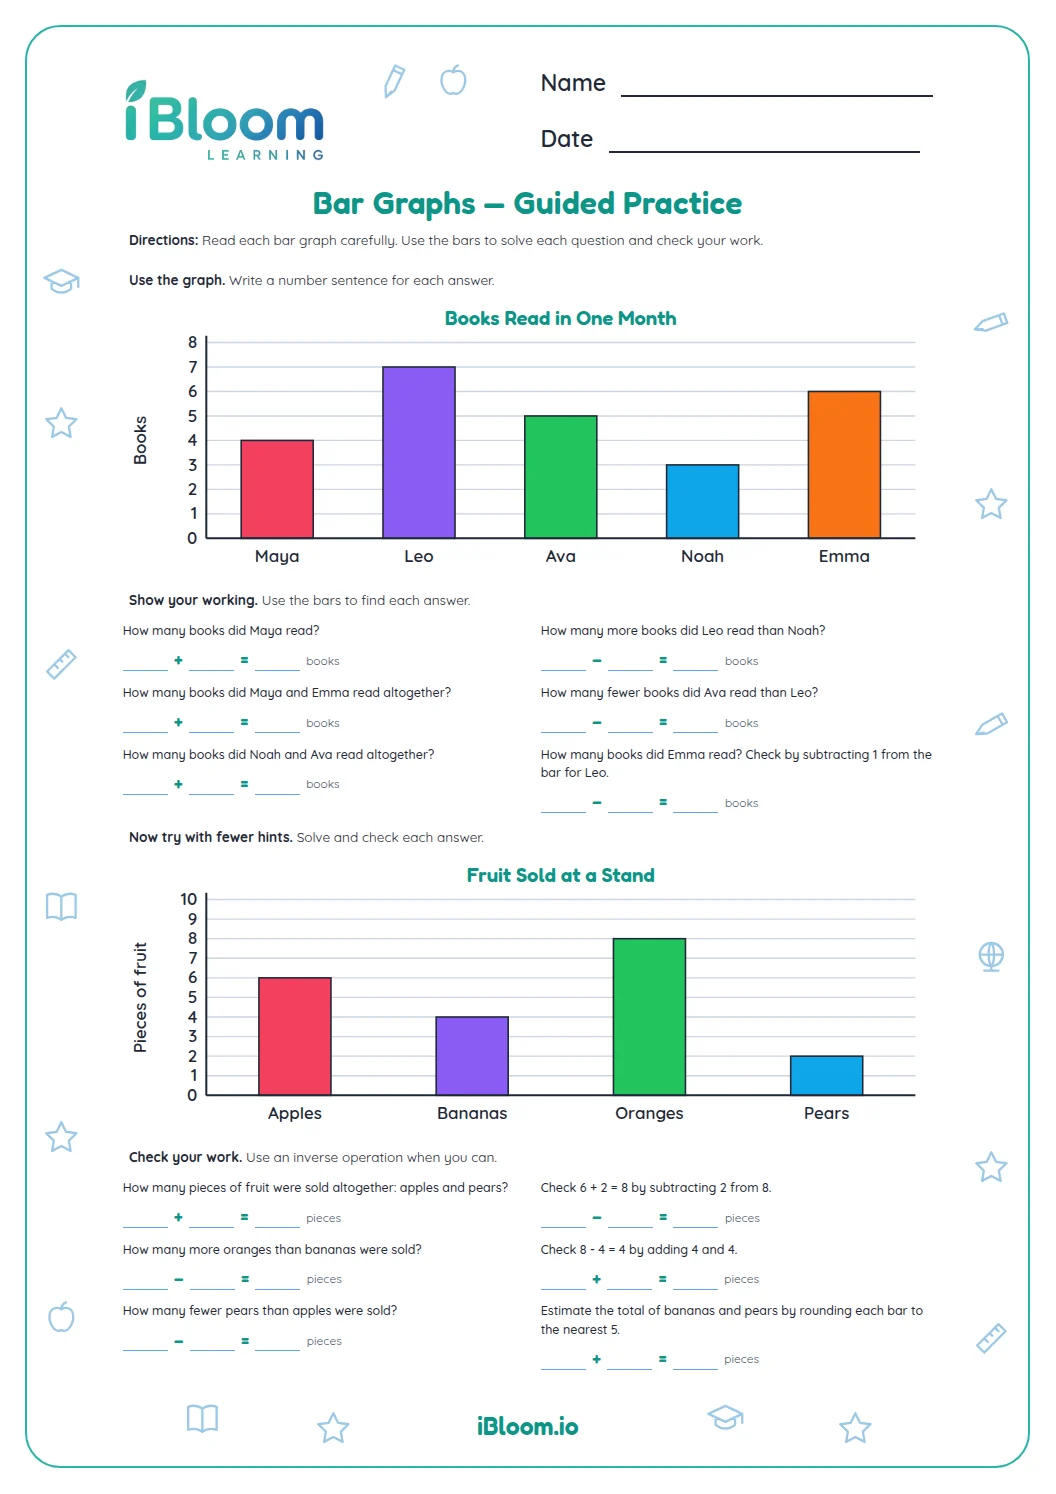
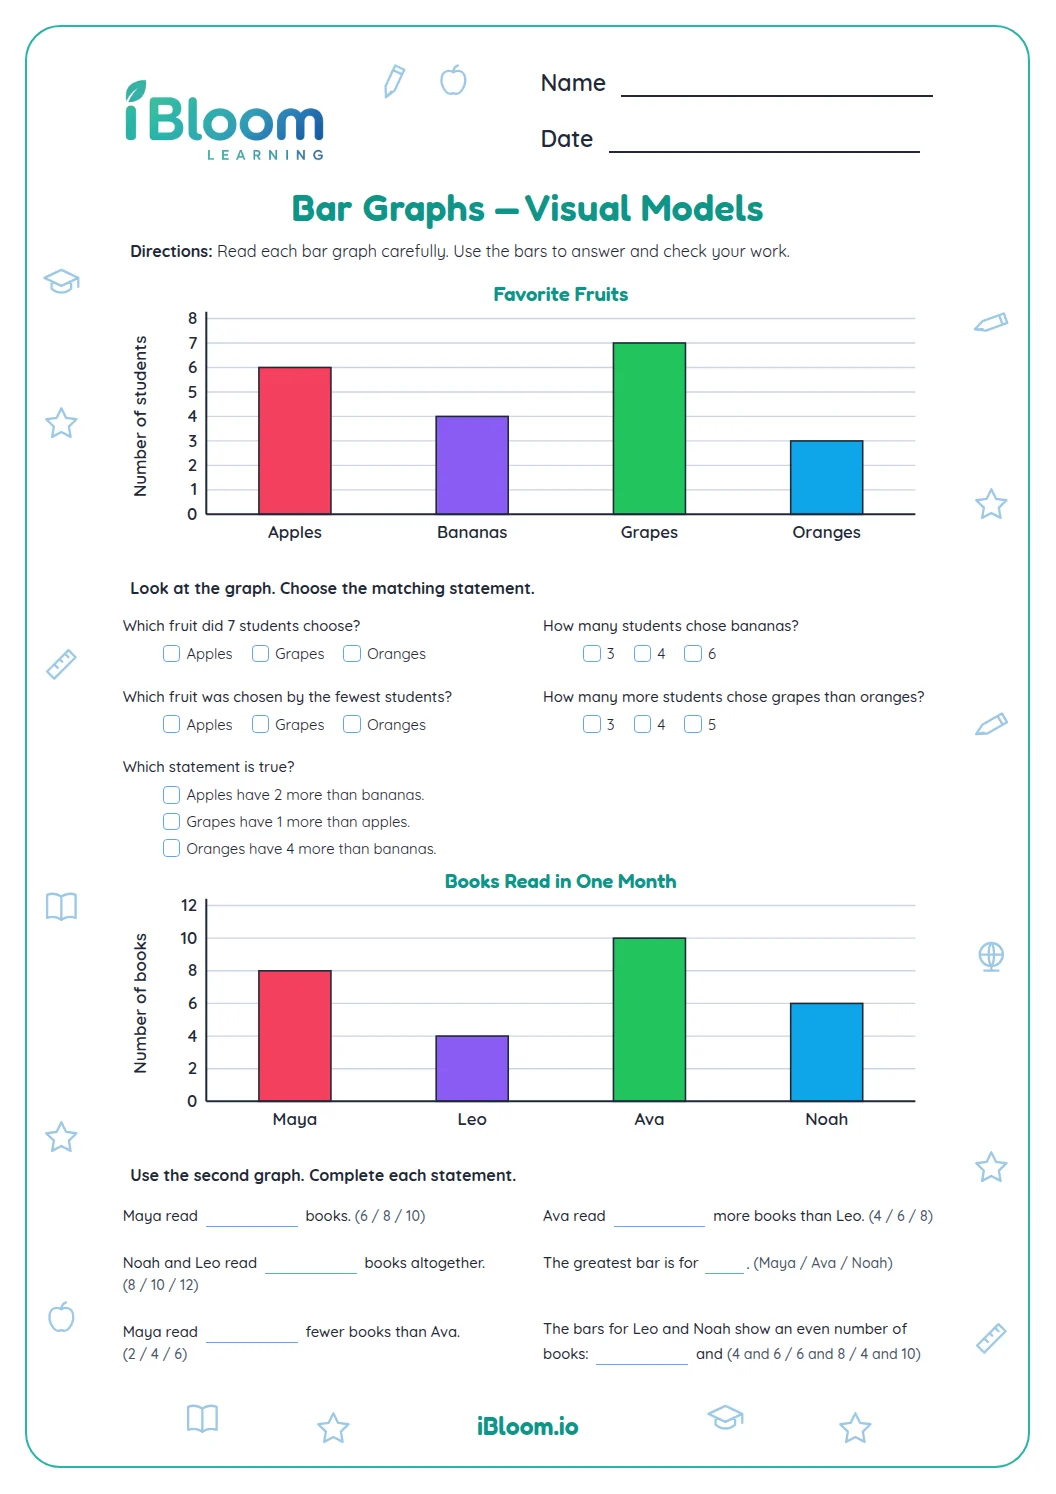
This Grade 2 page uses a book pictograph with four student rows. Each book icon represents two books. Students read the key, identify values, compare rows, combine totals, and write one comparison sentence. The separate key includes answers and a sample sentence.
Aligned to 2.MD.D.10
How do you read the pictograph key?
The key says one book icon stands for two books. Count the icons in a row, then count by twos to find the student’s total. The graph shows Ava with 6 books, Ben with 4, Chen with 8, and Dee with 2.
- 1Chen has 8 books and Dee has 2.
- 28 − 2 = 6, so Chen read 6 more books than Dee.
How do you compare two rows?
For “how many more” or “how many fewer,” subtract the smaller total from the larger total. To find how many altogether, add the totals. Keep the unit as books in your answer.
What makes a comparison sentence clear?
Name both students and include the difference. For example, “Chen read 2 more books than Ava” compares their graph totals and states how far apart they are.
How to use this worksheet
- 1Read the key above the graph before counting icons.
- 2Find the student row named in each question.
- 3For “altogether,” add the named totals; for “more,” find the difference.
- 4Write a comparison that names both students and uses a correct total.
- 5Check each value against the graph and key.
Common mistakes and quick fixes
The mistake
Counting each picture as one book
The fix
Use the key: each icon represents two books.
The mistake
Adding when a question asks how many more
The fix
Subtract the smaller total from the larger total to find the difference.
The mistake
Writing only a number in the comparison sentence
The fix
Name both students and state who read more or fewer books.
Common Core alignment
This worksheet practices the listed standard.
Read a four-category picture graph and solve put-together and compare questions.
On this sheet: The pictograph has four categories and students solve compare and put-together questions from its displayed values.
Show the official wordingHide the official wording
Draw a picture graph and a bar graph (with single-unit scale) to represent a data set with up to four categories. Solve simple put-together, take-apart, and compare problems using information presented in a bar graph.
What to practice next
Make more practice
Further reading
Questions parents and teachers ask
What does each book picture stand for?
Each icon stands for two books, as shown in the graph key. Count the icons in a row by twos to find a student’s total. For instance, four icons represent eight books, so remember to use the key before answering.
Which students read the most and the fewest books?
Chen read the most with 8 books, and Dee read the fewest with 2 books. The graph lets students compare the four totals visually. Questions also ask them to combine rows and determine how much one student would need to catch another.
How do students answer “how many more” questions?
Read both totals from the graph, then subtract the smaller from the larger. Chen has 8 books and Dee has 2, so the difference is 6 books. The key supports checking that each icon was counted as two.
What is included in the answer key?
The separate answer key lists the values read from the pictograph, the sums and differences, and a sample comparison sentence. A written answer can use different wording as long as it accurately compares two students’ totals and uses their graph values.
How many books did the class read altogether?
Add the four student totals shown in the pictograph: 6, 4, 8, and 2 books. Their sum is 20 books. Question 6 asks students to combine the rows, while the key shows the total so families can check the calculation.