




About this worksheet
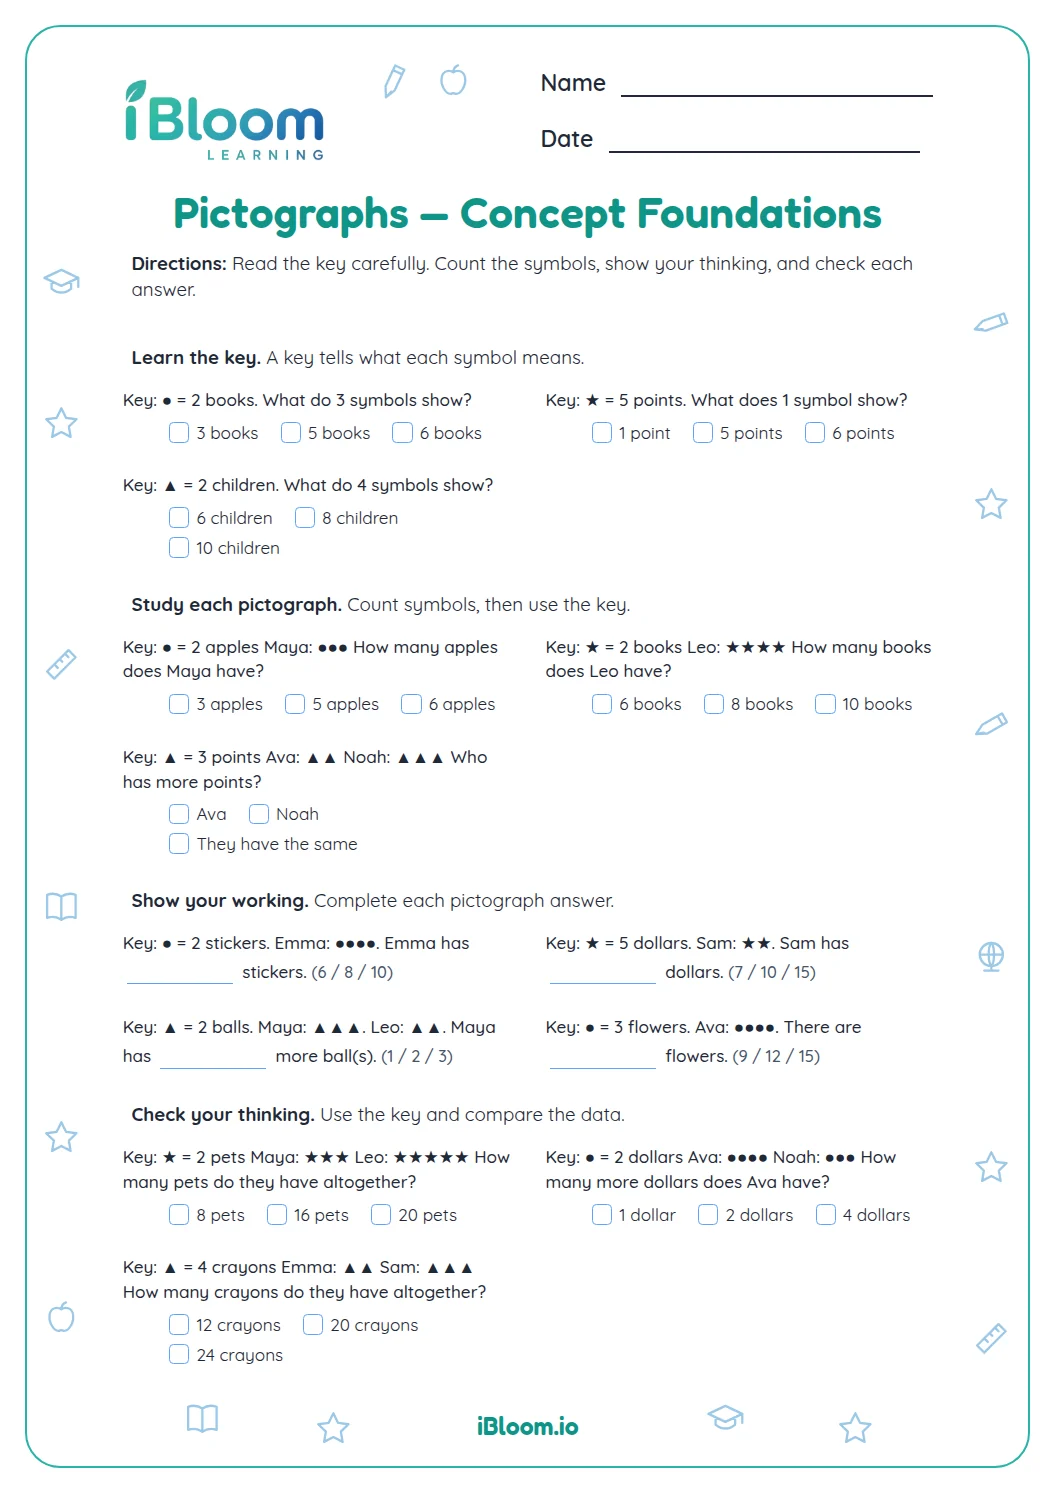
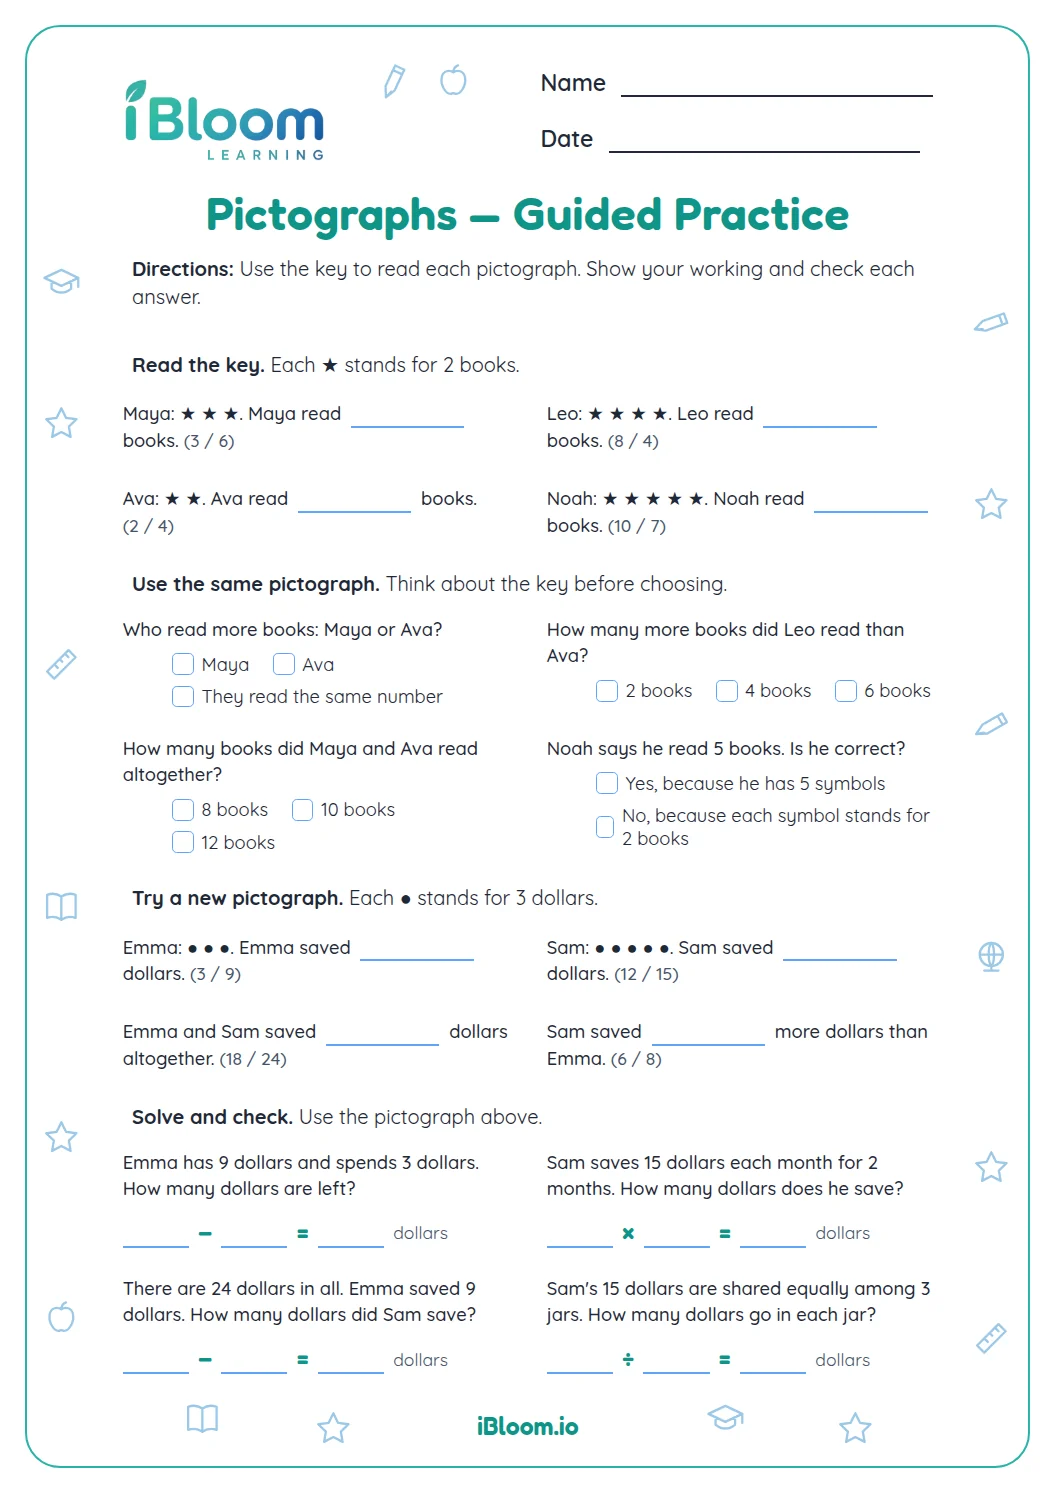
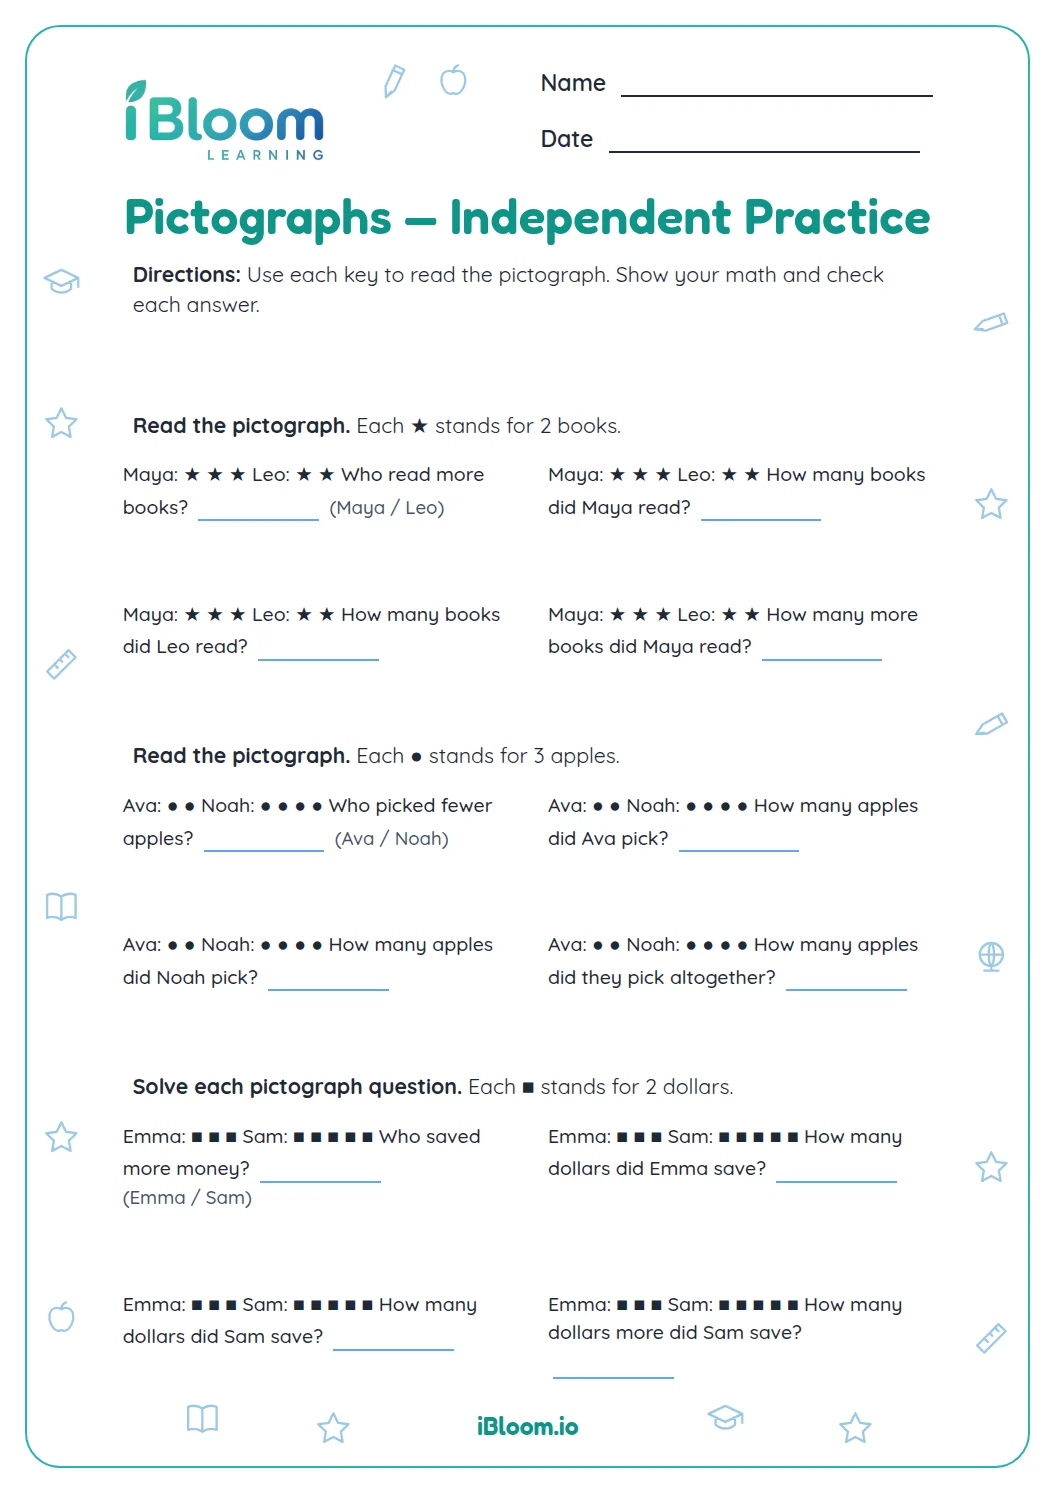
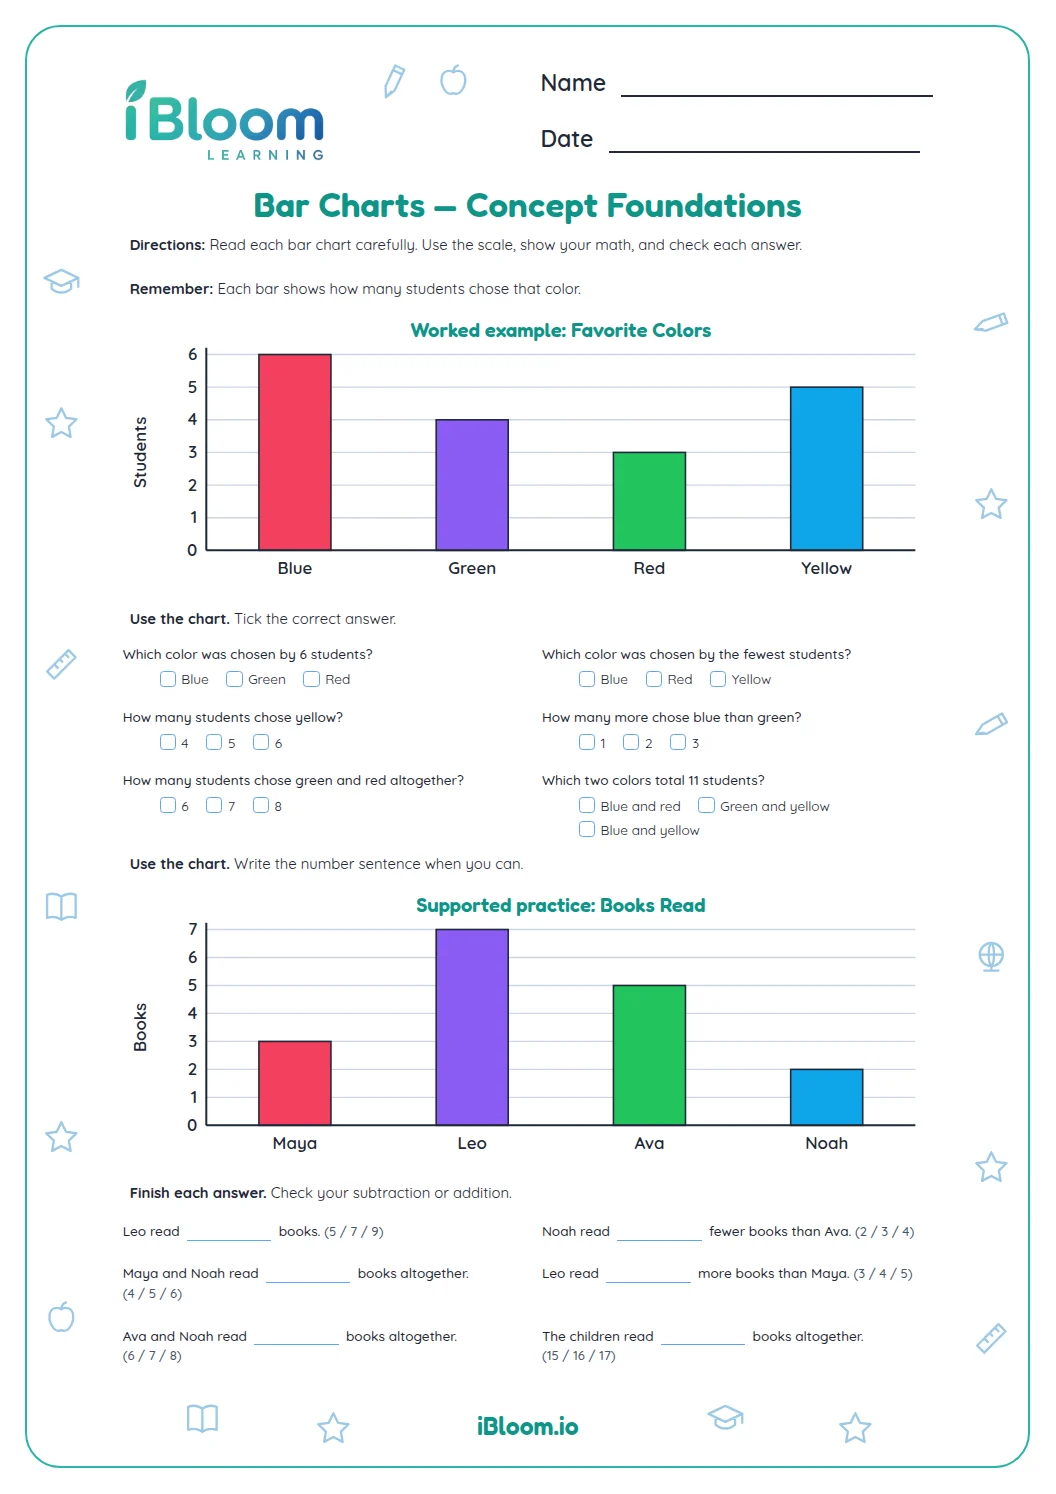
This Grade 2 pictograph worksheet uses a favorite-snack survey. Students read the graph key, find category totals, compare rows, and combine counts. Fourteen short questions keep the practice focused on one picture graph, with a separate answer key.
How does the pictograph key show vote totals?
In the favorite-snack graph, one symbol stands for 2 students. Count the symbols in a row and use the key to find the category total.
How can you compare two snack rows?
Read each row total using the key, then subtract the smaller total from the larger. The difference tells how many more students chose one snack.
How do you find the total votes?
Add the totals for all three snacks. Apples have 6 votes, bananas have 4, and grapes have 8, so 6 + 4 + 8 = 18 students.
- 1Apples: 3 symbols × 2 = 6
- 2Bananas: 2 symbols × 2 = 4
- 3Grapes: 4 symbols × 2 = 8
- 4Total: 6 + 4 + 8 = 18
How can an adult guide pictograph practice?
- 1Ask the student to read the key out loud first.
- 2Count the symbols in one row, then multiply by the key value.
- 3Write the category total with its unit.
- 4Compare two totals by subtracting the smaller from the larger.
- 5Add all categories when a question asks for the total.
- 6Check that the answer matches the graph story.
Pictograph mistakes to watch for
The mistake
Counting each symbol as one vote even when the key says it represents more.
The fix
Read the key and multiply the number of symbols by its value.
The mistake
Subtracting the larger number from the smaller and reporting a negative count.
The fix
For “how many more,” put the larger total first.
The mistake
Adding picture counts instead of category totals.
The fix
Convert each category using the key, then add the resulting numbers.
What to practice next
Make more practice
Questions parents and teachers ask
What does one symbol stand for?
The pictograph key says that one snack symbol represents 2 students. Count the symbols in a row and use that value to find how many students chose that snack. The key applies to apples, bananas, and grapes alike.
How can students find the most popular snack?
Use the key to find the total for each row, then compare the totals. The row with the greatest total has the most votes. In this graph, the grape row has the highest count. Students can check by matching each row symbol count to the printed key.
How do you find how many more students chose one snack?
Read both category totals from the pictograph, then subtract the smaller amount from the larger amount. The difference tells how many more students selected one snack than the other. For example, 8 grape votes minus 6 apple votes is a difference of 2 students.
How do you find the total number of votes?
Read the total for every category using the key, then add those amounts. For this graph, add the apple, banana, and grape votes to find the number of students represented altogether. This gives the class total represented in the data, not just the symbol count.
Is an answer key included?
Yes. The separate key gives the correct graph choices for all 14 questions. It includes category totals, comparisons, key use, and combined counts so students can check how they read the picture data. Students can use the key to review how the symbol count becomes a vote total.