


About this worksheet
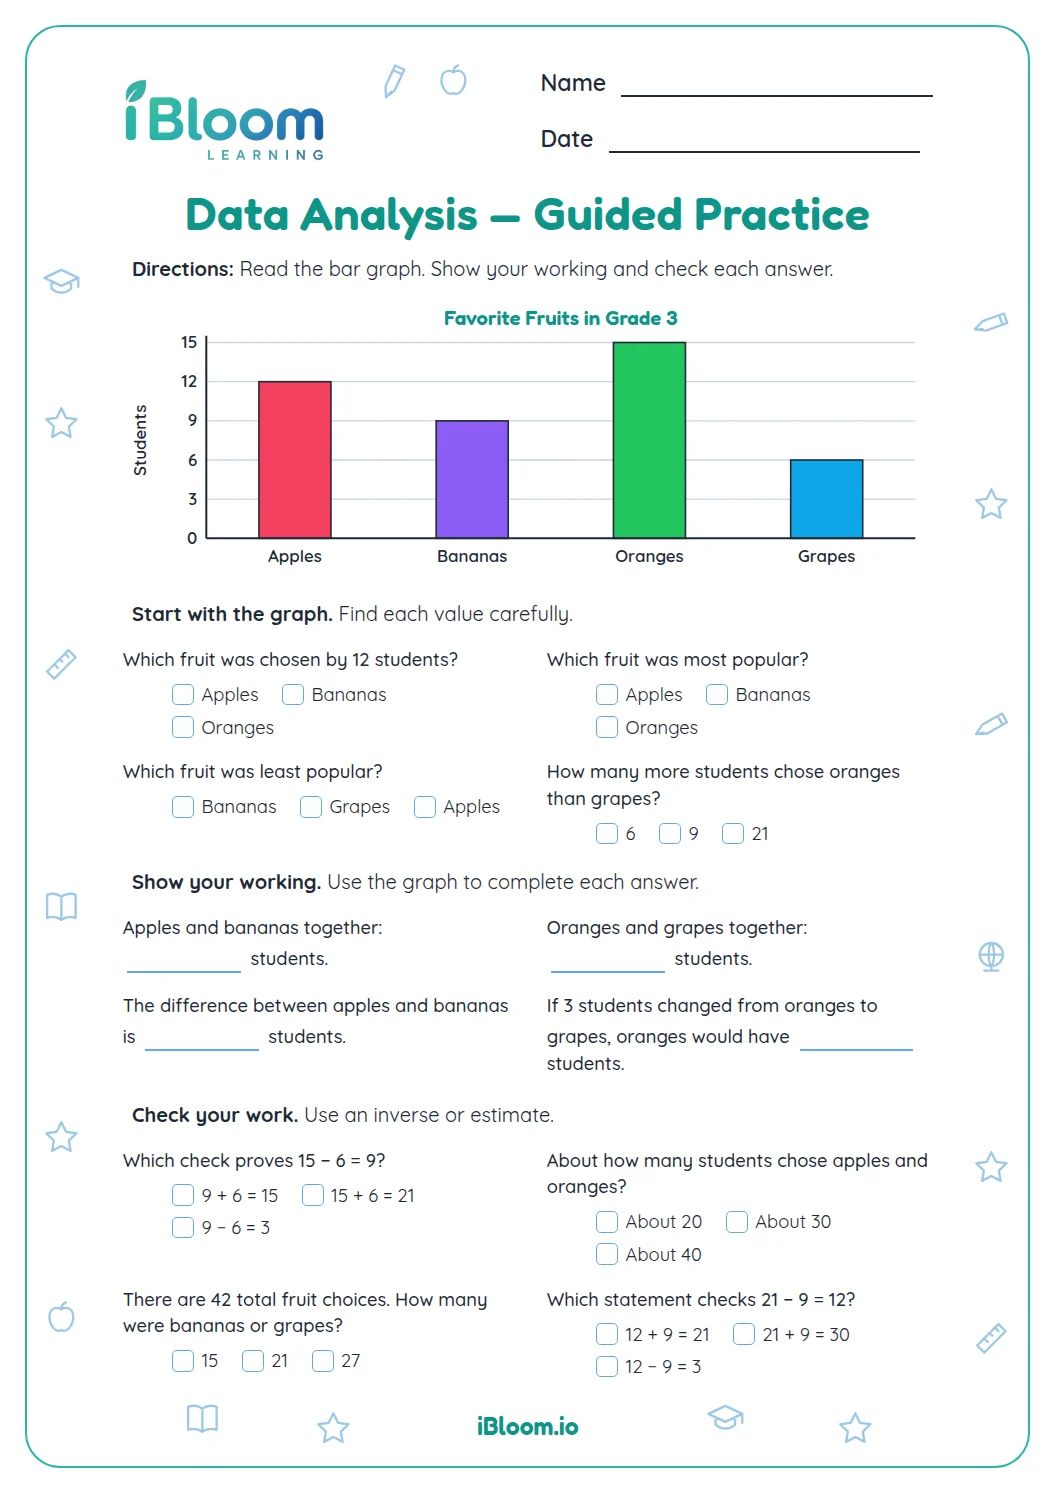
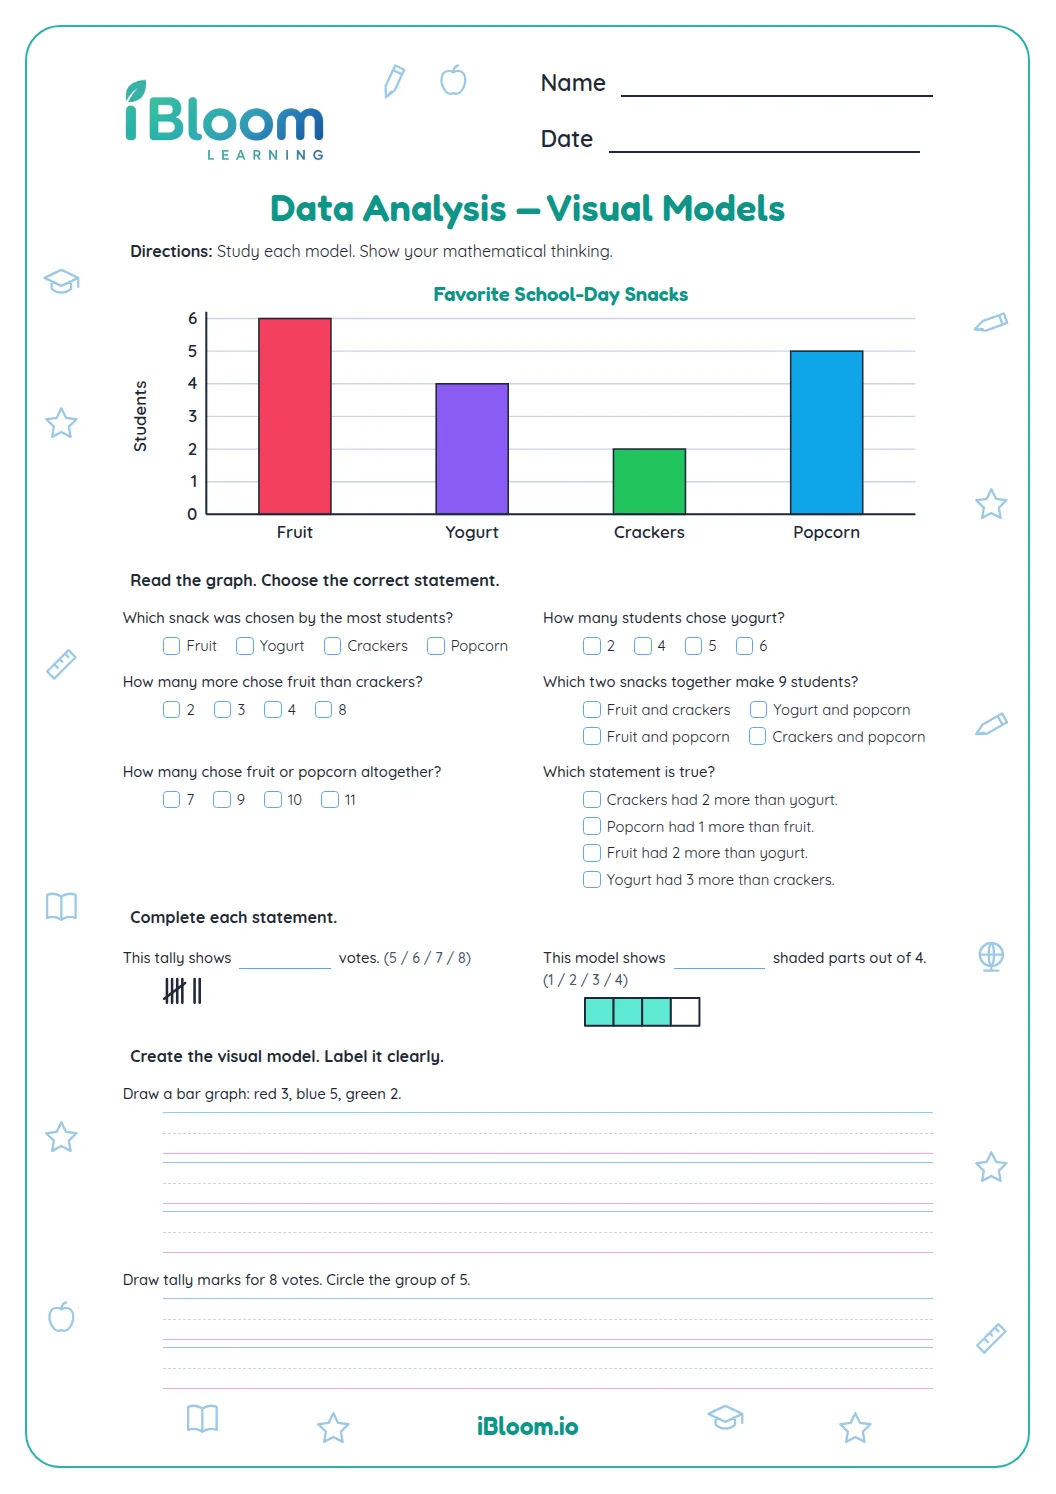
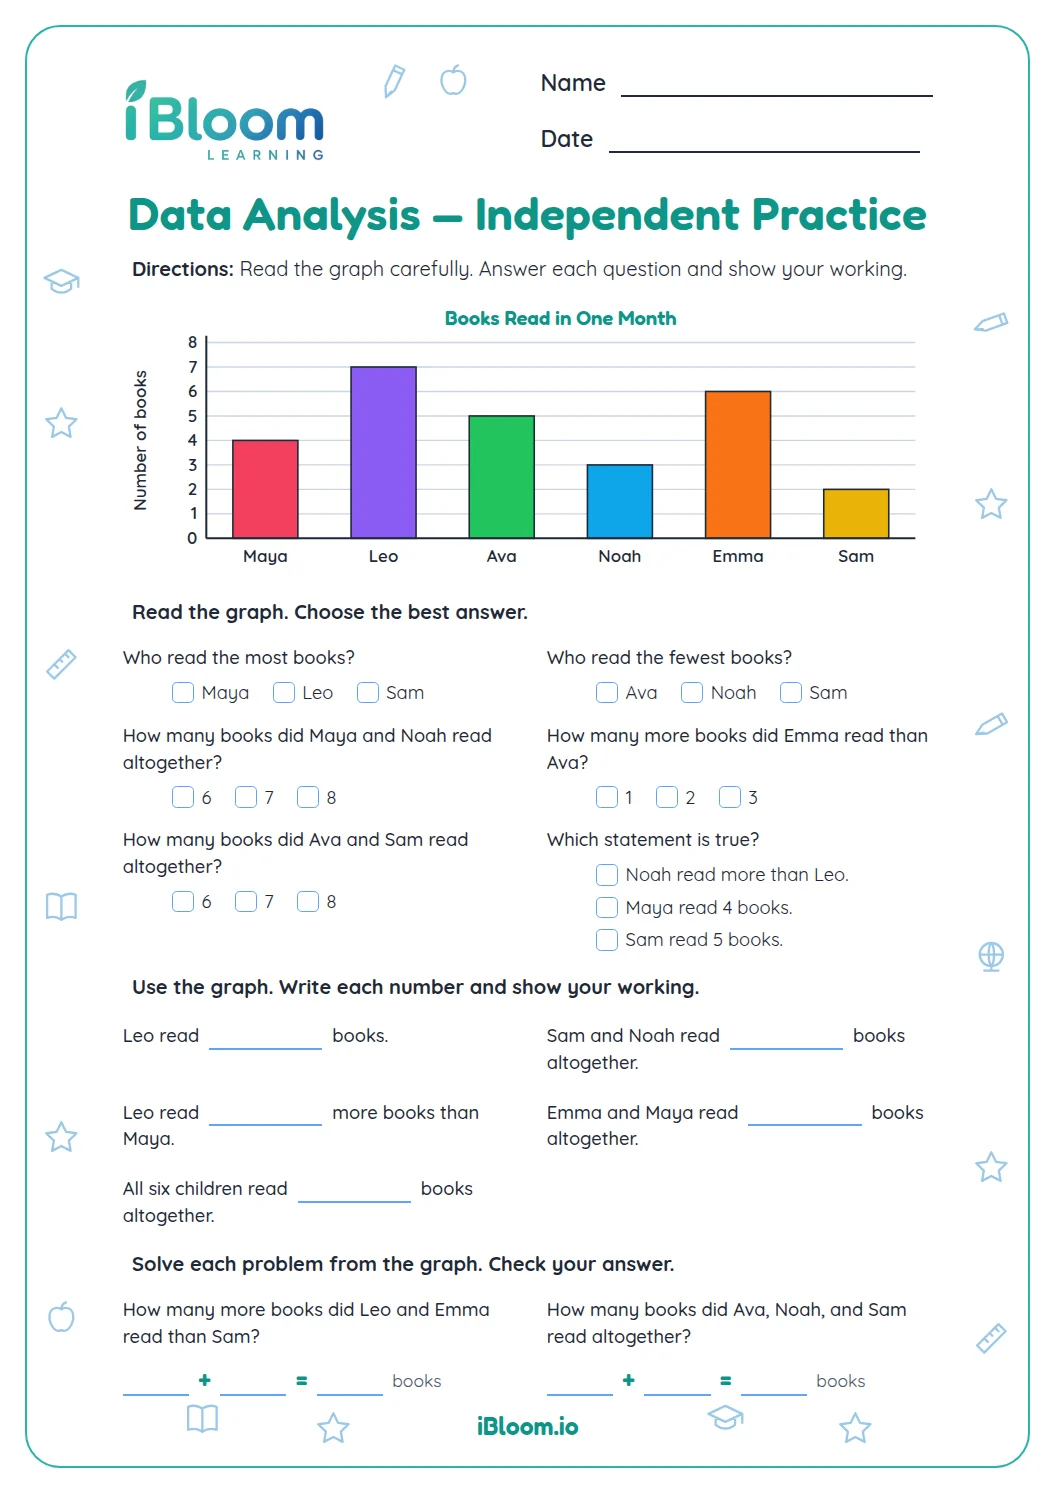
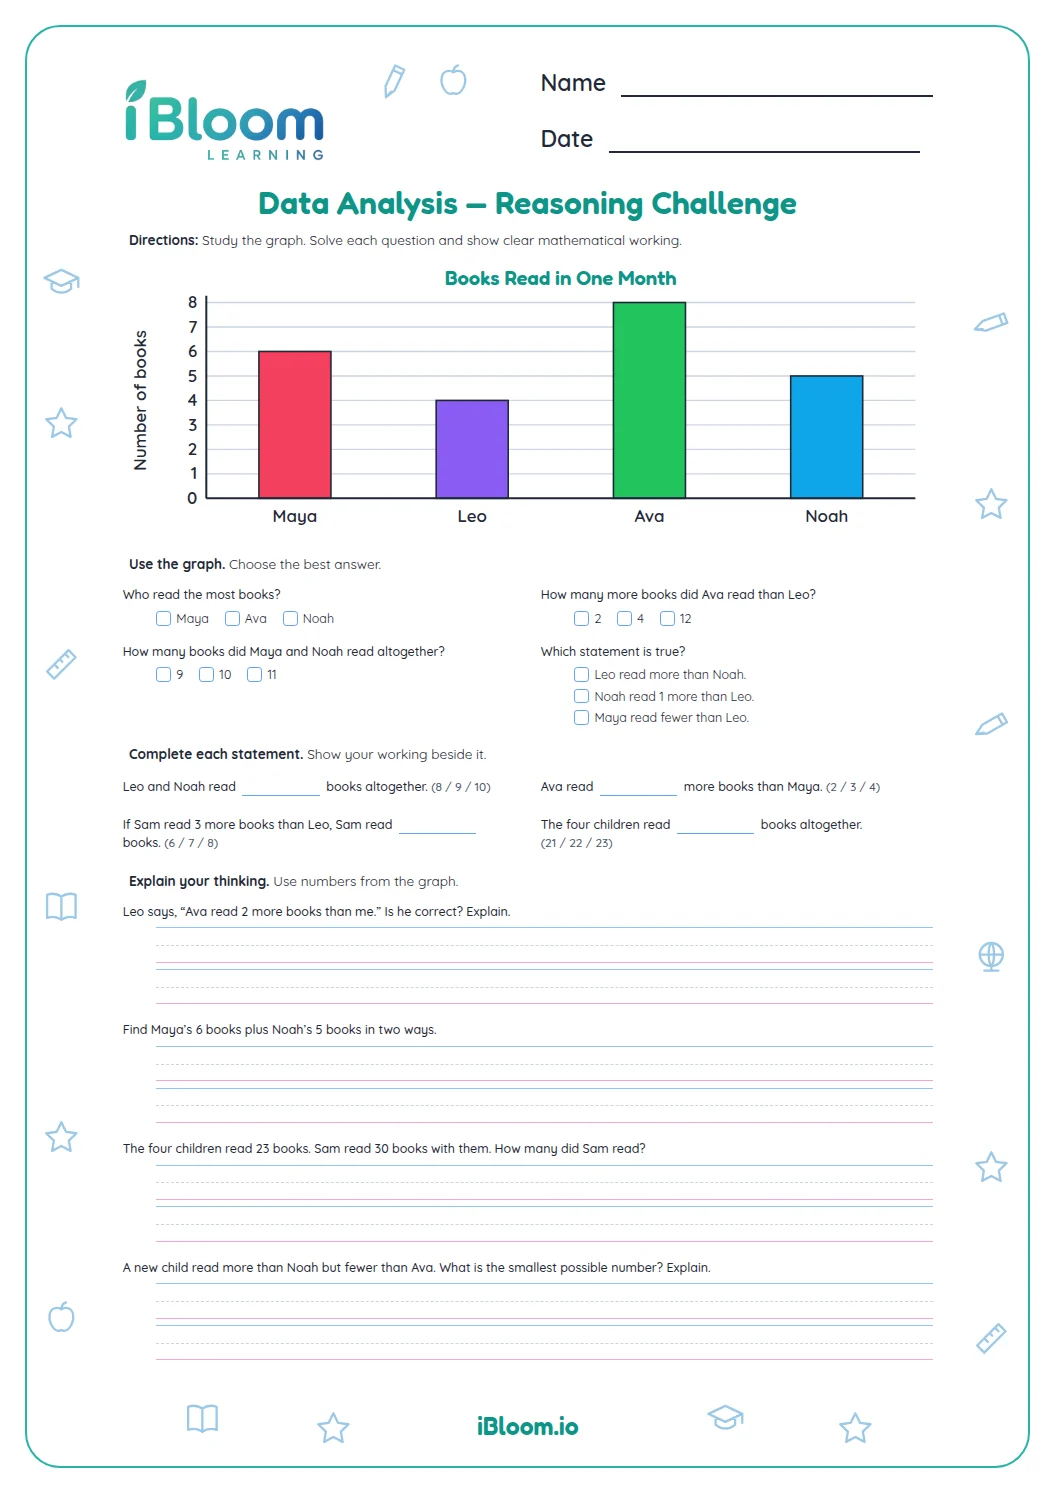
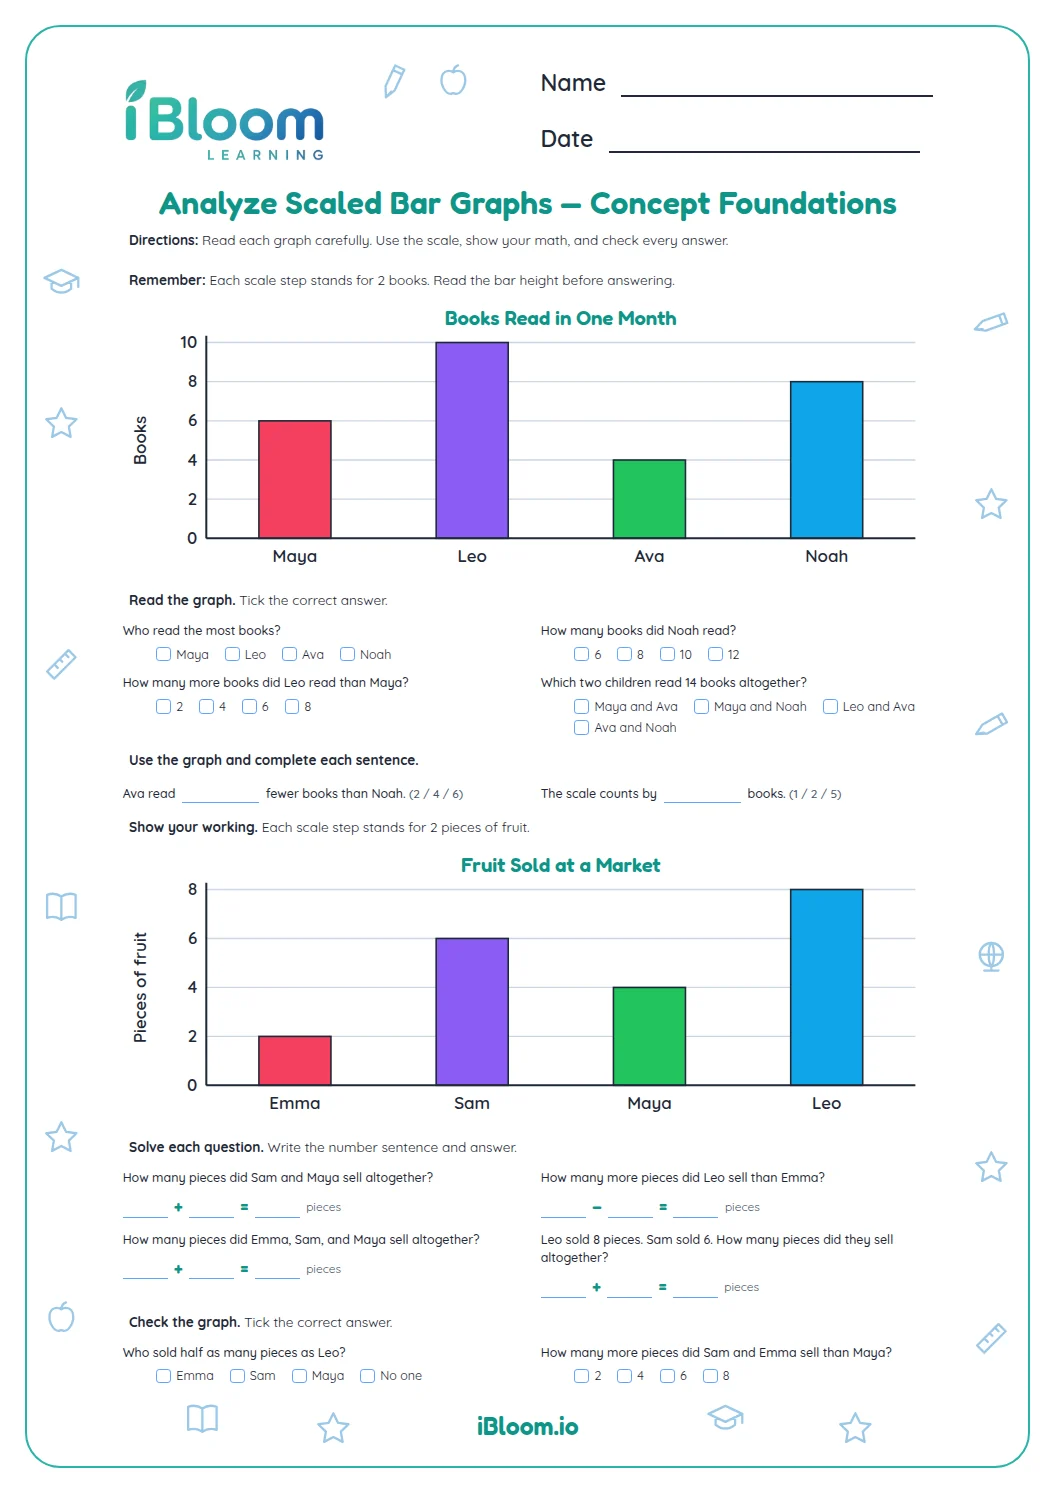
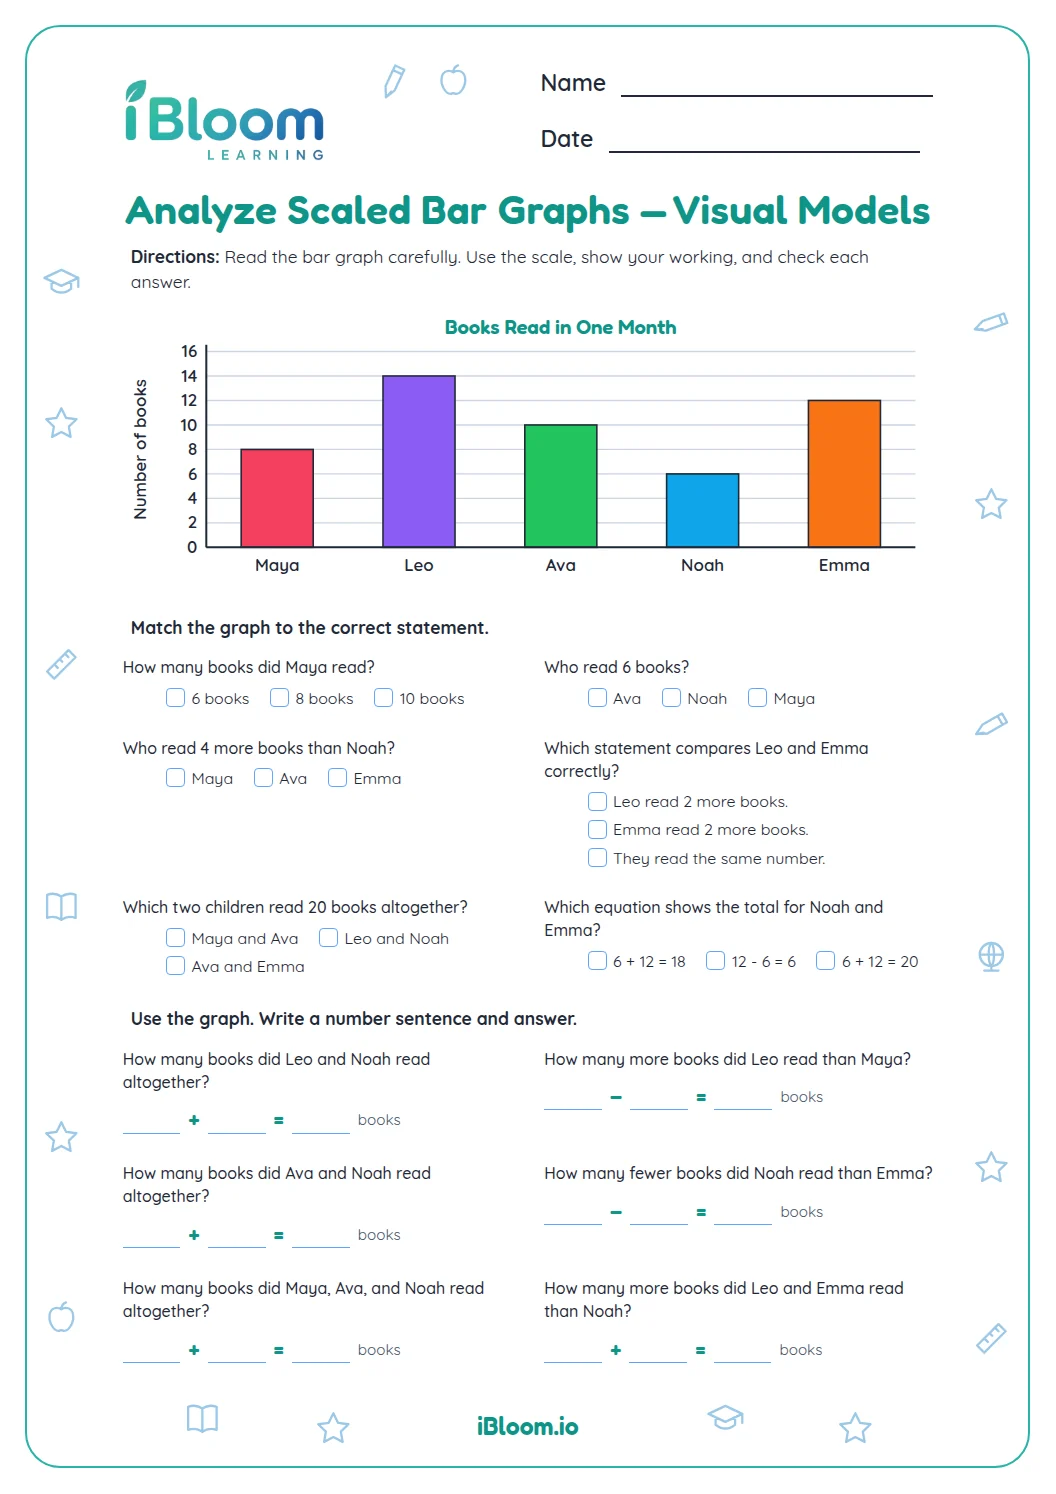
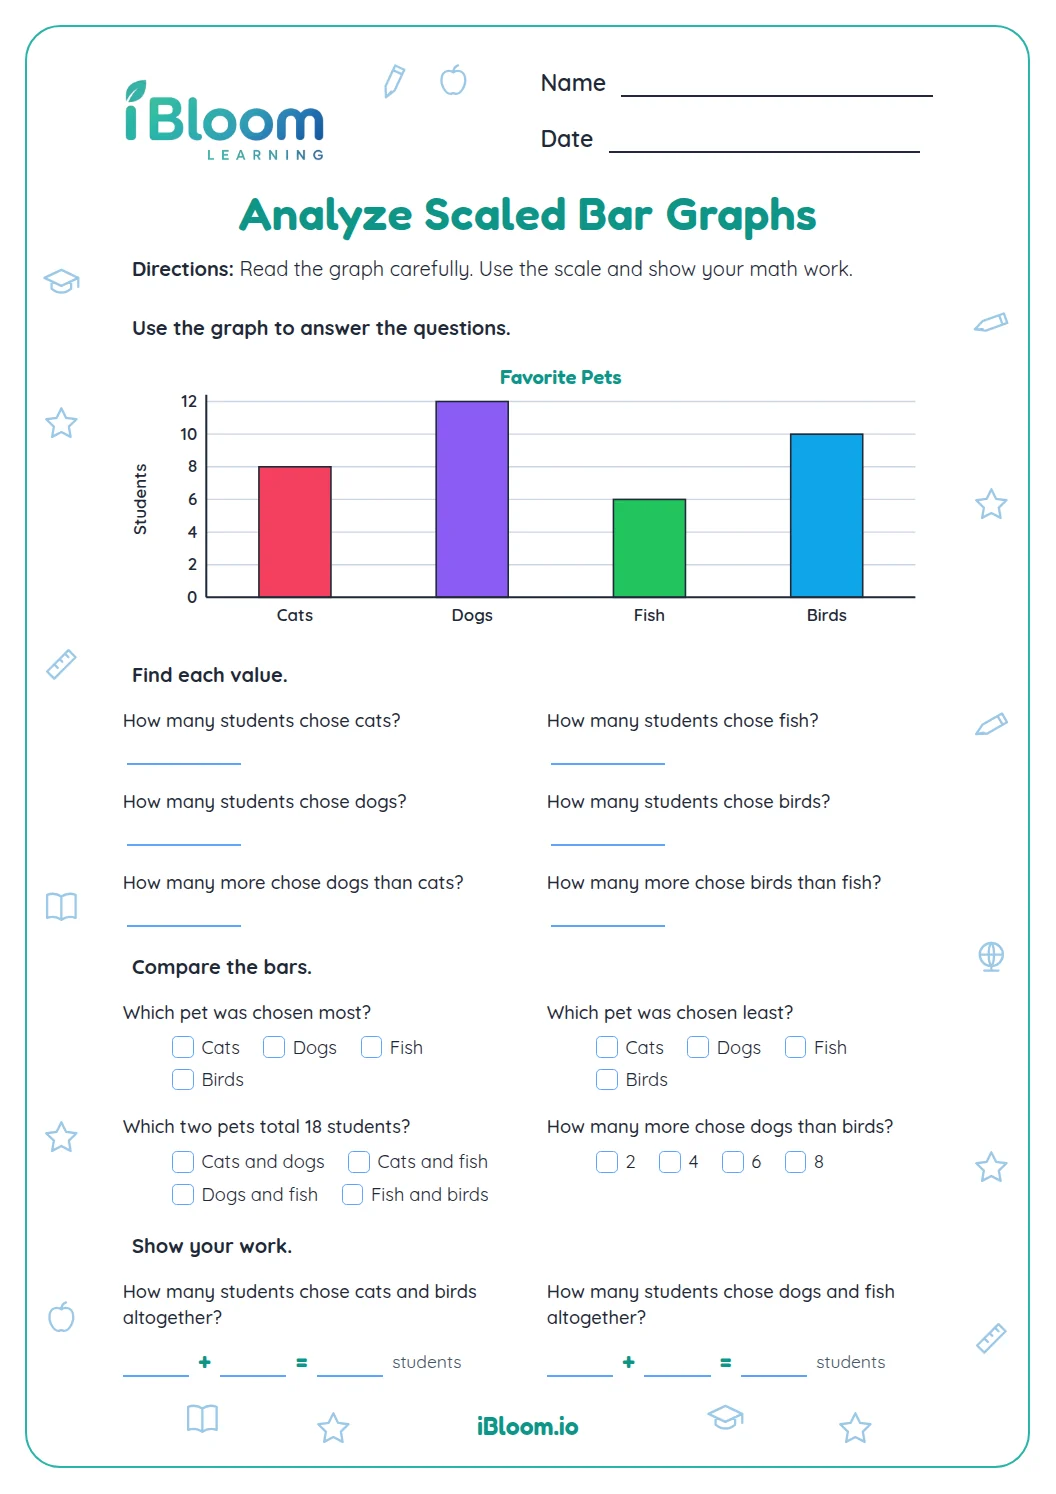
This Grade 3 worksheet uses a fruit-sales picture graph with a key of one piece per picture. Students read category values, compare sales, combine amounts, and answer one- and two-step questions. The practice aligns with CCSS 3.MD.B.3.
Aligned to 3.MD.B.3
How do you read the picture-graph key?
Each picture stands for 1 piece of fruit. Count the symbols in the named row to find its total; the key tells what one symbol means.
- 1Grapes: 4 pictures, or 4 pieces
- 2Apples: 2 pictures, or 2 pieces
- 34 − 2 = 2 more grapes
How do you compare categories?
Read both category counts, then subtract the smaller from the larger. Question 6 compares 4 grape sales with 1 orange sale, so 3 more grapes were sold.
How do you answer two-step questions?
For a total, add the values named. In a two-step question, complete the addition or comparison first, then follow the next action in the prompt.
How to use this worksheet
- 1Read the picture-graph title and key.
- 2Count the symbols in each category named in the question.
- 3Add category counts for a total or subtract to compare them.
- 4For a two-step question, follow both actions in the order stated.
- 5Check that the answer matches the unit and categories in the prompt.
Common mistakes and quick fixes
The mistake
Counting each symbol as more or less than one piece.
The fix
Use the key: each picture stands for one piece of fruit.
The mistake
Subtracting the smaller count from the larger in the wrong order.
The fix
Start with the greater count when finding how many more.
The mistake
Adding one category twice when finding a total.
The fix
Name each requested category once, then combine the counts.
Common Core alignment
This worksheet practices interpreting a scaled picture graph and solving comparison questions from its data.
Interpret a scaled picture graph to solve comparison and total questions.
On this sheet: Students read a scaled picture graph and solve comparison and total questions from its category values.
Show the official wordingHide the official wording
Draw a scaled picture graph and a scaled bar graph to represent a data set with several categories. Solve one- and two-step “how many more” and “how many less” problems using information presented in scaled bar graphs. For example, draw a bar graph in which each square in the bar graph might represent 5 pets.
What to practice next
Make more practice
Further reading
Questions parents and teachers ask
What does each picture in the graph represent?
Each picture represents 1 piece of fruit. The graph has 4 grape pictures and 2 apple pictures, so those rows represent 4 and 2 sales. Check the key before counting pictures so each symbol is given the correct value.
How many more grapes than apples were sold?
The graph shows 4 grapes and 2 apples. Subtract 2 from 4 to find a difference of 2 pieces. Question 4 asks for this comparison, and the same read-then-subtract method works for the other “how many more” questions. Check the symbol key and category labels before recording the result.
How do students find a total from the graph?
Count the pictures in each category named in the question, then add those values. For apples and oranges, the graph shows 2 and 1, so the total is 3 pieces. For all fruit, add every category once. Check the symbol key and category labels before recording the result.
How many questions are on the worksheet?
The worksheet contains 14 multiple-choice questions based on one fruit-sales picture graph. They include reading values, comparing categories, finding totals, and solving two-step prompts. A separate two-page answer key lists the correct choice for each question. Check the picture key before counting.
Which graph skill does this worksheet practice?
The page aligns with CCSS 3.MD.B.3. Students interpret a scaled picture graph and use its category values to solve comparison and total questions. The key assigns one piece of fruit to each symbol, so reading the key is part of each problem.