

About this worksheet
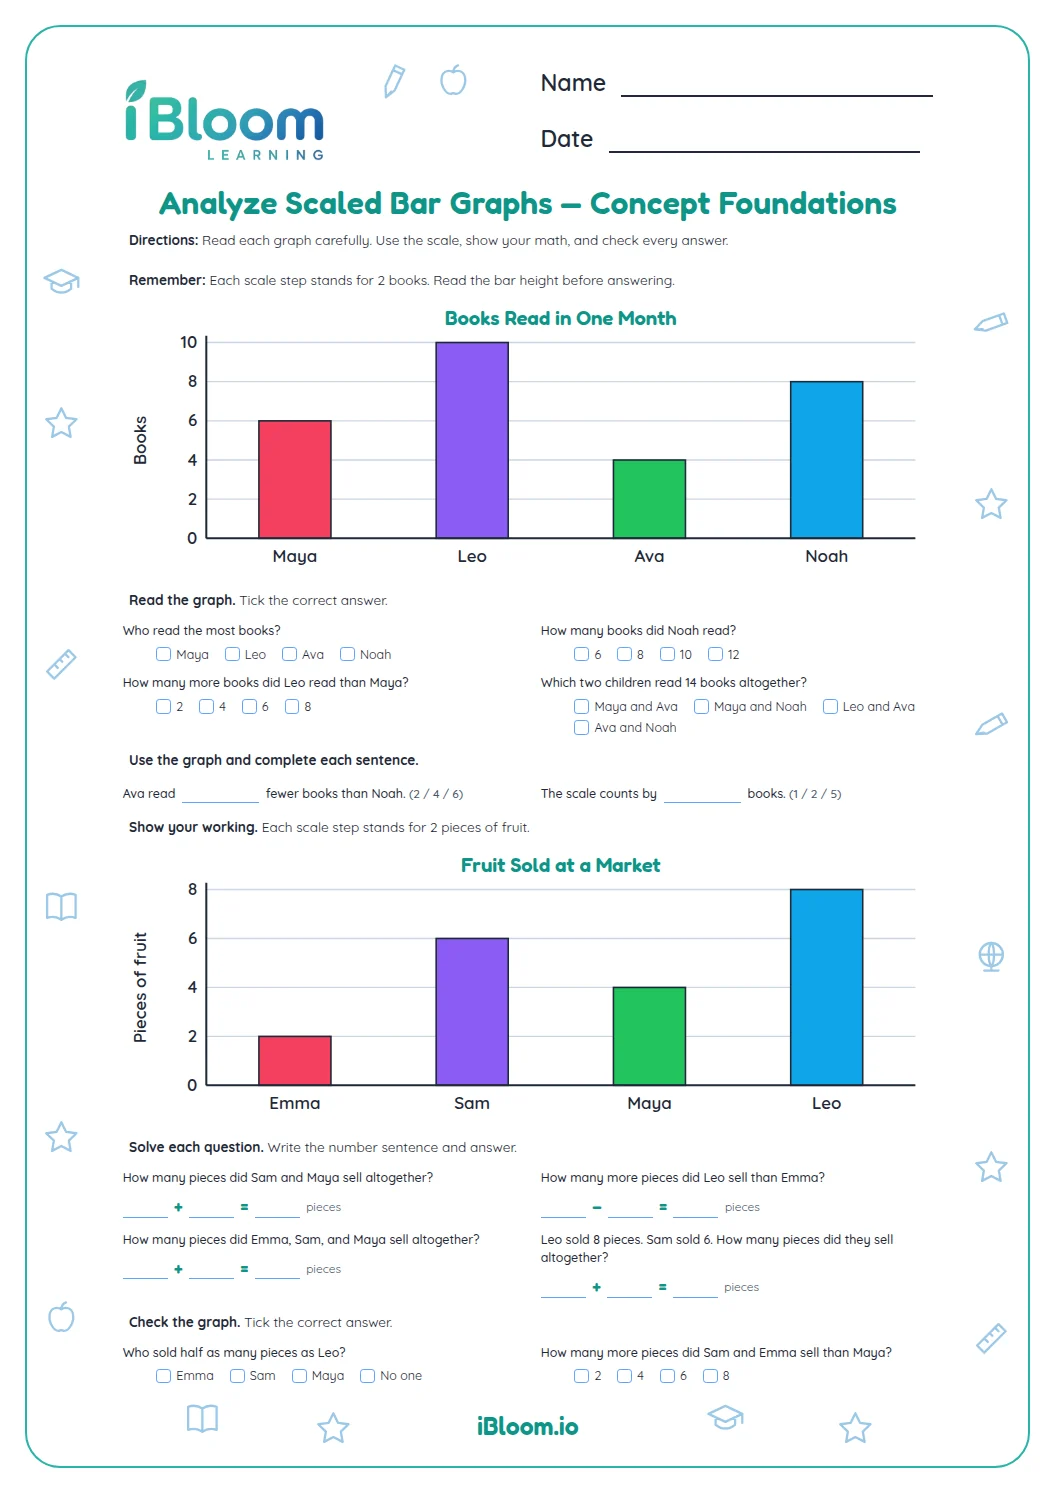
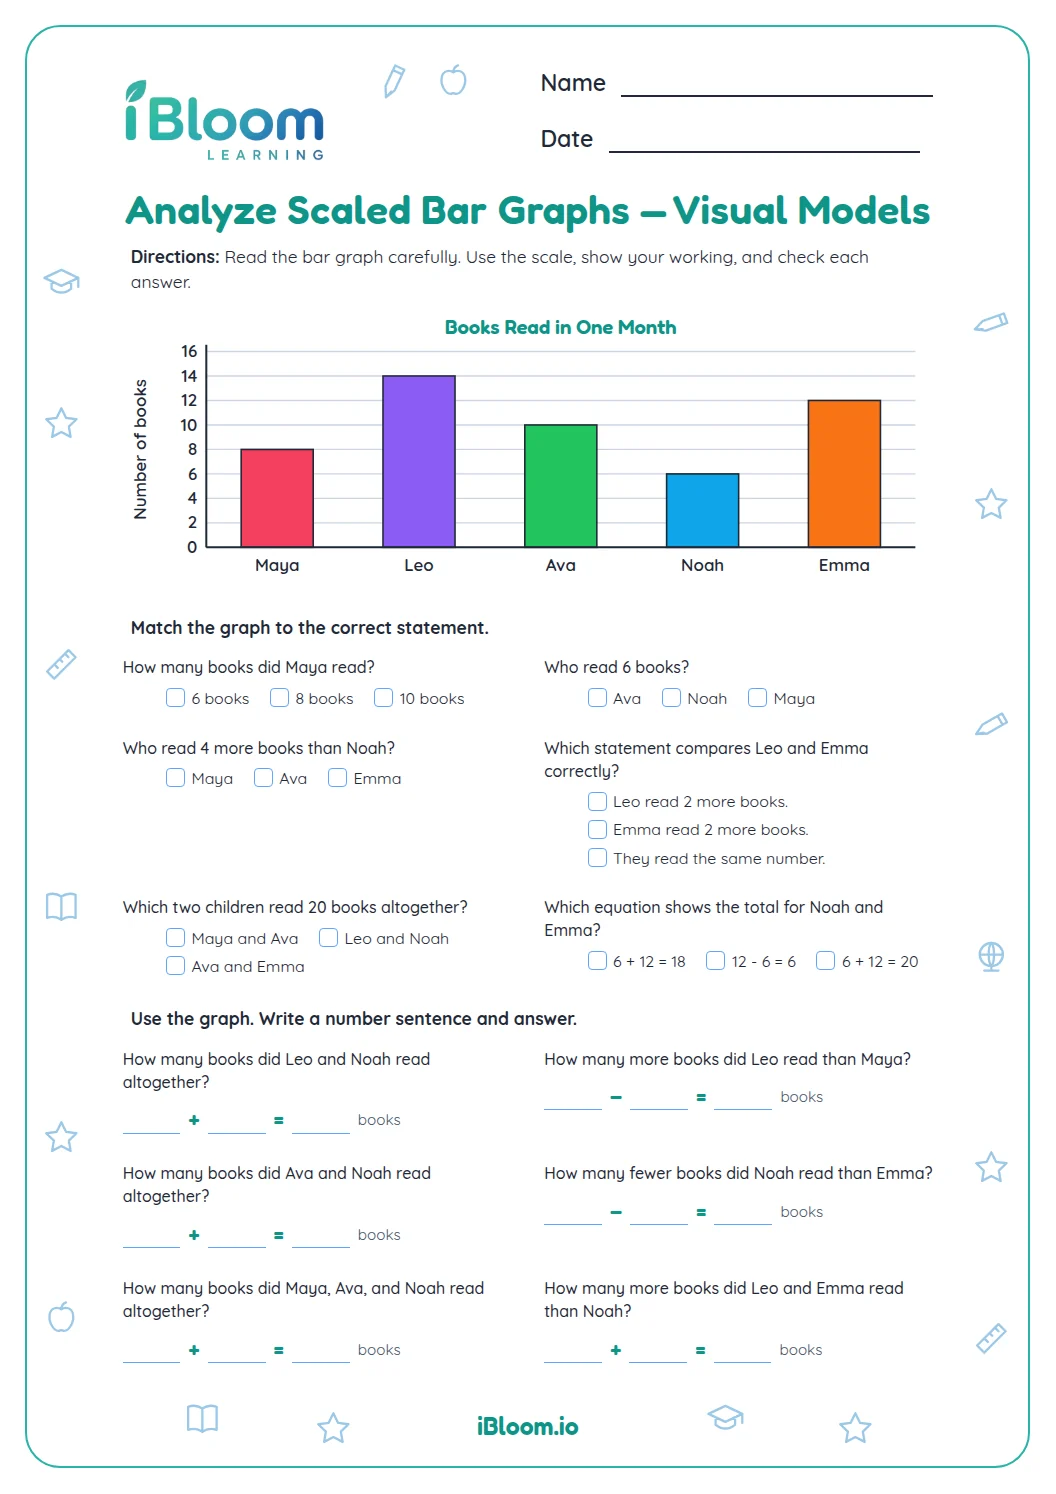
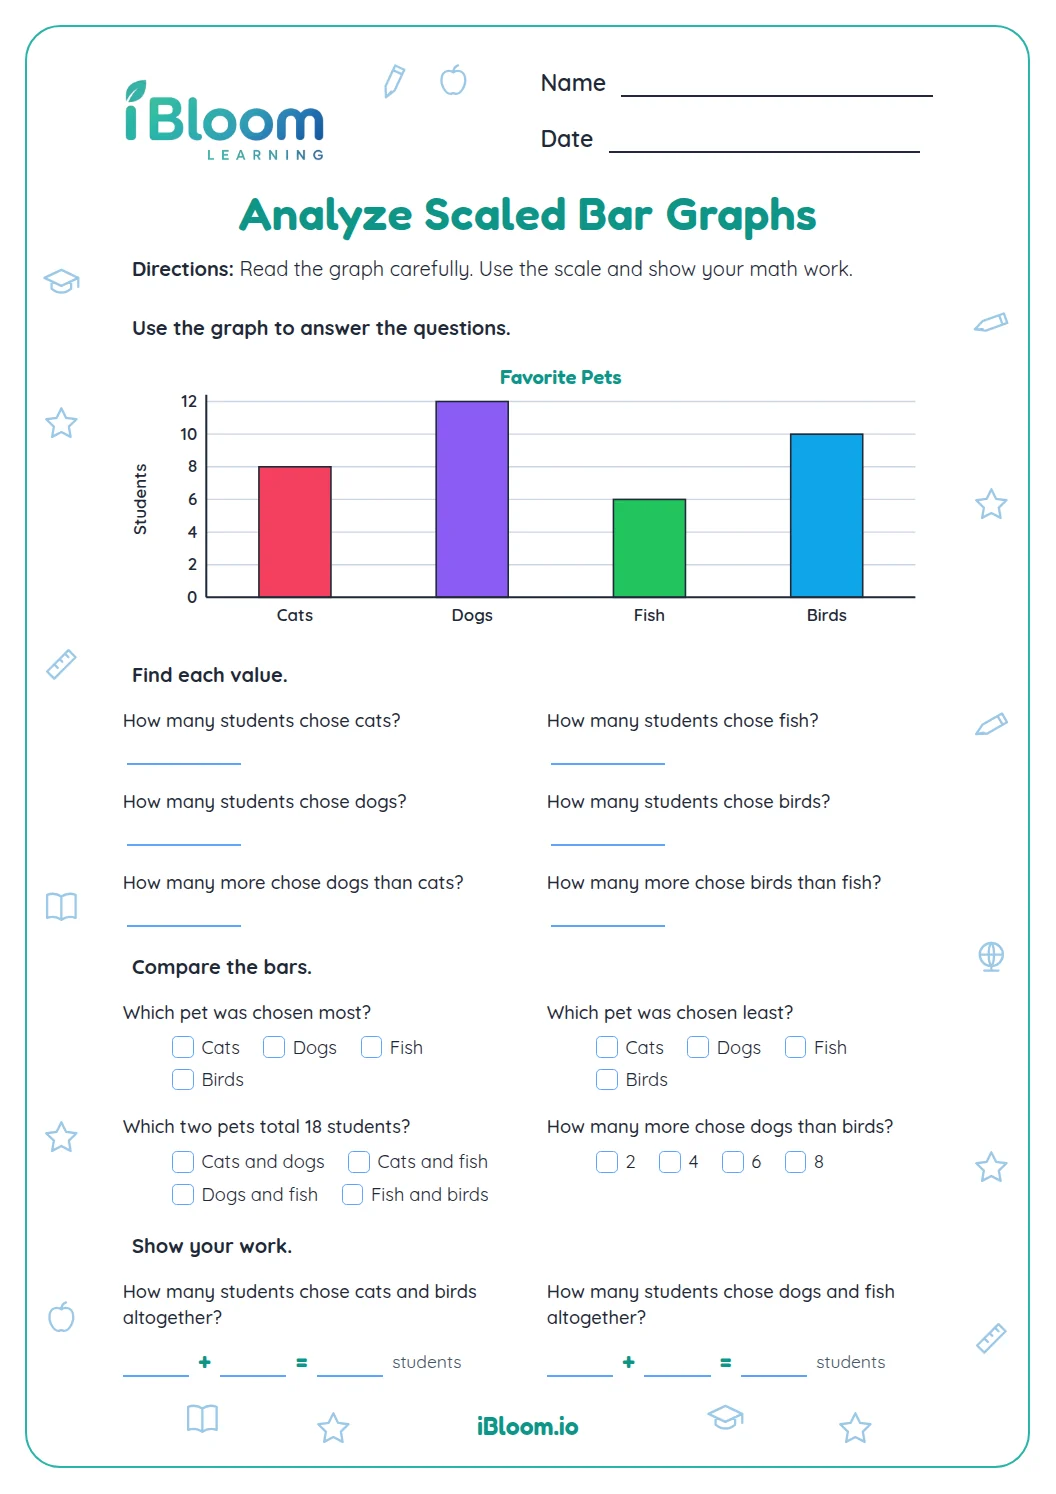
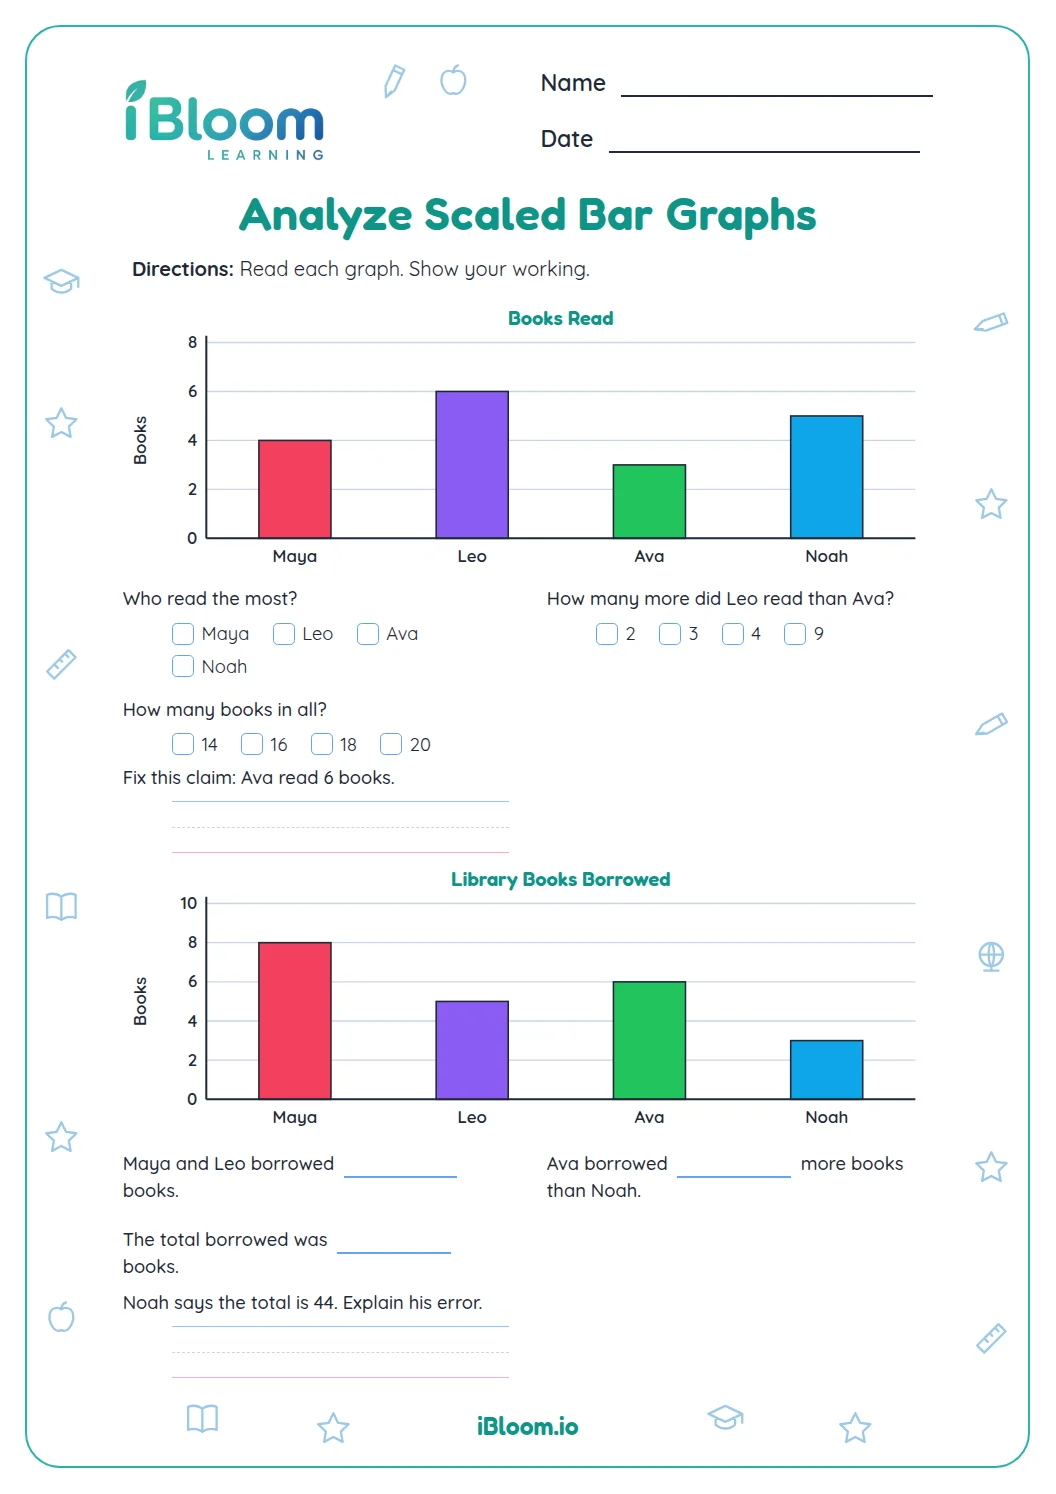
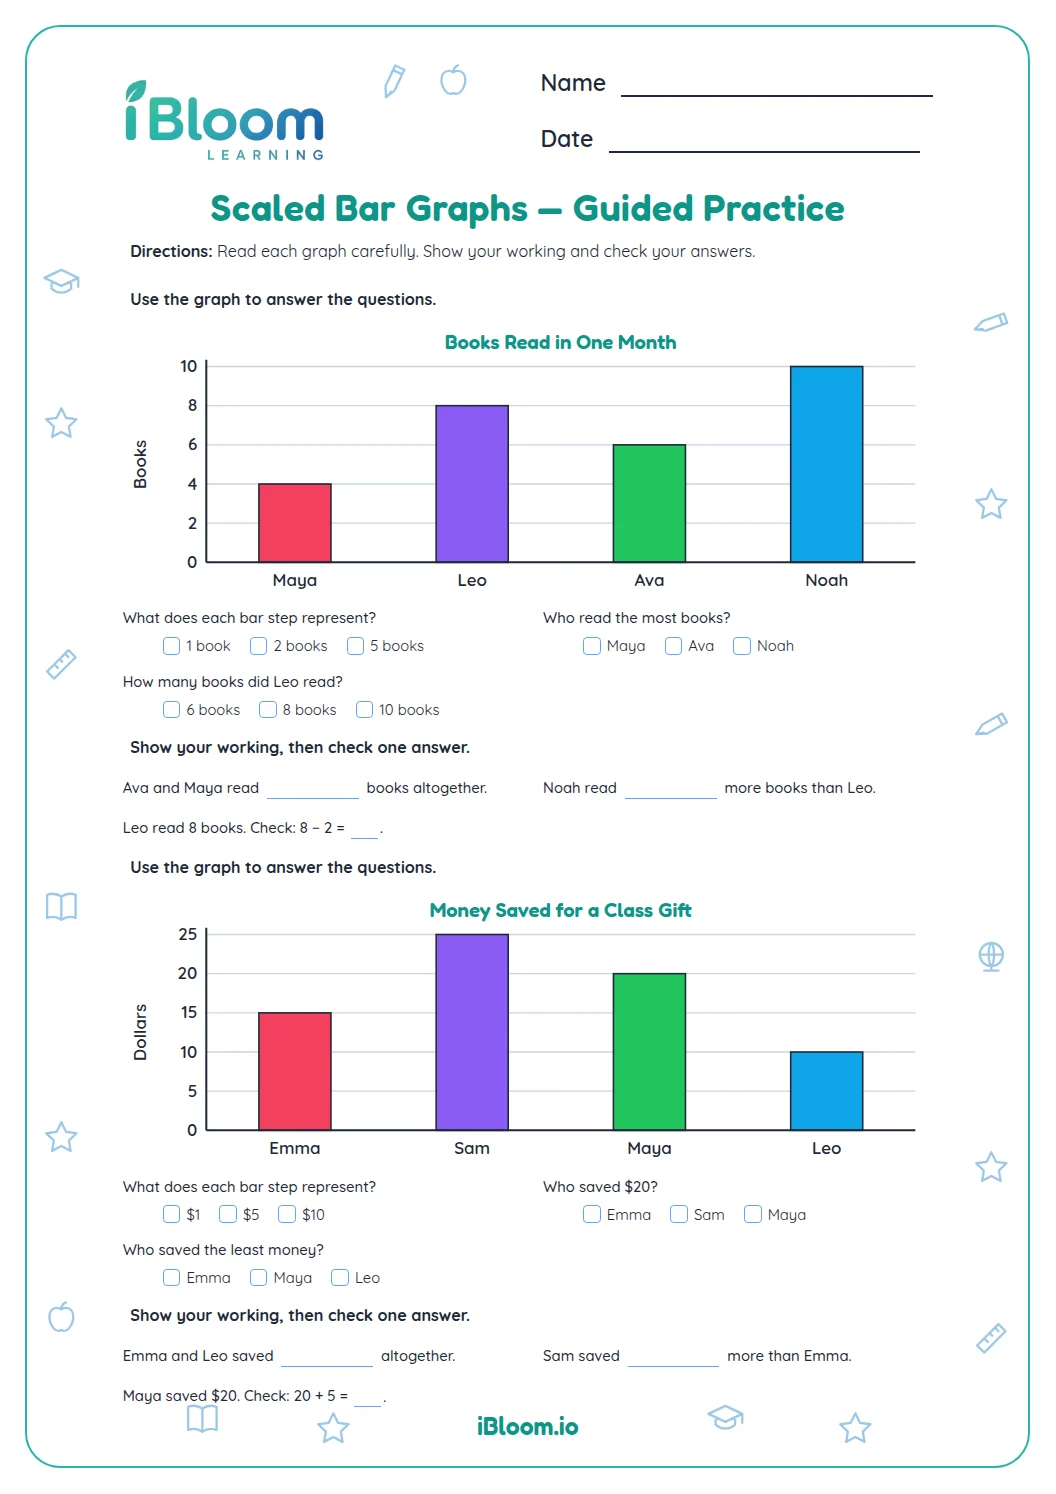
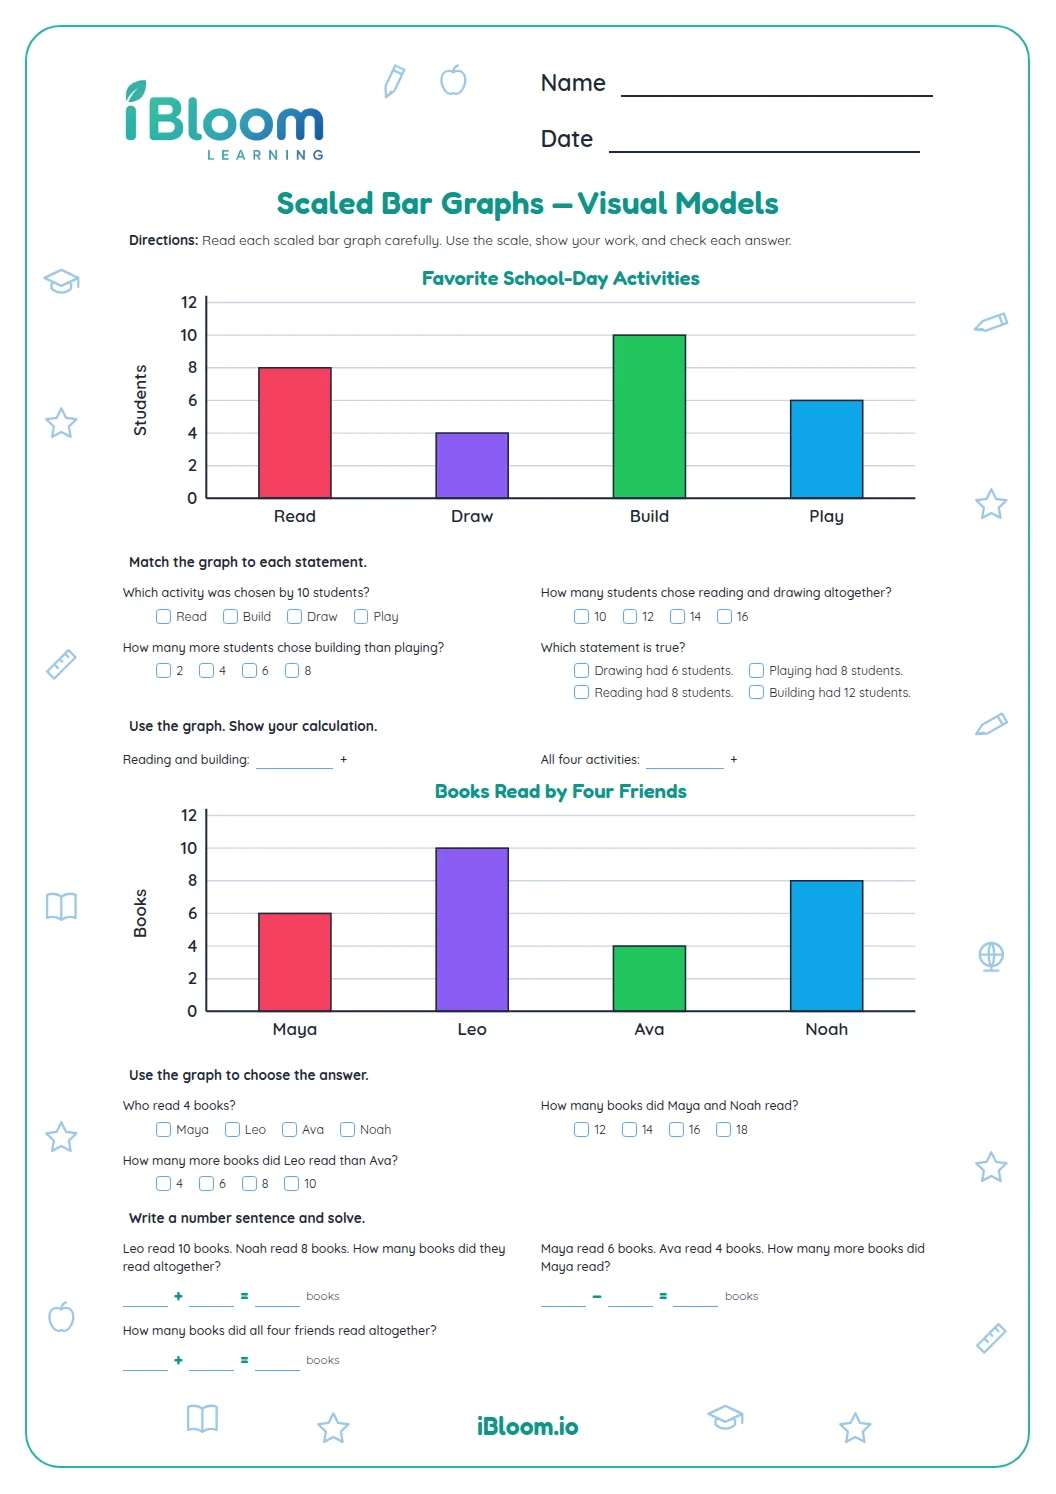
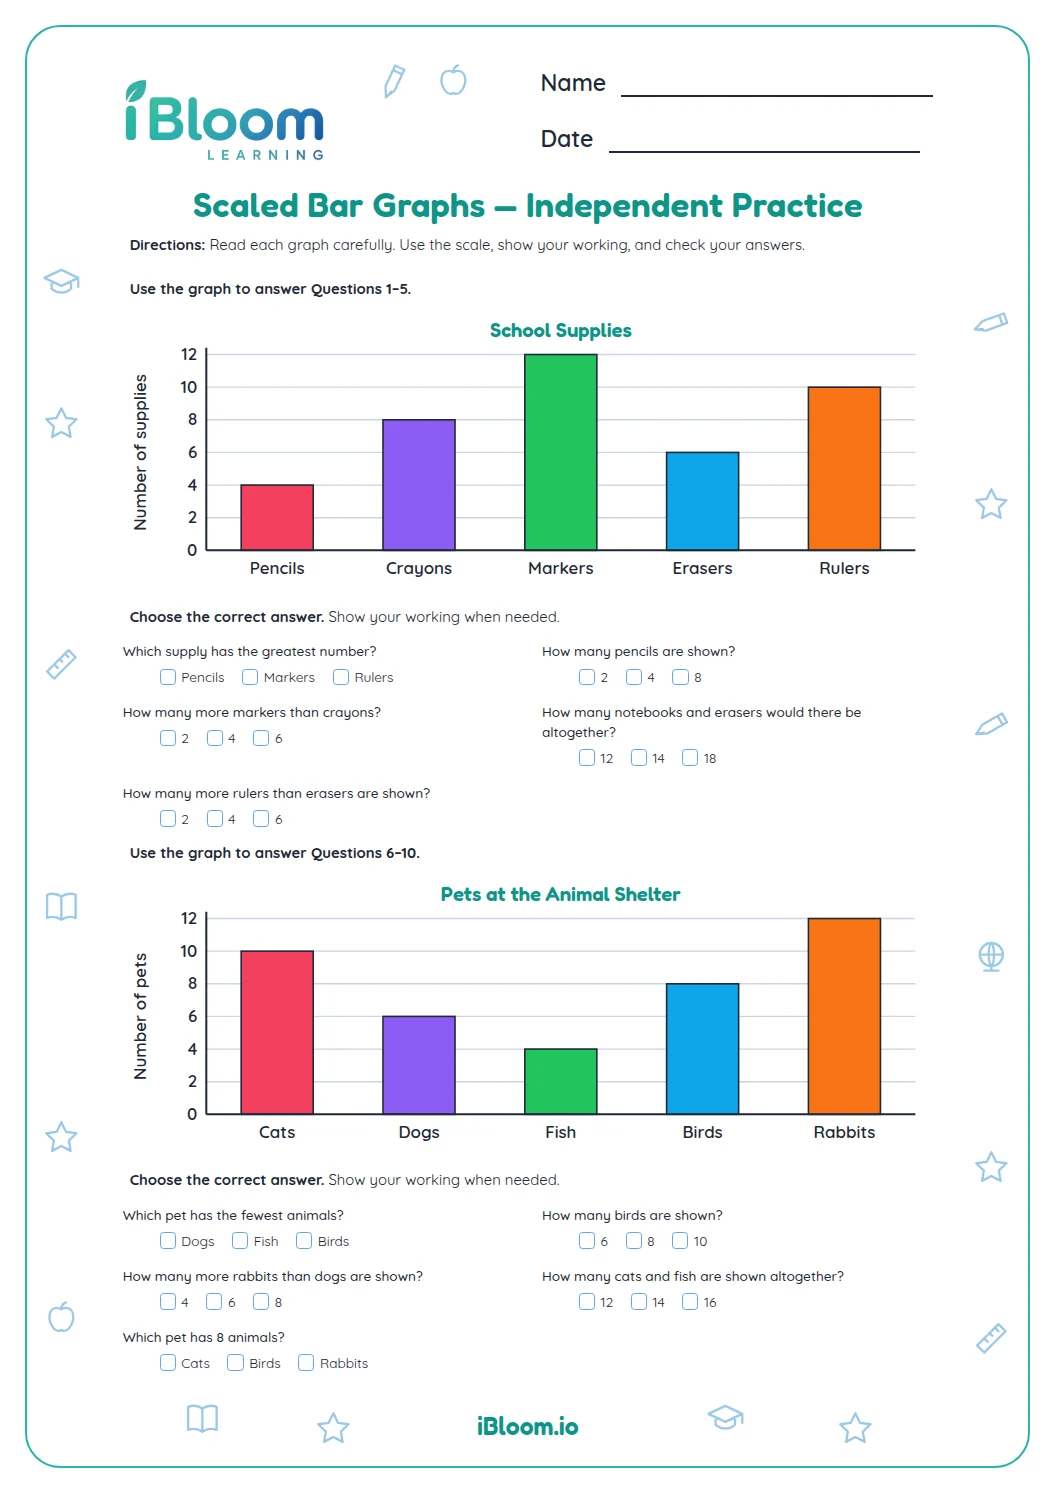
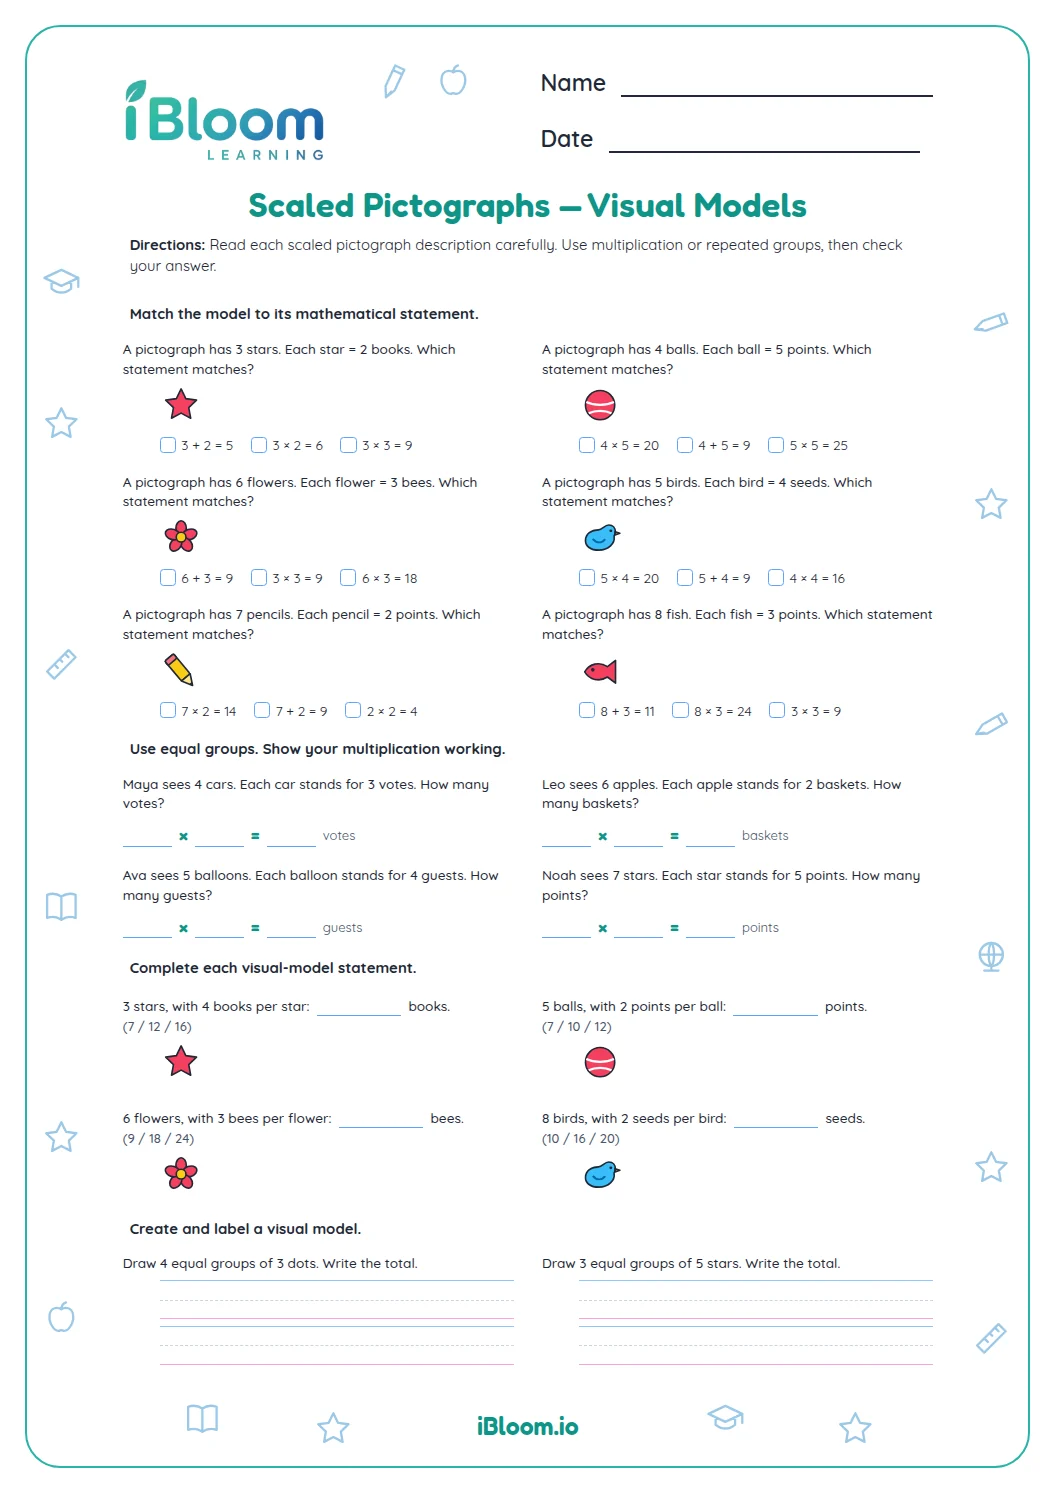
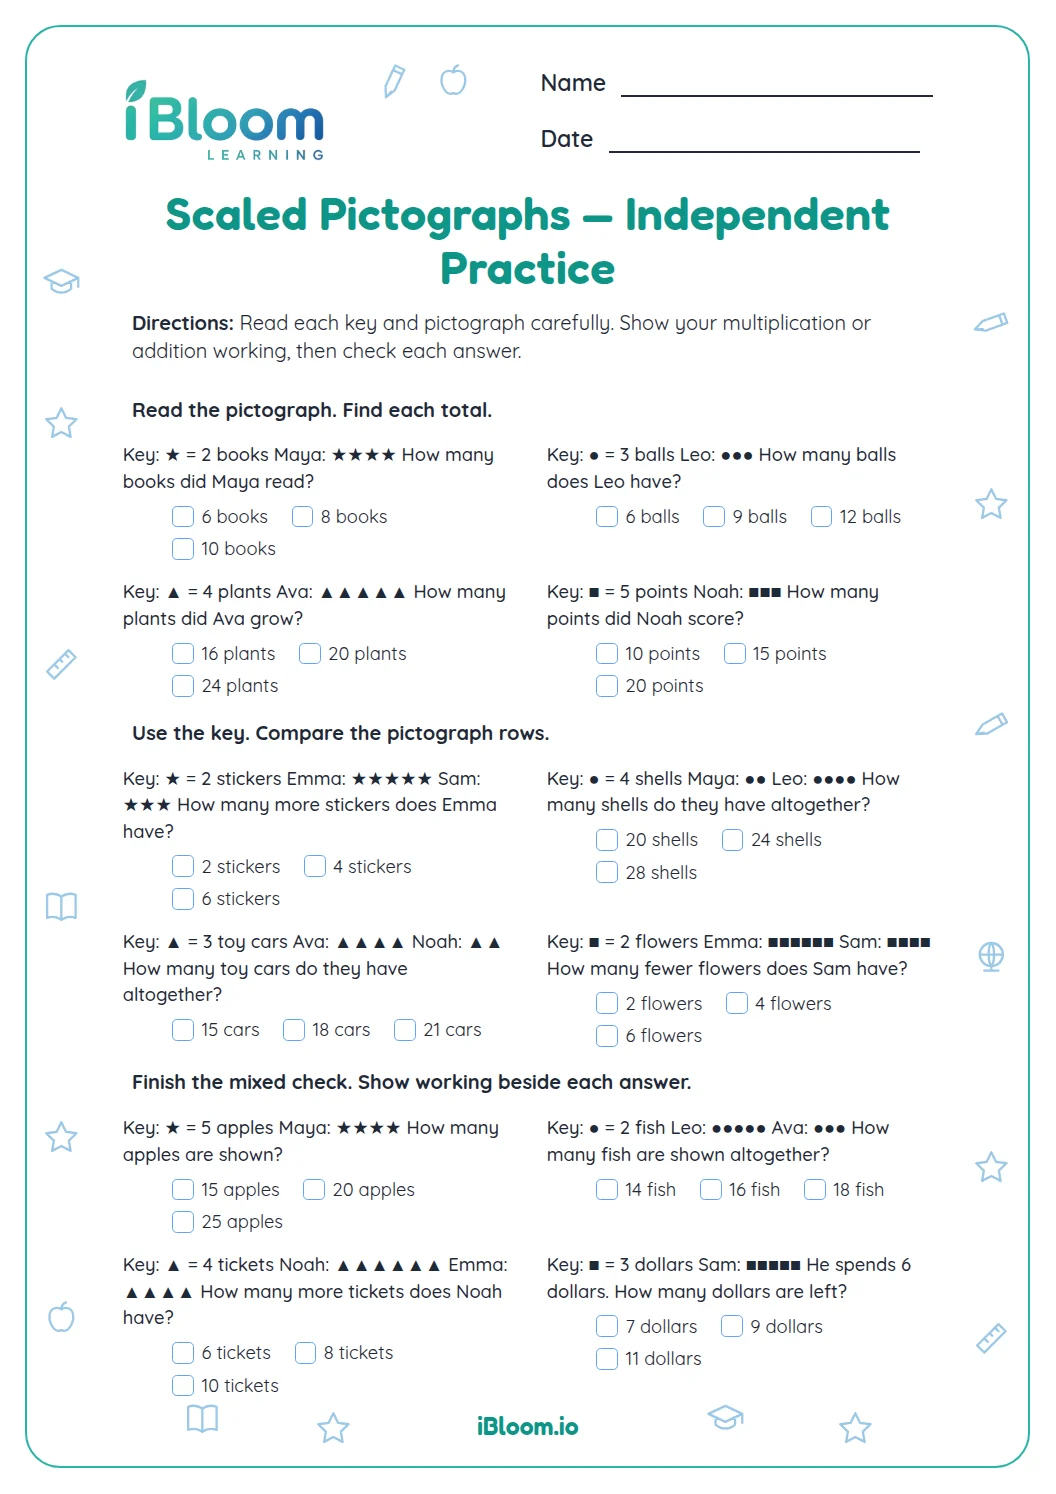
This Grade 3 worksheet helps children read a scaled bar graph and use its values to compare categories and find totals. The books-borrowed graph shows Monday through Thursday, with each grid step representing five books. Across 14 questions, students identify bar values, compare days, and combine values. The graph appears at the start of each part so students can refer to it as they work. A separate answer key is included. The sheet aligns with CCSS 3.MD.B.3.
Aligned to 3.MD.B.3
What does each graph step represent?
The axis names the unit and the scale shows how much each grid step counts. Here, each step is 5 books. Tuesday reaches 20, or four steps of five.
- 1Tuesday: 20 books; Thursday: 5 books
- 220 − 5 = 15
- 3Tuesday has 15 more books.
How do you compare or combine bars?
Read both bar values first. For “how many more,” subtract the smaller value from the larger; for a total, add the values. Do not use the number of steps as the number of books.
- Part A: read individual bars and compare categories
- Part B: find totals and compare more values from the same graph
How can you check a graph answer?
Locate each bar again and count by fives from the labeled axis. For a total, add the values you read; for a comparison, subtract and make sure the result describes the direction asked.
How to use this worksheet
- 1Read the graph title and axis label.
- 2Notice that one grid step represents five books.
- 3Find each named bar and count its value.
- 4Add values for “together” questions.
- 5Subtract the smaller value for “how many more” questions.
- 6Check the choice against the graph and the key.
Common mistakes and quick fixes
The mistake
Counting each grid step as one book.
The fix
Use the scale and count by fives.
The mistake
Subtracting before reading both bars.
The fix
Find both values, then subtract smaller from larger.
The mistake
Adding the steps instead of the quantities.
The fix
Convert each bar height into books before adding.
Common Core alignment
Children read a scaled bar graph and solve comparison and total questions.
Read a scaled bar graph and solve one- and two-step comparison questions.
On this sheet: Every question reads the scale and answers a total or comparison using bar values.
Show the official wordingHide the official wording
Draw a scaled picture graph and a scaled bar graph to represent a data set with several categories. Solve one- and two-step “how many more” and “how many less” problems using information presented in scaled bar graphs. For example, draw a bar graph in which each square in the bar graph might represent 5 pets.
What to practice next
Make more practice
Further reading
Questions parents and teachers ask
What does each grid step represent?
Each grid step stands for 5 books. Read the axis as 5, 10, 15, and 20 as you count upward. Tuesday’s bar reaches 20, which is four steps. The scale applies to every category on the books-borrowed graph.
How many more books were borrowed Tuesday than Thursday?
Tuesday’s bar shows 20 books and Thursday’s shows 5. Subtract 5 from 20 to find 15 more books on Tuesday. First read both bars using the scale, then compare their values. The answer key includes this and the other graph results.
How many questions are on this worksheet?
There are 14 multiple-choice questions in two parts. They ask students to read individual bars, compare categories, and add values from the same four-day graph. The two parts each begin with the graph so it is available while students answer.
How should a child find a total from two bars?
Read each bar from the scale first, then add the values. Monday shows 10 books and Wednesday shows 15, so together they show 25 books. Adding only the number of grid steps would not give the quantity asked for.
What does the answer key include?
The separate key marks the correct choice for each graph question. To check an answer, return to the bar or bars named in the prompt and read them from the axis. Then repeat the addition or comparison to see whether the choice matches.