

About this worksheet
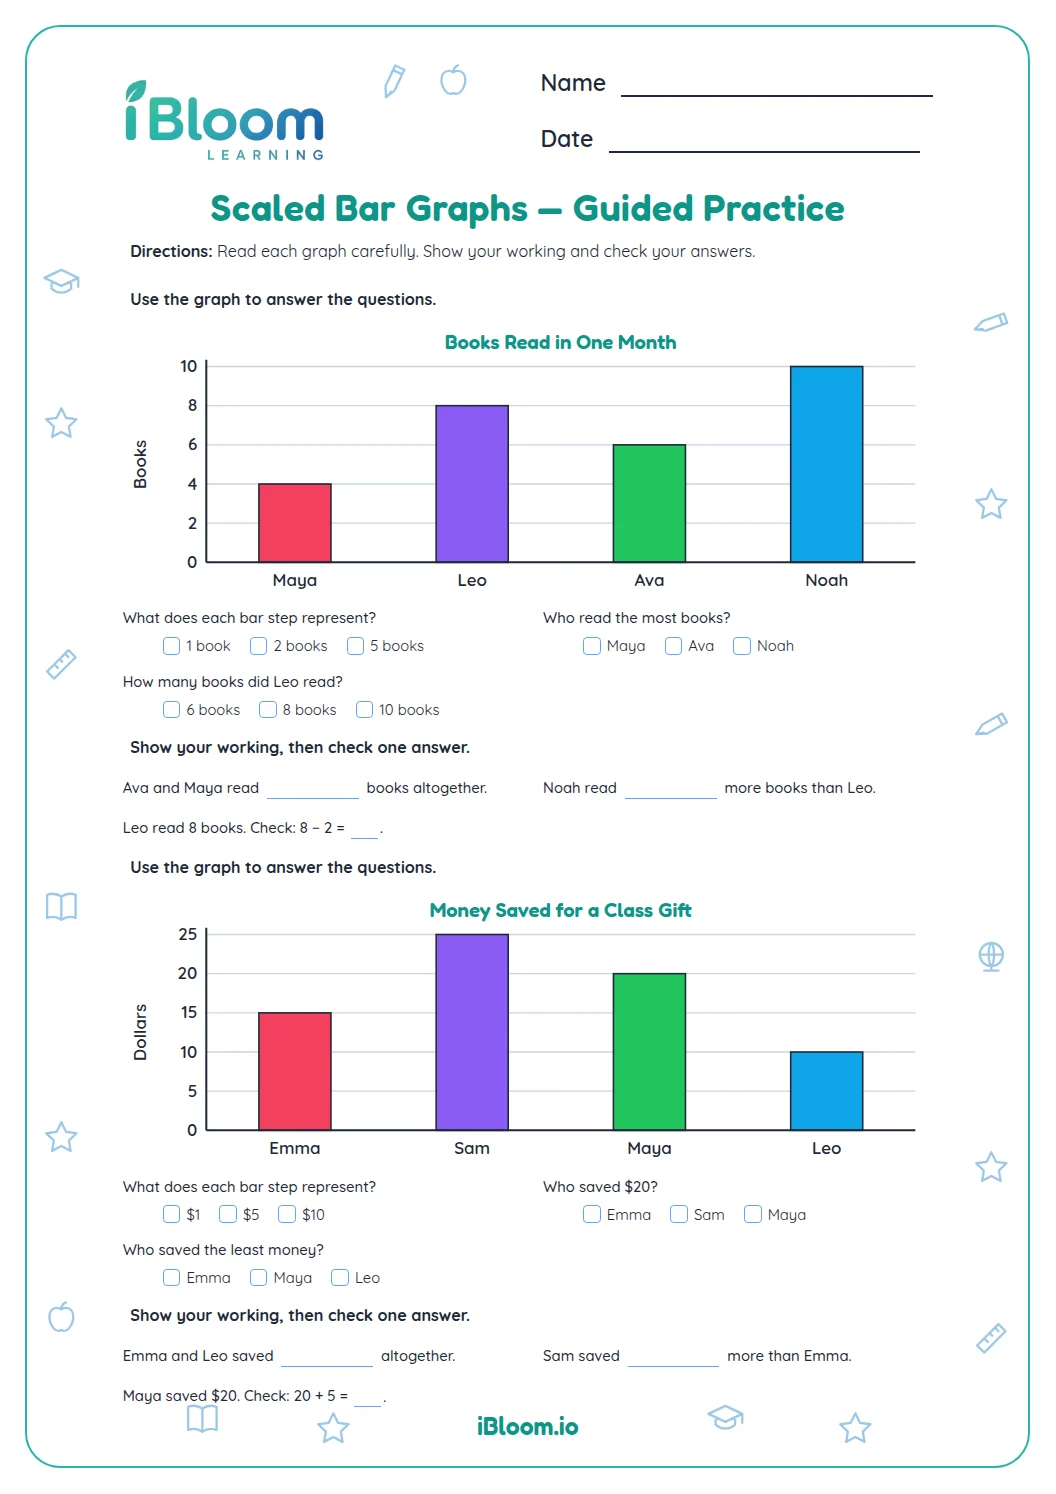
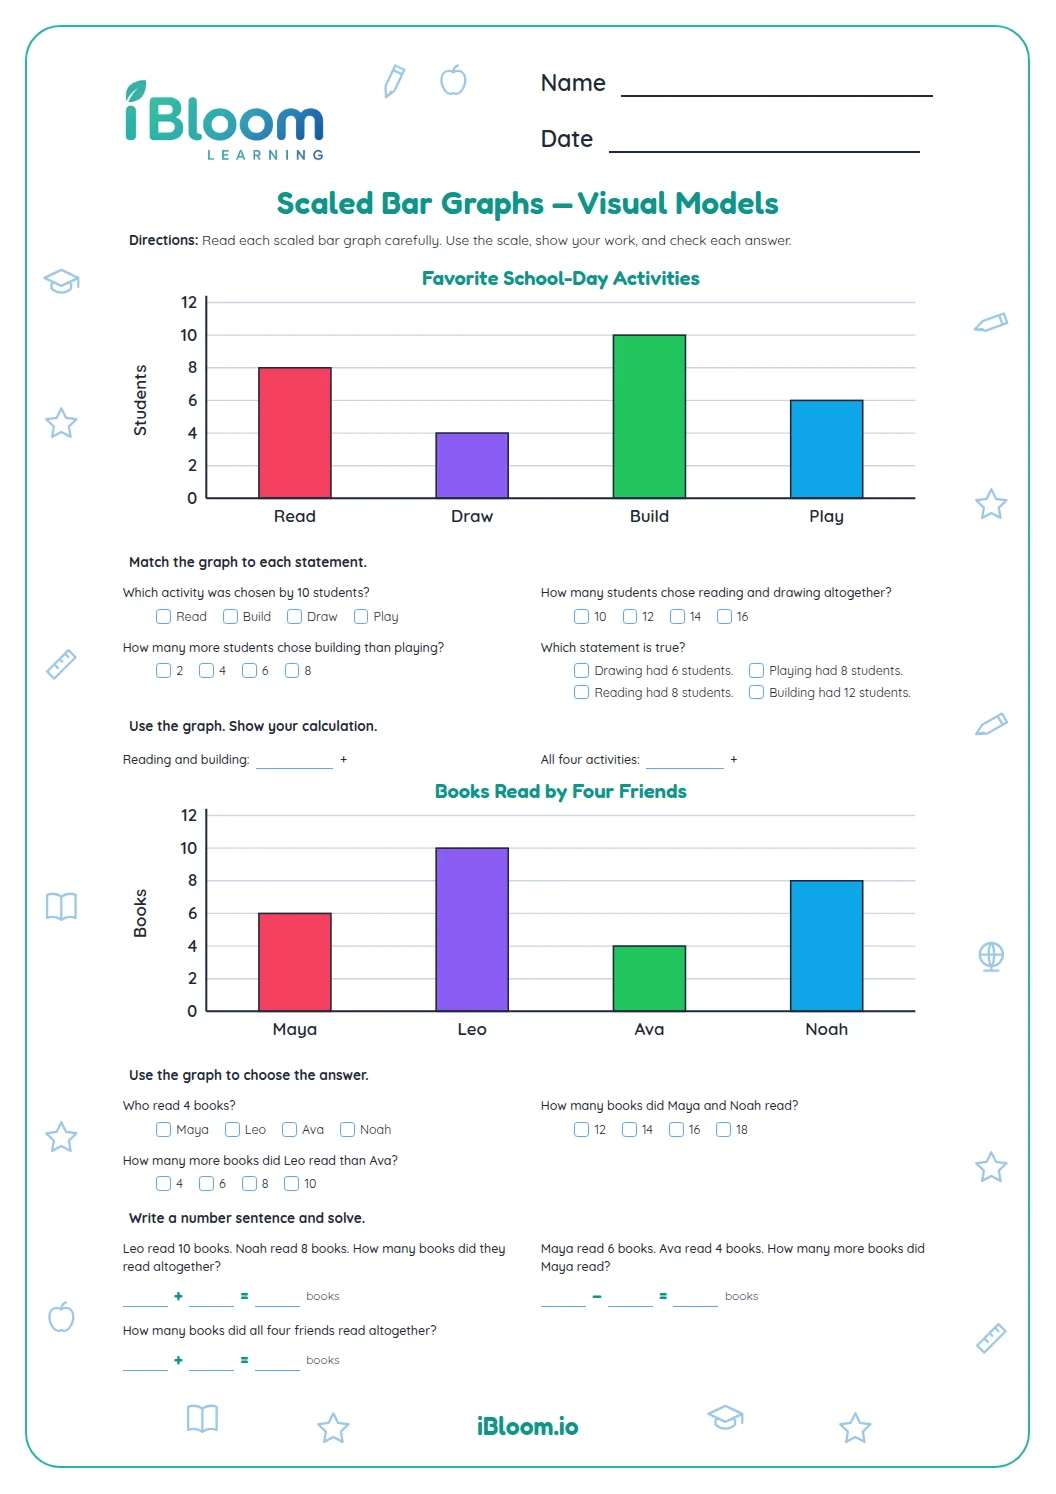
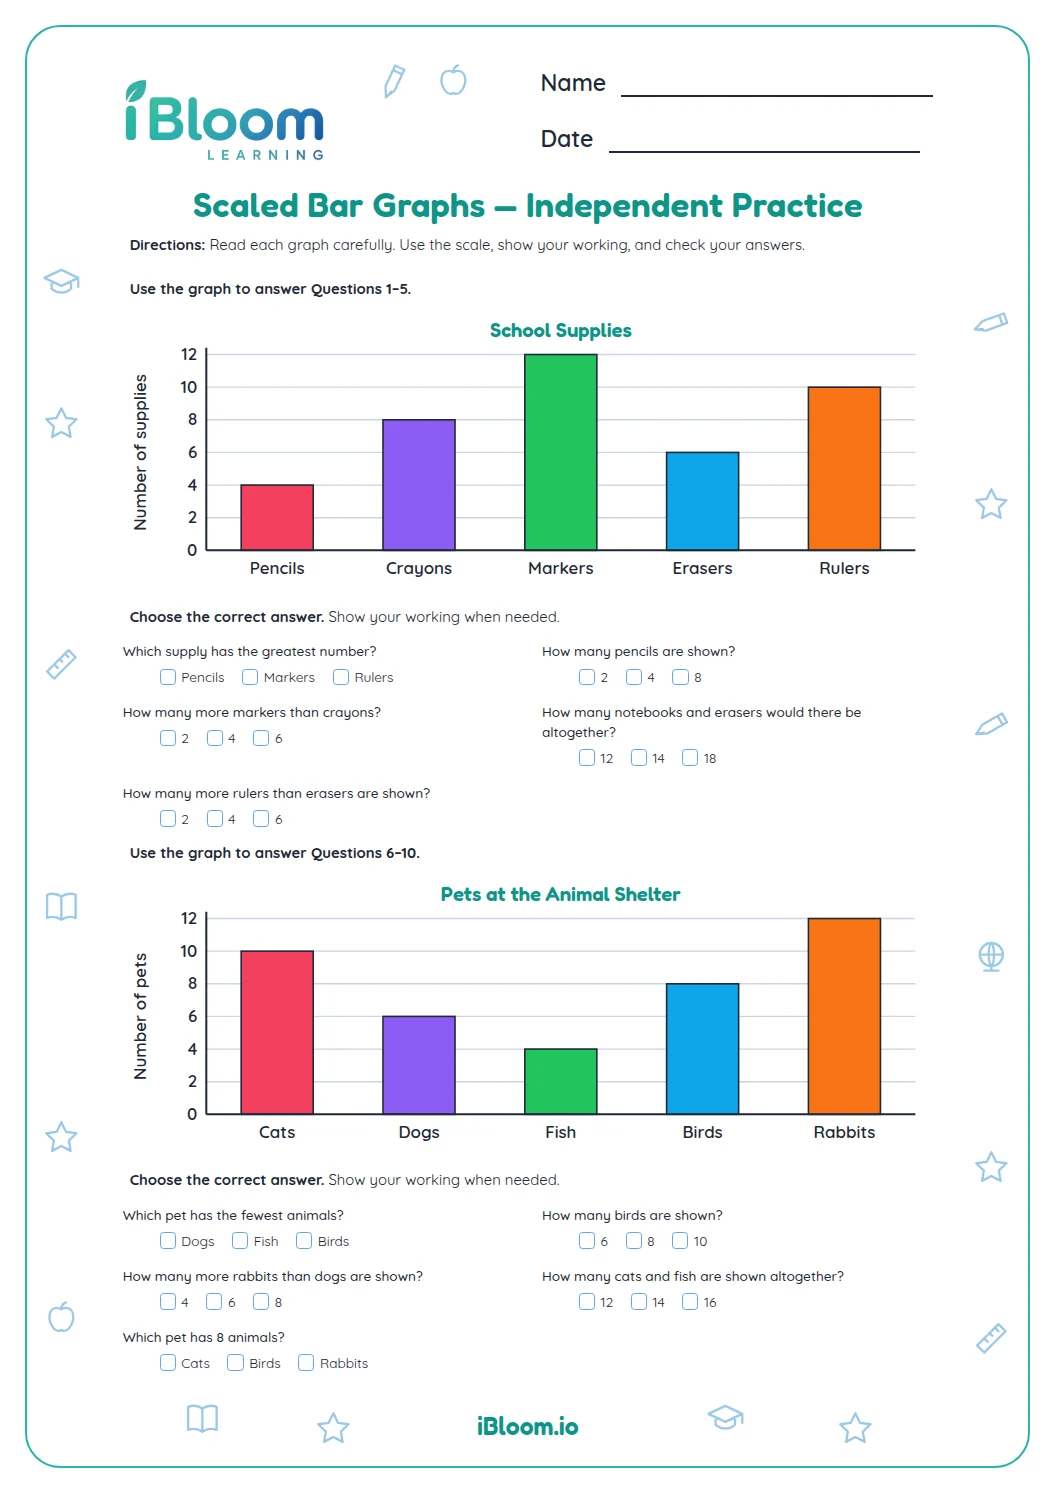
This free printable worksheet introduces Grade 3 students to scaled bar graphs, where each gridline is worth more than one. Children read a graph of books read in October whose gridlines go up by 2, then a graph of lunch choices whose gridlines go up by 5. They find what each gridline is worth, read bars that end on a line or halfway between two, answer how many more, how many fewer and how many in all, and finish with a two-step problem. The sheet practices Common Core 3.MD.B.3, and an answer key is included.
Aligned to 3.MD.B.3
What is on this scaled bar graph worksheet?
Two graphs, one on each page. Part A uses a graph of books read by five children, with gridlines every 2: children name the scale, read two bars (one ends halfway between gridlines) and find how many more books Ava read than Leo. Part B uses a graph of lunch choices with gridlines every 5 and asks how many, how many more, how many in all and how many fewer, ending with a two-step question.
The scale changes between the graphs on purpose. A child who counts gridlines as 1 each will get the first graph wrong, and switching from 2s to 5s makes checking the scale a habit.
- Part A: read a graph with a scale of 2 (questions 1 to 4)
- Part B: compare bars on a graph with a scale of 5 (questions 5 to 9)
How do you read a bar that ends between two gridlines?
Find the two gridlines the bar sits between, then split the gap in half. When the gridlines are 2 apart, halfway is one more than the lower line. Leo’s bar ends between the 4 and the 6, so Leo read 5 books.
Only a bar that sits exactly halfway can be read this way, and the graphs on this worksheet are drawn so every bar ends on a gridline or exactly halfway.
- 1Each gridline goes up by 2 books.
- 2Ava’s bar reaches the gridline labeled 12. → 12 books
- 3Leo’s bar ends halfway between 4 and 6. → 5 books
How do you find how many more on a bar graph?
Read both bars first, then subtract. In the lunch graph, pizza is 30 and pasta is 15, so 30 − 15 = 15 more students chose pizza. For “in all,” add the two bar values instead.
Question 9 combines both ideas. Children add pasta and salad (15 + 10 = 25), then subtract that from pizza (30 − 25 = 5).
How does skip counting help with a scaled graph?
Every gridline on a scaled graph is the same size, so children can skip count up the side: 2, 4, 6, 8 on the book graph and 5, 10, 15, 20 on the lunch graph. The tacos bar is 4 gridlines tall, and 4 jumps of 5 is 20.
This is the same counting children use for the 2 and 5 times tables, so a child can check a bar by counting the jumps as well as by reading the number beside it.
How to use this worksheet at home or in class
- 1Look at the first graph together and ask: what does each gridline equal? Have your child say it before answering anything.
- 2Let your child answer questions 1 to 3, using a finger to follow across from the top of each bar.
- 3For question 4, have your child write both bar values before subtracting.
- 4On the lunch graph, ask your child to say the value of each bar out loud before starting questions 5 to 9.
- 5For question 9, write pasta + salad first, then compare the total with pizza.
- 6Check answers with the key, and move on to Analyze Scaled Bar Graphs when the scale feels natural.
Common mistakes and quick fixes
The mistake
Counting gridlines as 1 each, so Ava’s bar reads as 6 gridlines instead of 12 books.
The fix
Have your child label the gridlines 0, 2, 4, 6 by hand. The number of lines is not the number of books.
The mistake
Reading Leo’s bar as 4 or 6 because it is not on a labeled line, then getting 8 books for question 4.
The fix
Show that the bar is halfway between 4 and 6, and halfway between 4 and 6 is 5. Then 12 − 5 = 7.
The mistake
Adding when the question asks how many more, such as 30 + 15 = 45 for pizza and pasta.
The fix
Underline the words. “How many more” compares, so subtract: 30 − 15 = 15. “In all” adds.
Common Core alignment
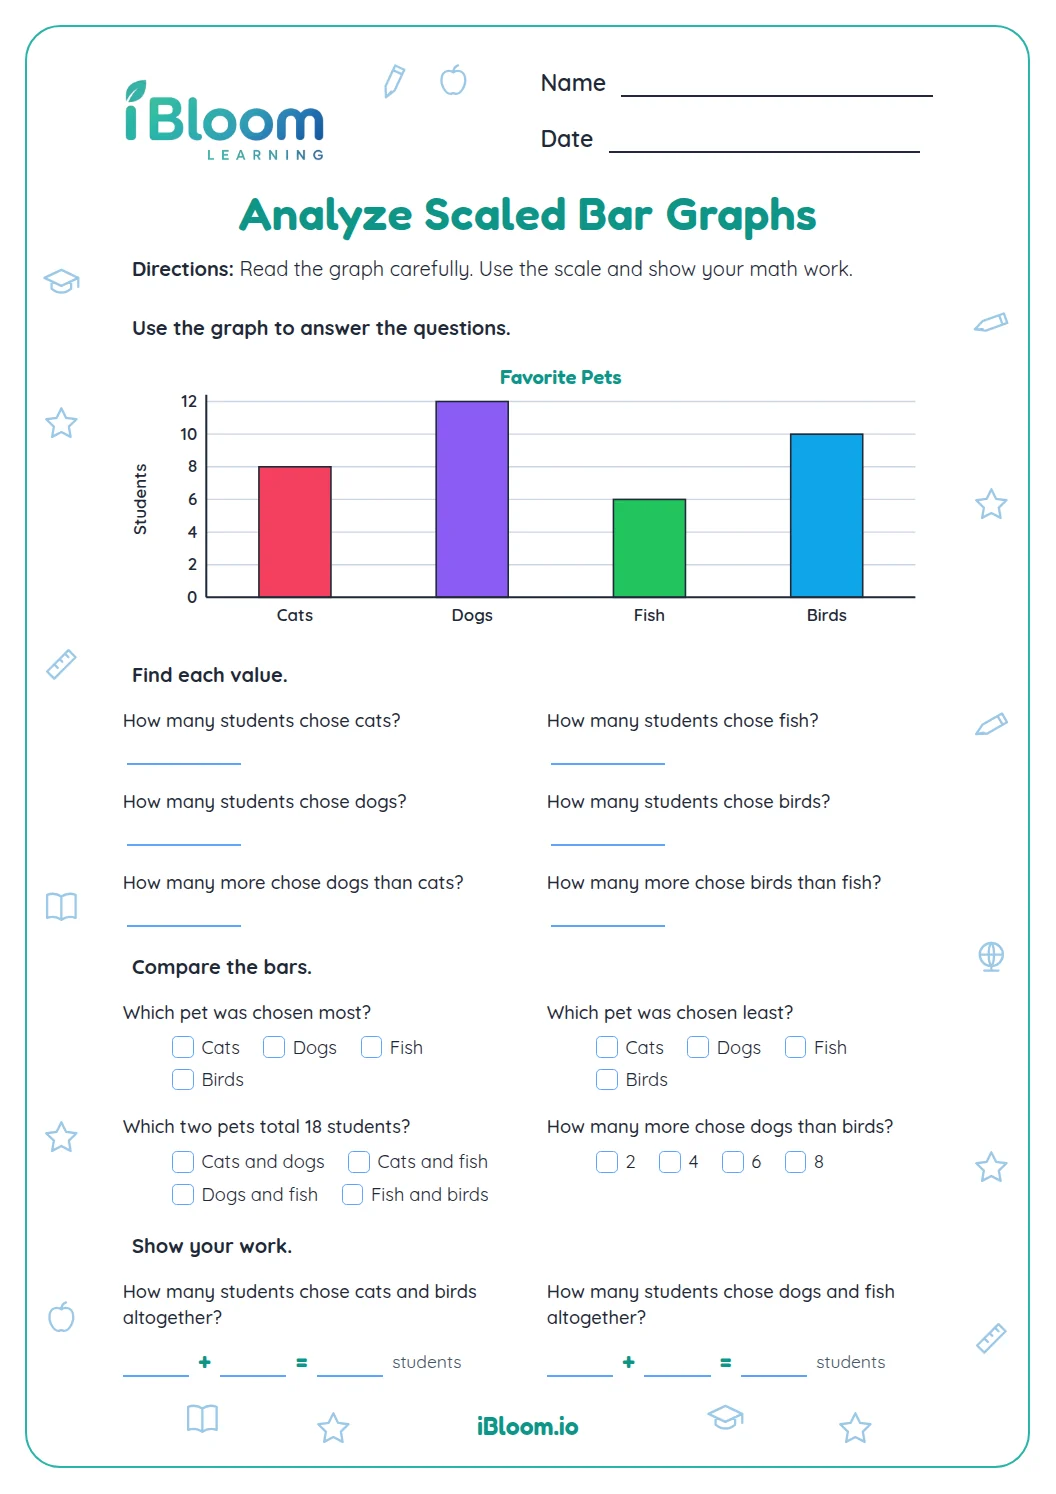
Grade 3 children solve problems from scaled bar graphs. This worksheet uses graphs with scales of 2 and 5.
Read a scaled bar graph and solve how-many-more and how-many-less problems.
On this sheet: Both parts read scaled bar graphs, and questions 4, 6, 8 and 9 solve how-many-more and how-many-fewer problems, including a two-step one.
Show the official wordingHide the official wording
Draw a scaled picture graph and a scaled bar graph to represent a data set with several categories. Solve one- and two-step “how many more” and “how many less” problems using information presented in scaled bar graphs. For example, draw a bar graph in which each square in the bar graph might represent 5 pets.
What to practice next
Make more practice
Further reading
Questions parents and teachers ask
What is a scaled bar graph?
It is a bar graph whose gridlines count by more than 1, such as 2s, 5s or 10s. The scale tells how much each gridline is worth. On this worksheet the book graph counts by 2 and the lunch graph counts by 5, so children must check the scale before reading any bar.
How do I read a bar that is between two gridlines?
Find the two gridlines above and below the top of the bar and split the gap in half. Leo’s bar on the book graph is halfway between 4 and 6, so it shows 5. Each graph here is drawn so bars end on a gridline or exactly halfway between two.
Why do the two graphs have different scales?
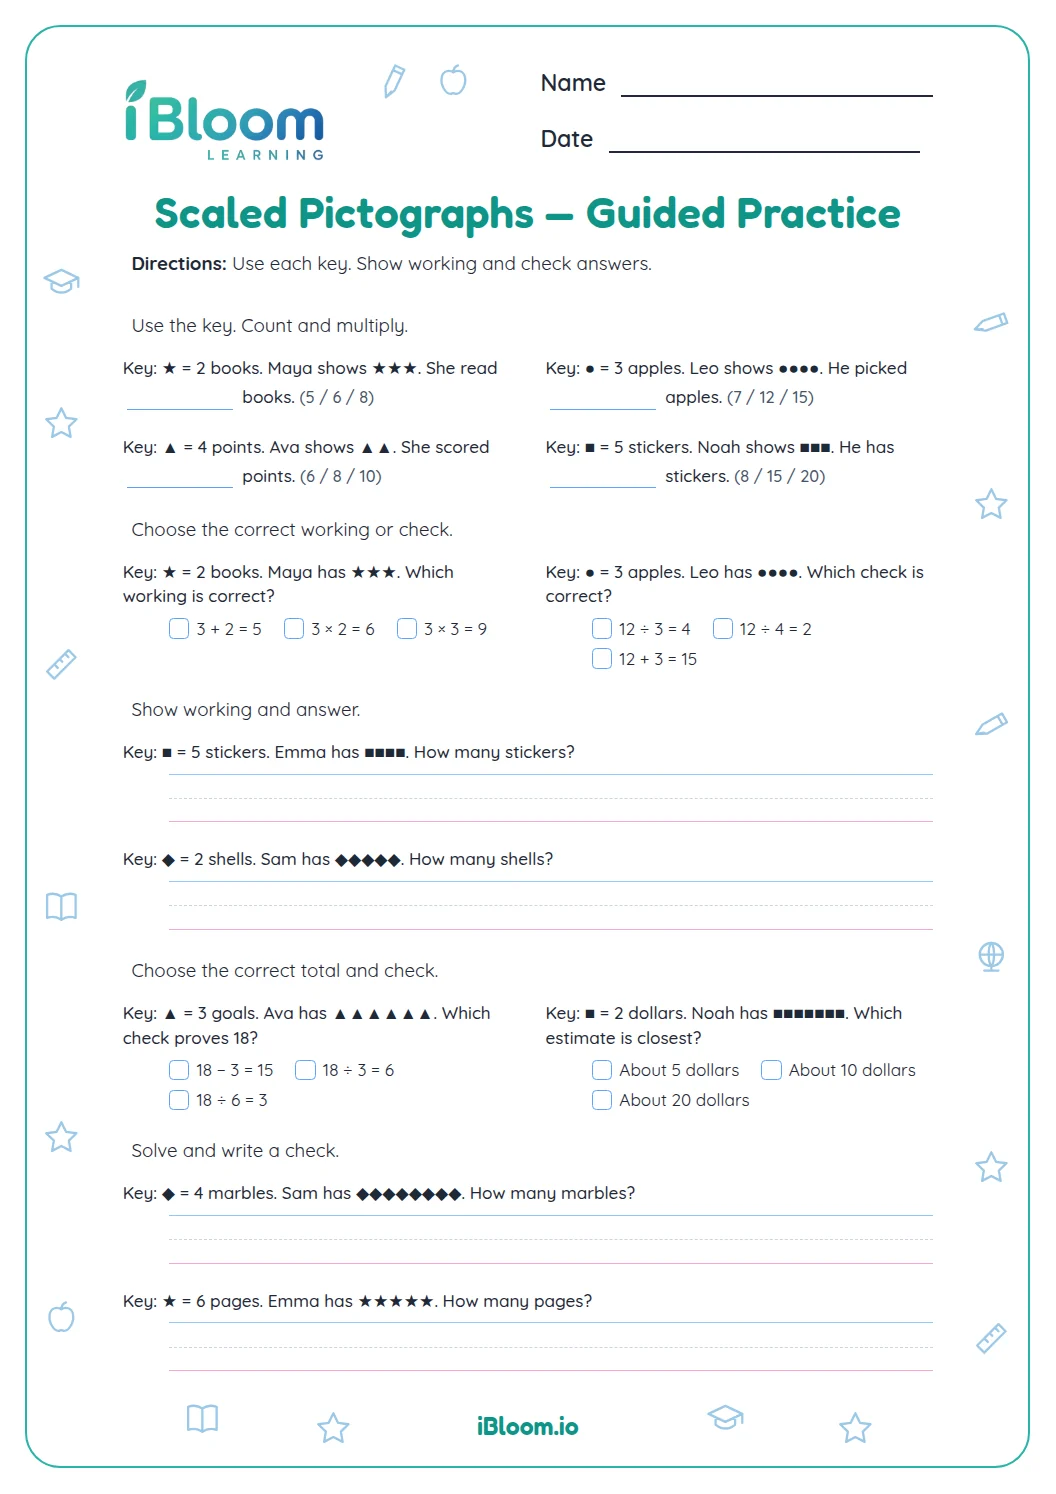
Different scales make children check each graph instead of assuming. Counting by 2 on the book graph and by 5 on the lunch graph is also the kind of skip counting Grade 3 children already know from multiplication. Seeing both on one sheet shows that the same bar height can mean different amounts.
Which question is the two-step problem?
Question 9. It asks how many more students chose pizza than pasta and salad together. Children first add pasta and salad, 15 + 10 = 25, then subtract from pizza, 30 − 25 = 5. Writing both number sentences beside the graph keeps the two steps clear.
What are the answers?
Part A: 2 books, 12 books, 5 books and 7 books. Part B: 20 students, 15 students, 40 students, 10 students and 5 students. The two-page answer key marks each choice. The trickiest one is Leo’s bar, which ends halfway between 4 and 6.
What should we try after this worksheet?
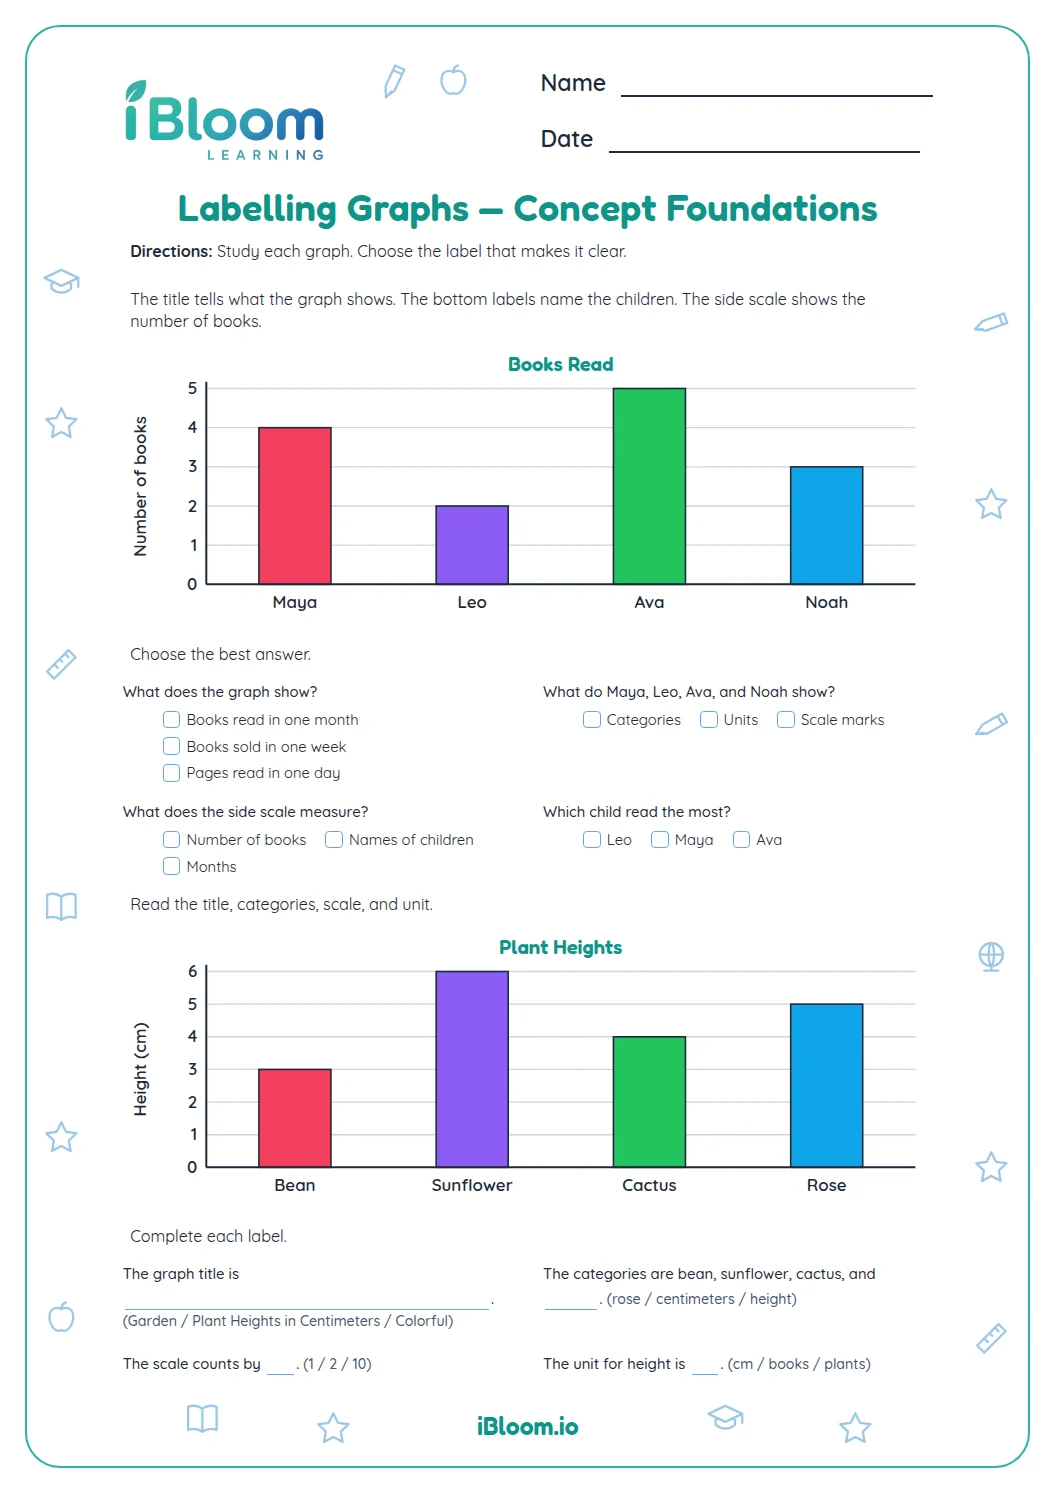
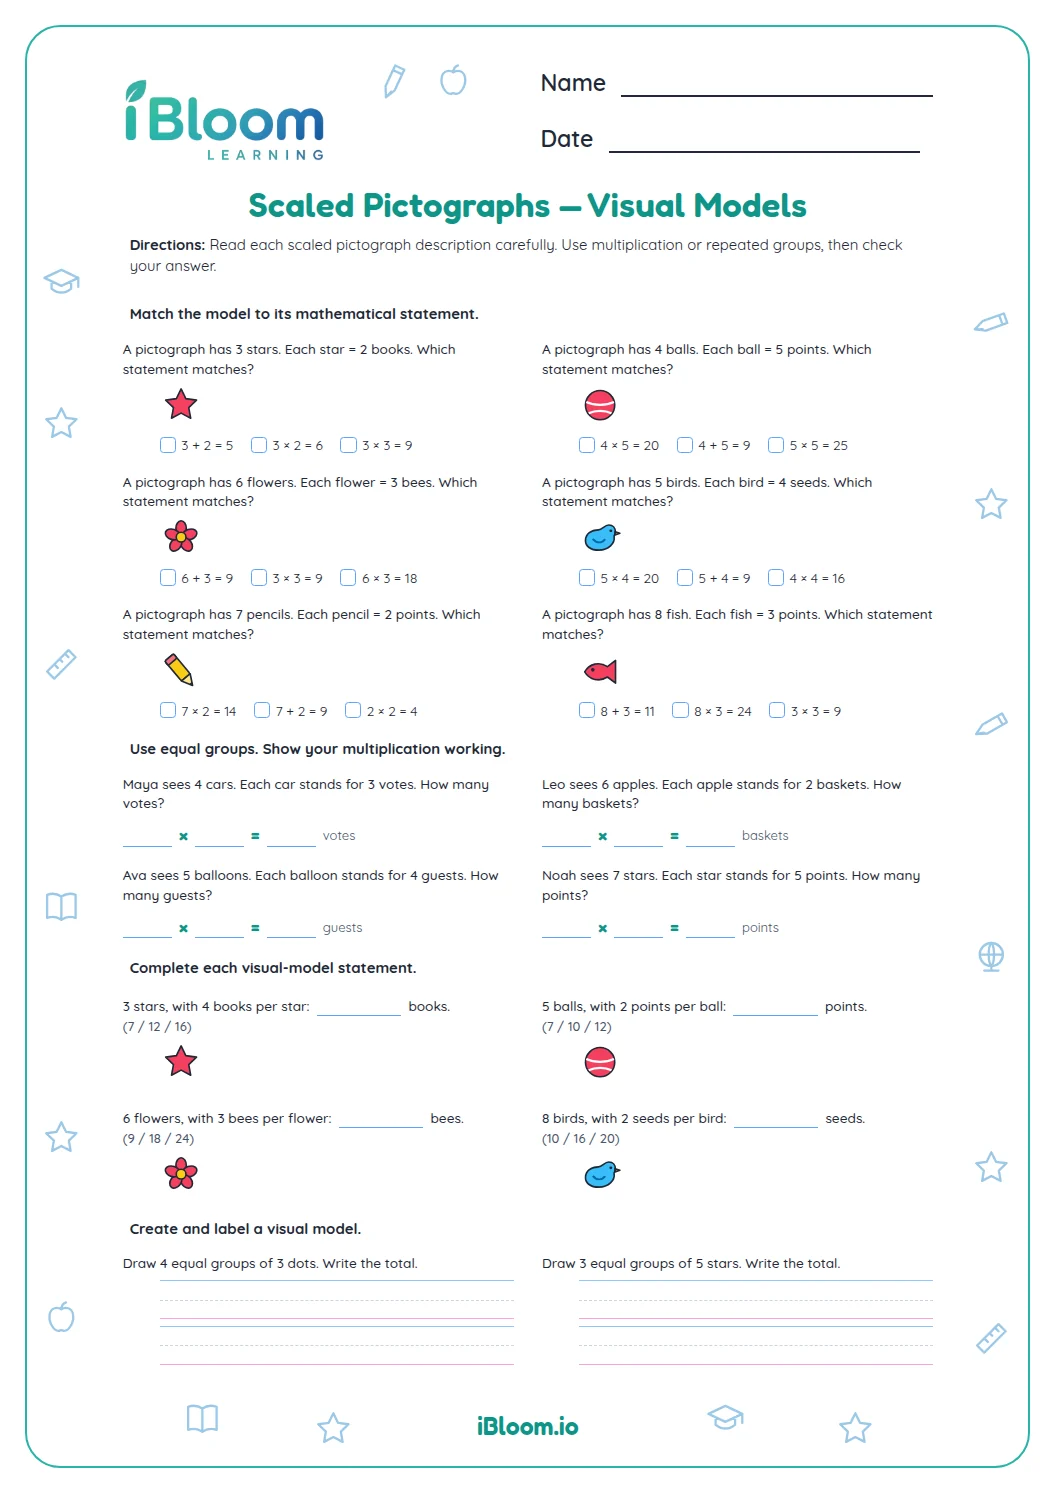
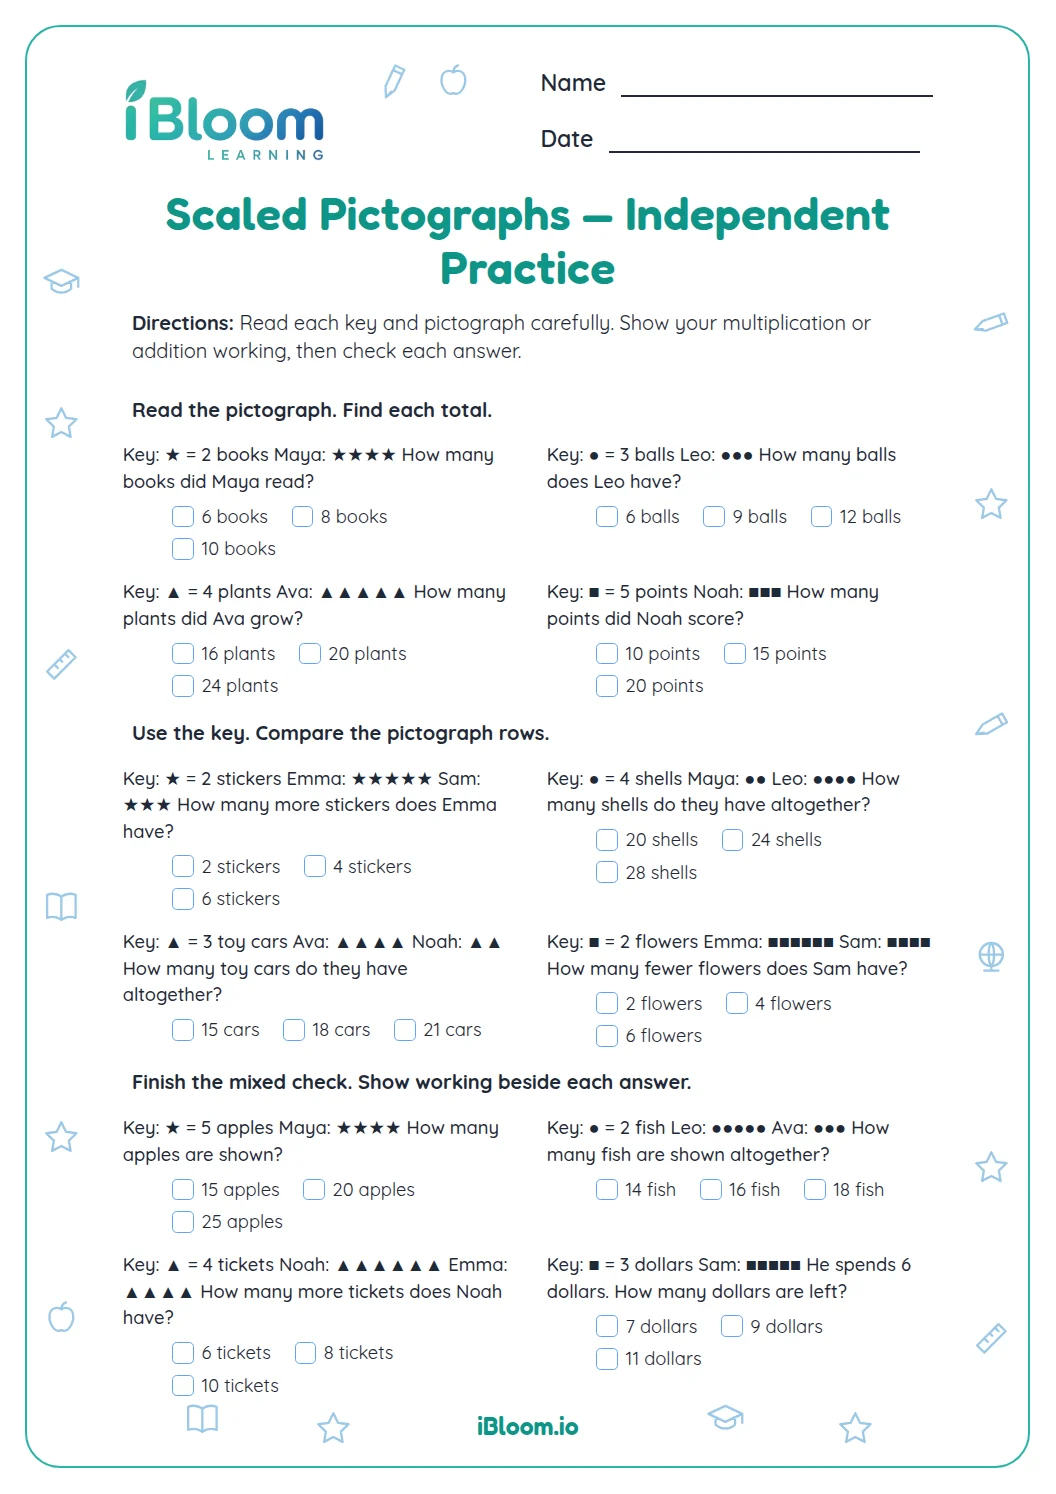
Move on to Analyze Scaled Bar Graphs for harder comparisons, or to Scaled Pictographs, where one picture stands for several. Labeling Graphs helps if your child forgets to check titles and axes. Line Plots show a different way to display data on a number line.