

About this worksheet
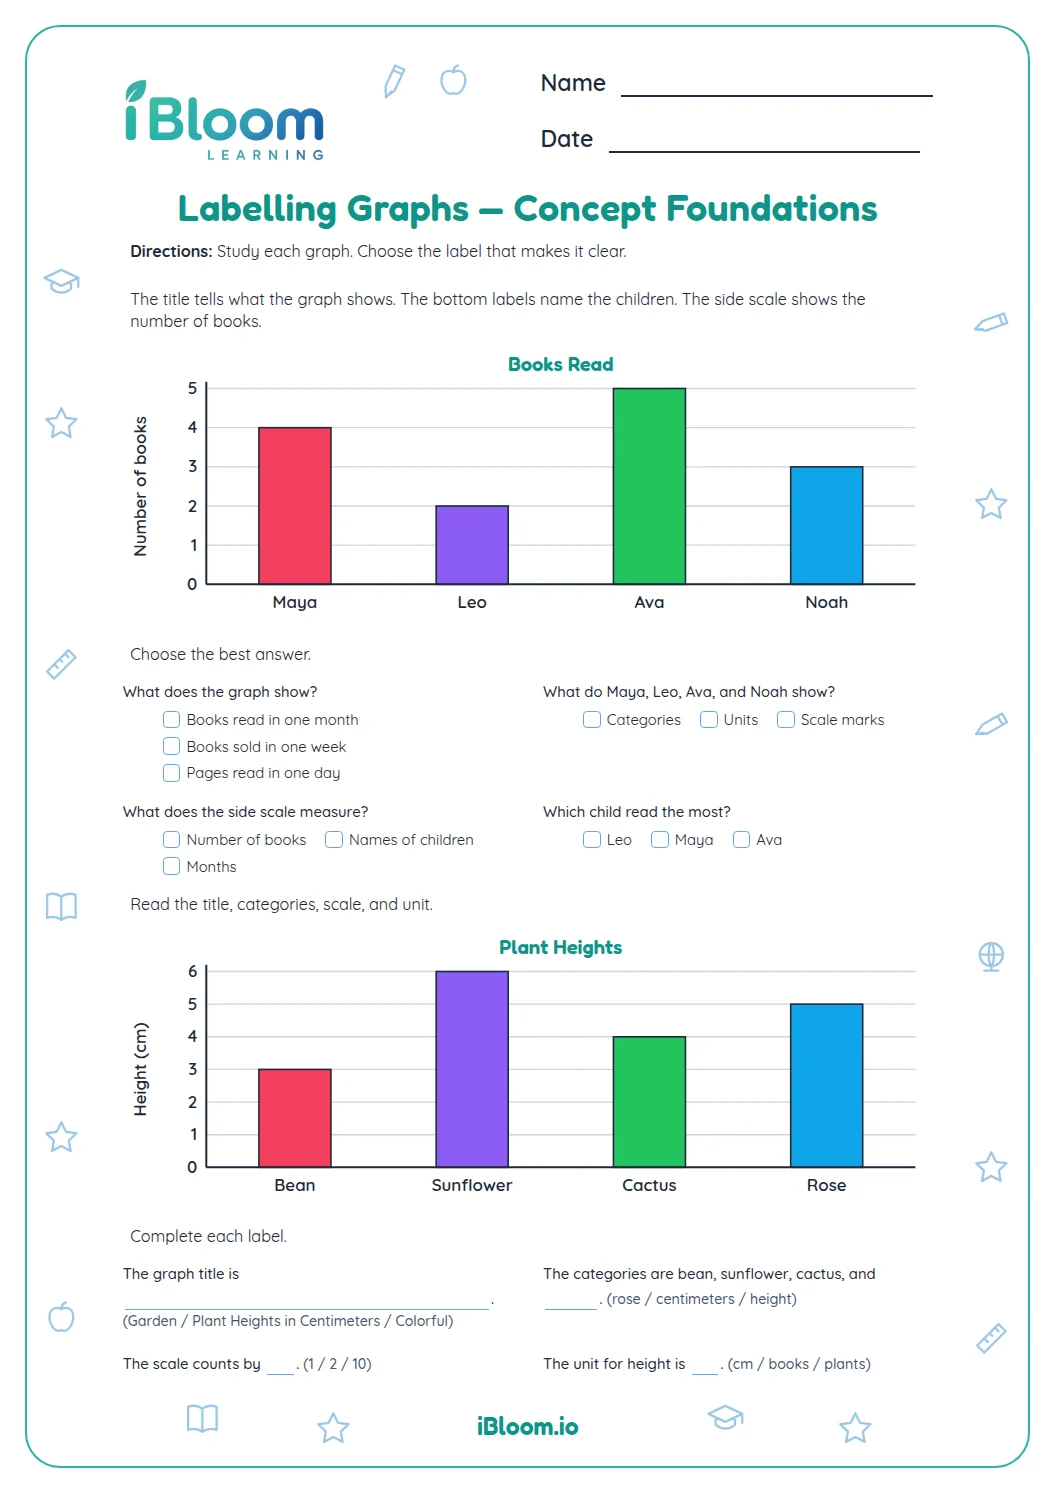
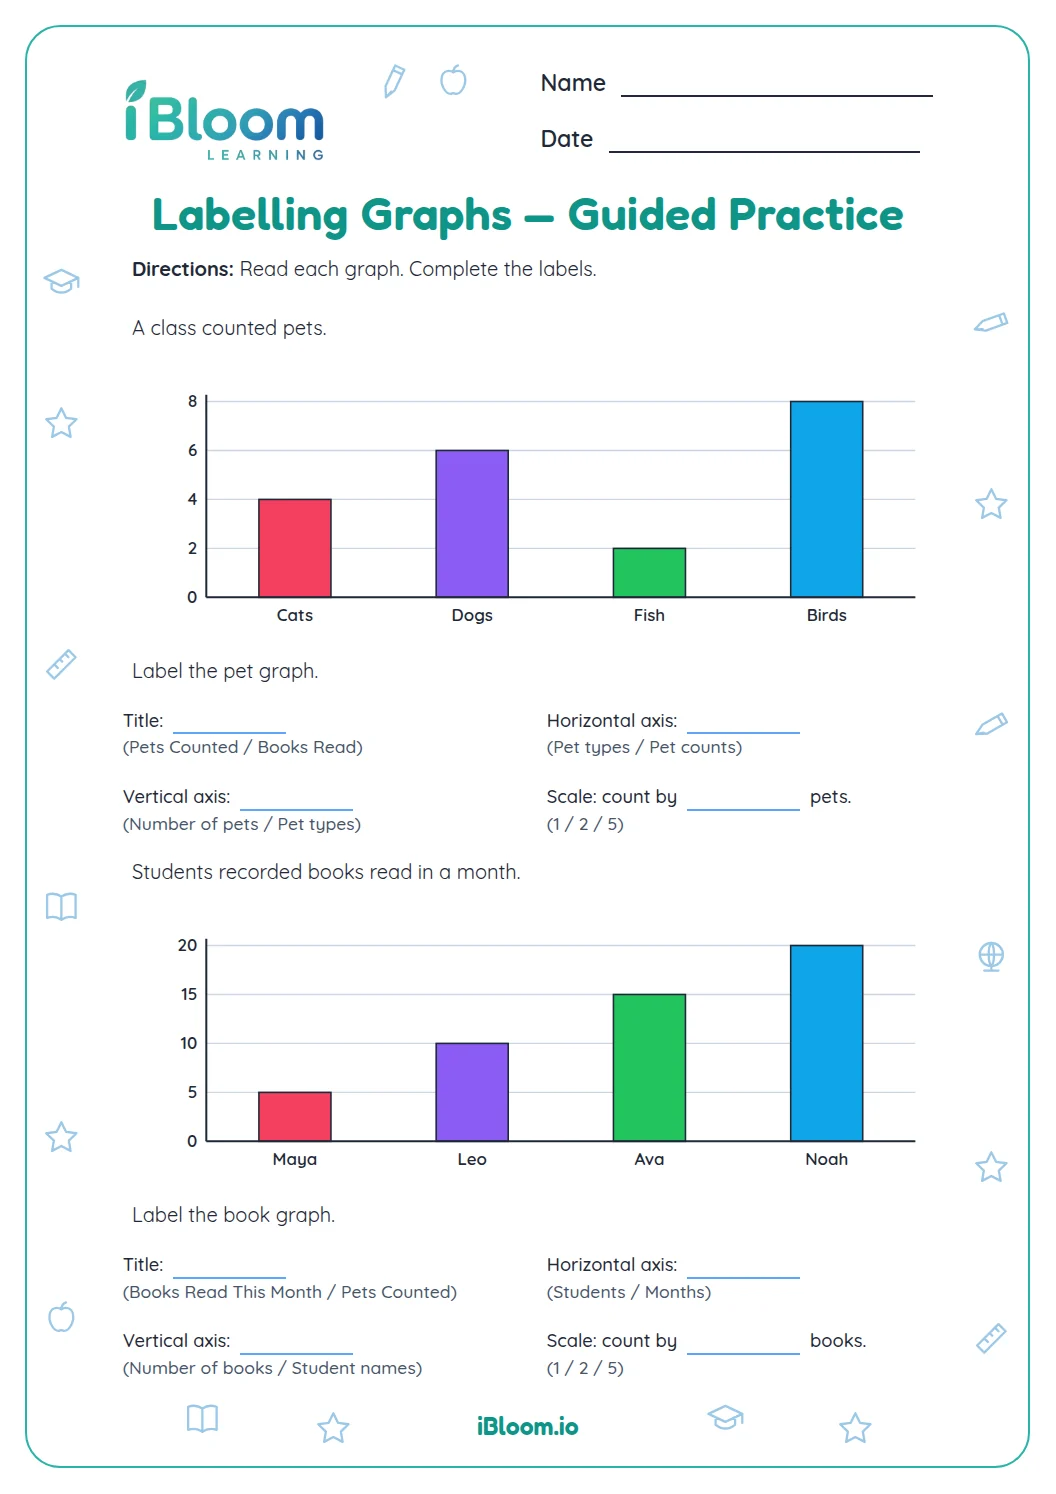
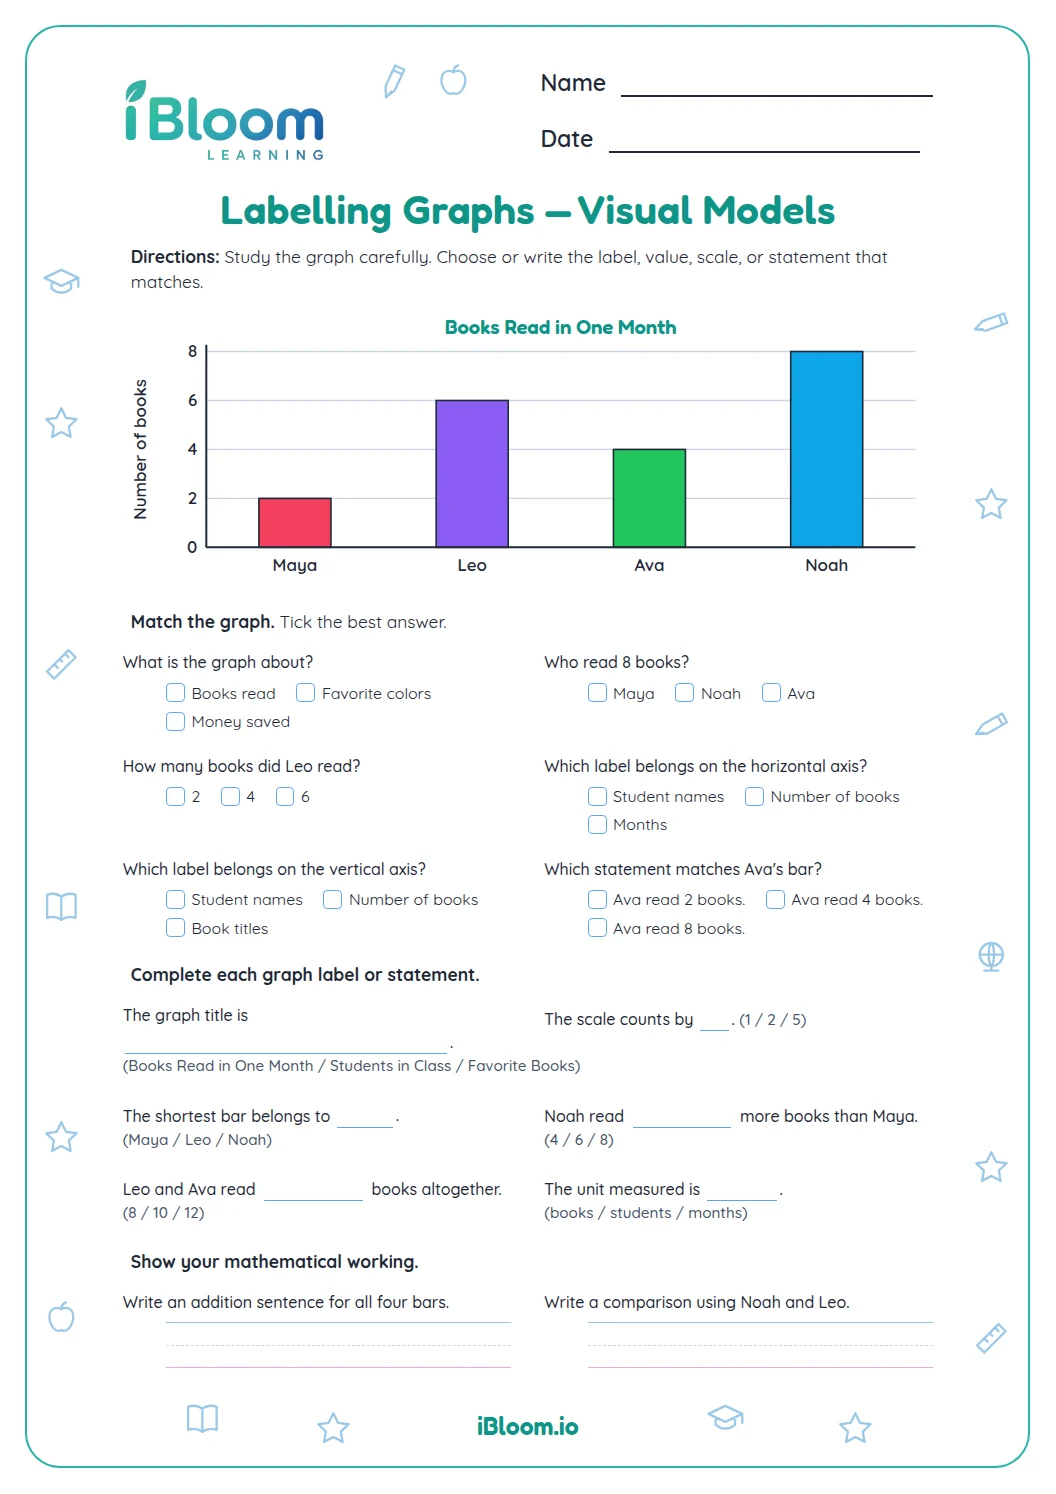
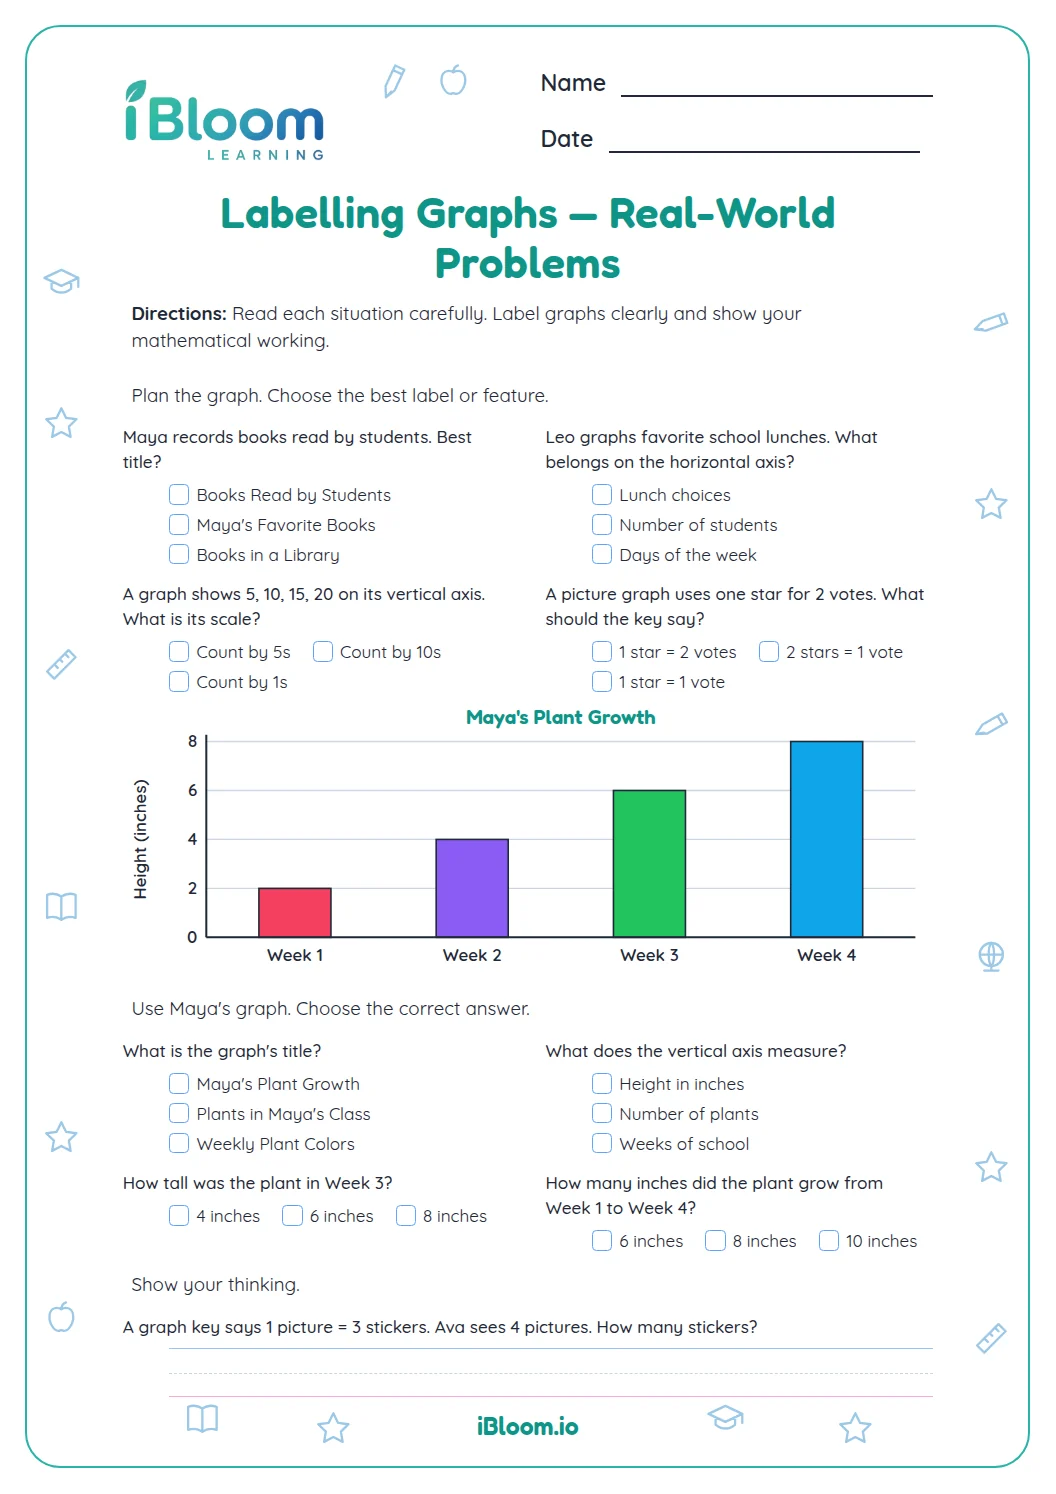
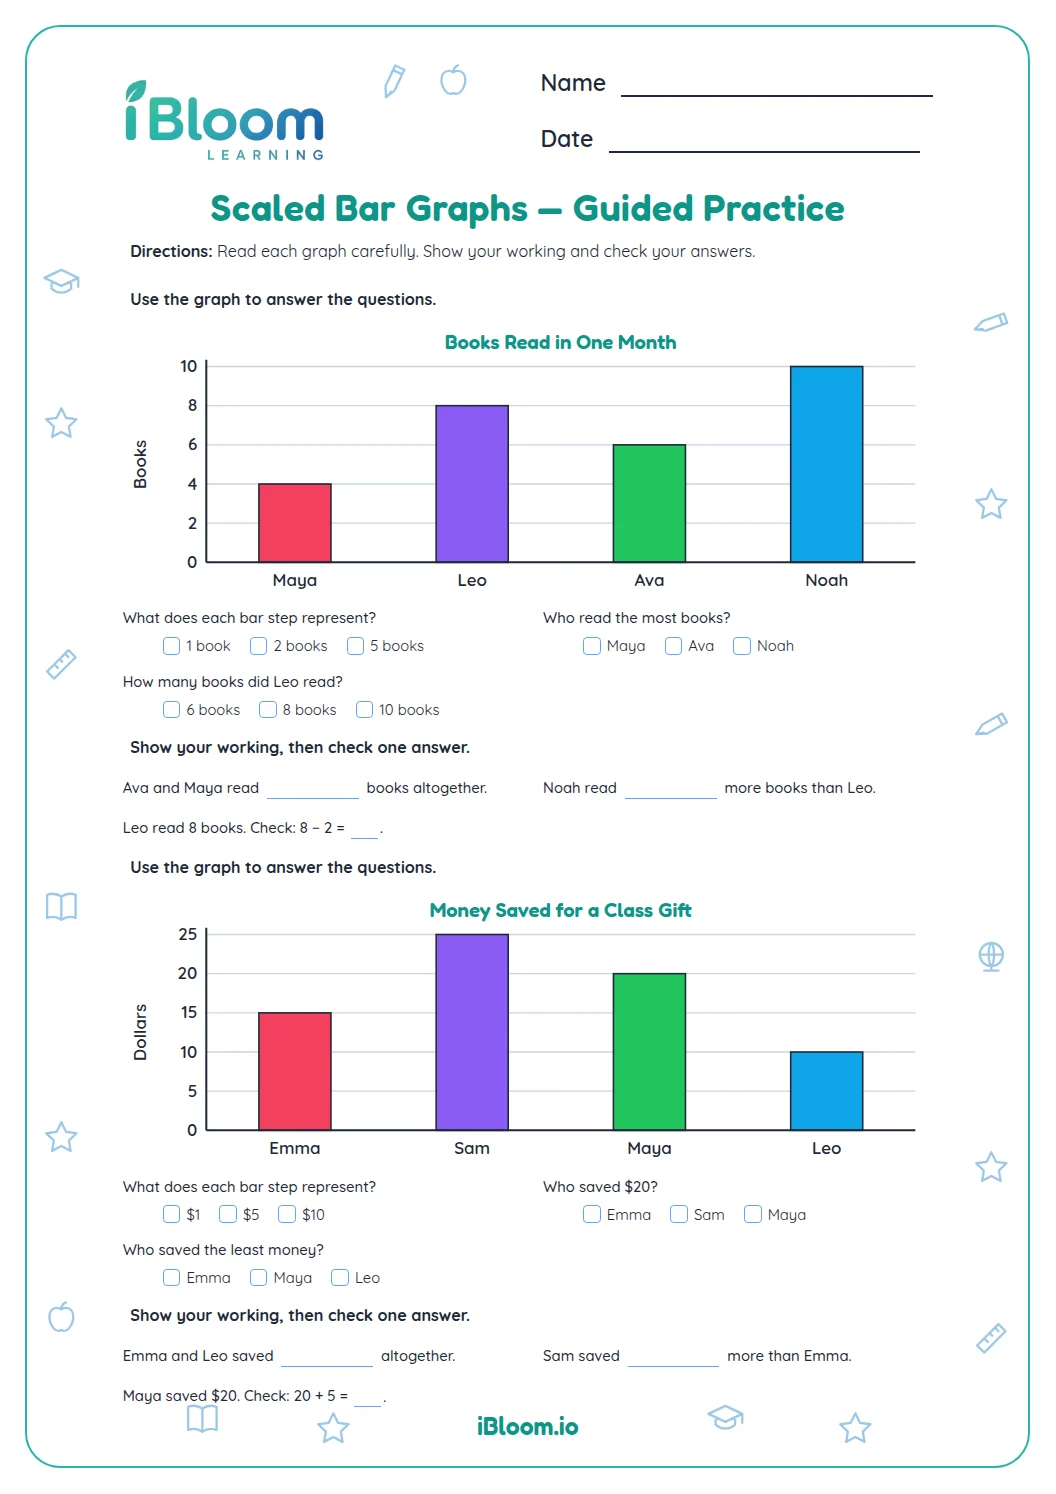
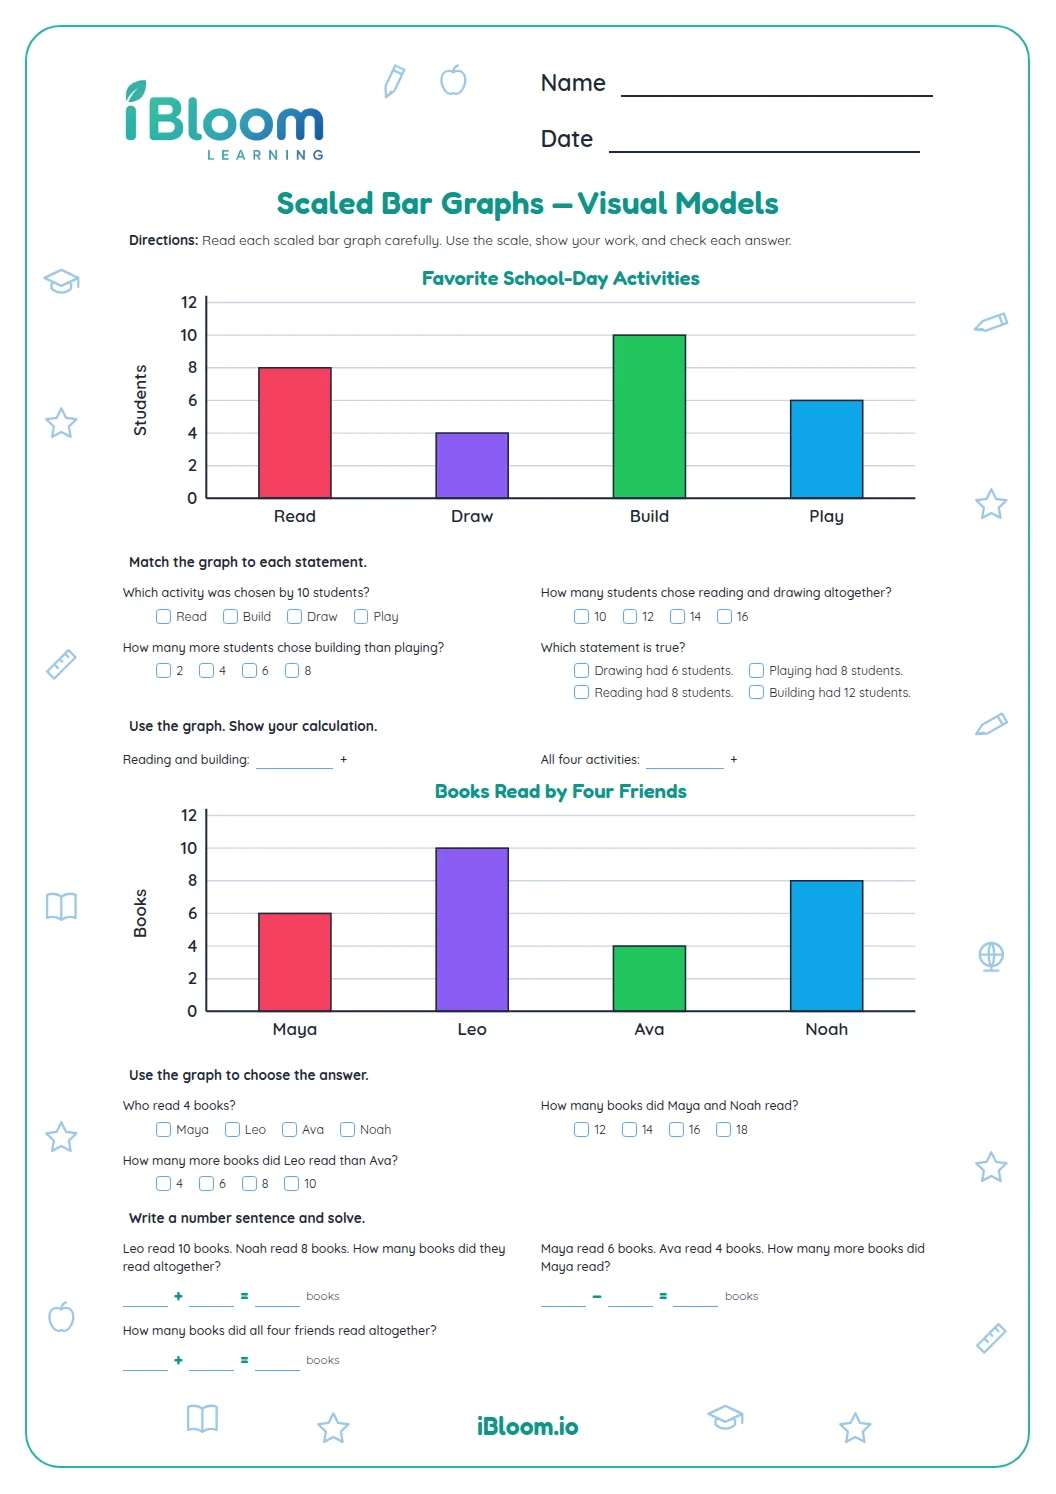
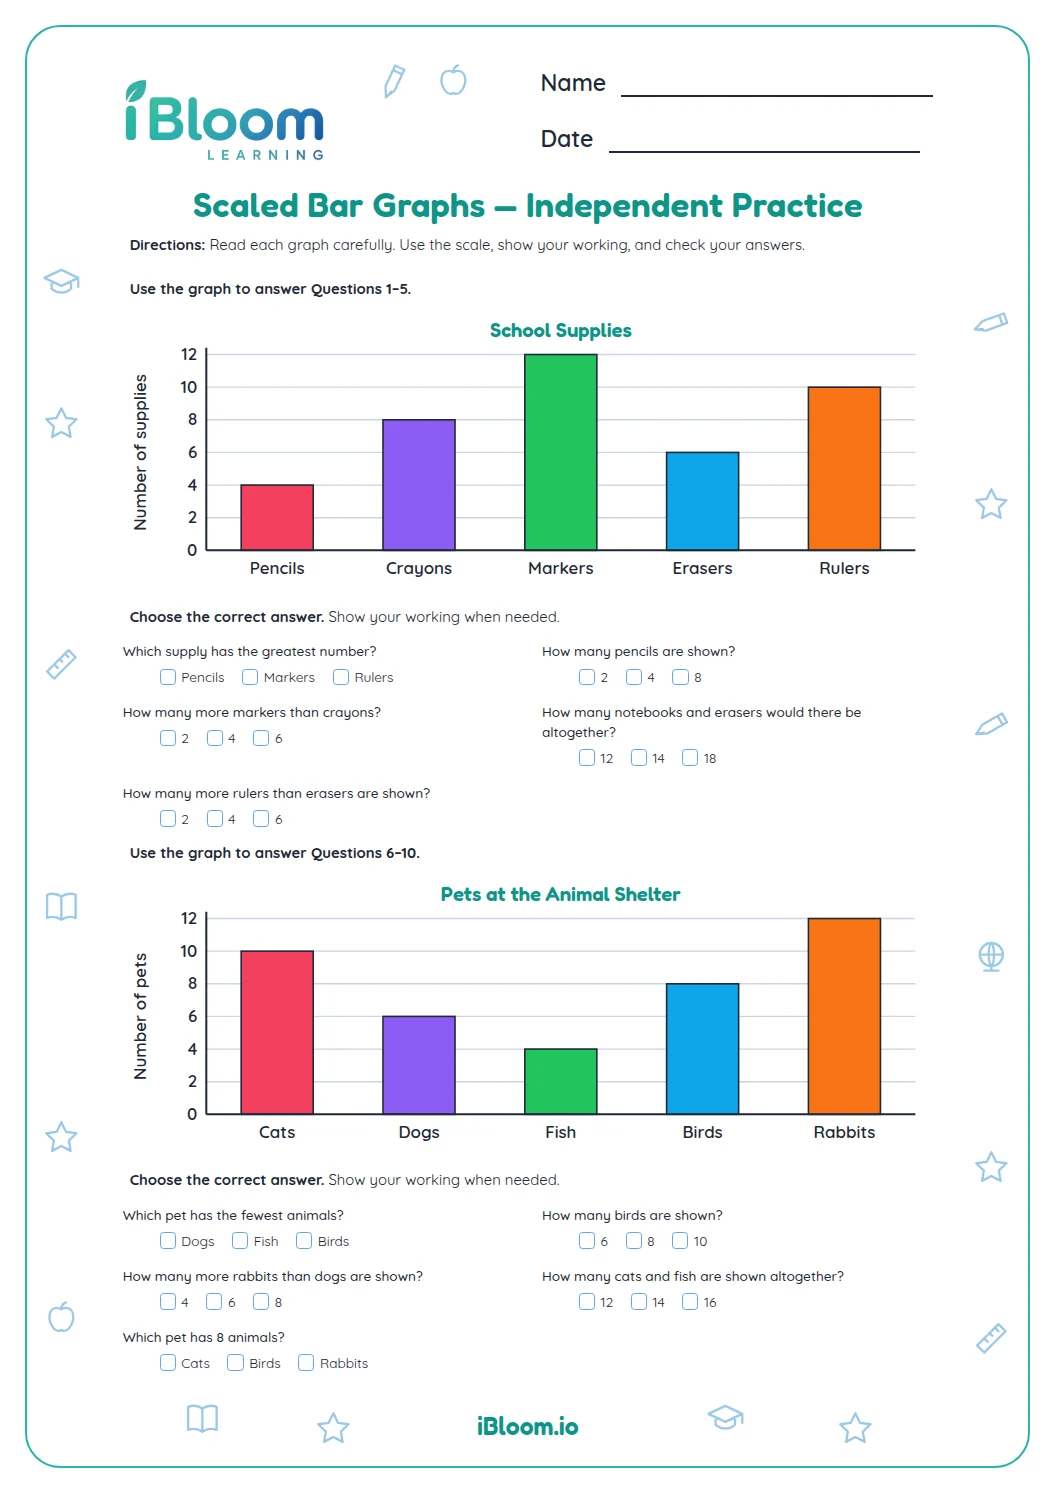
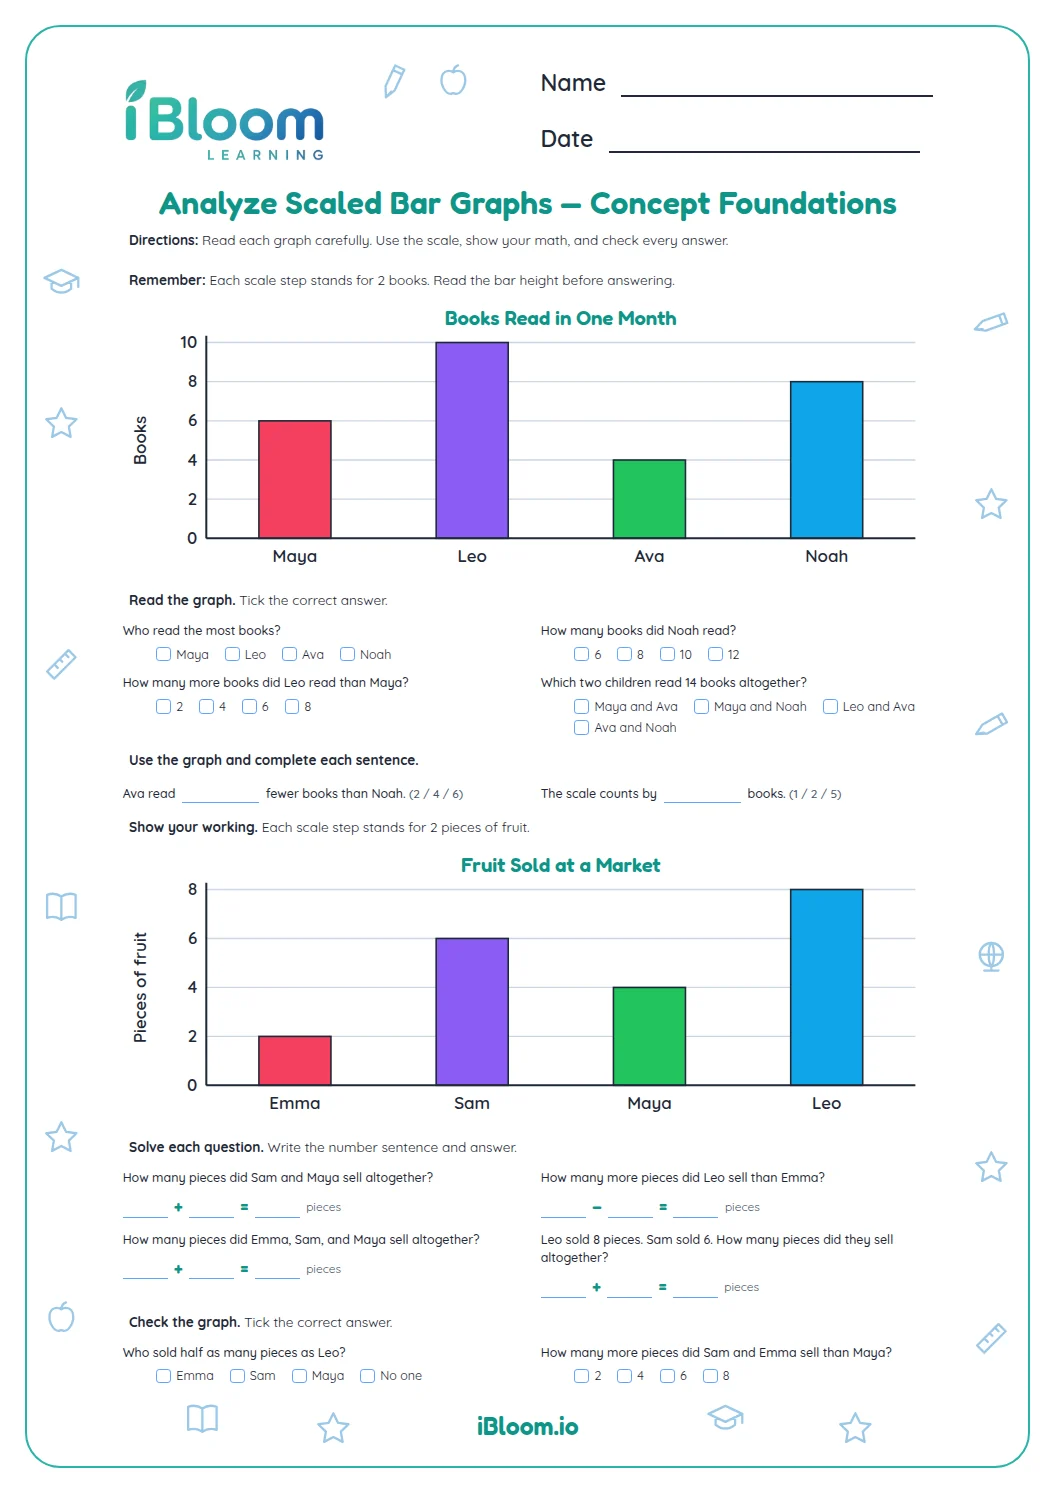
This free printable worksheet teaches Grade 3 children to read the labels on a bar graph before they read the bars. Page 1 shows Books Read in One Month for Maya, Leo, Ava and Noah, and page 2 shows Favorite Pets in Room 12 with a scale that counts by 2s. Children decide what belongs along the bottom, what the numbers on the side count, and which title fits, then use the scale to find how many more. It practices Common Core 3.MD.B.3 with scaled bar graphs. A two-page answer key is included.
Aligned to 3.MD.B.3
What is on this labeling graphs worksheet?
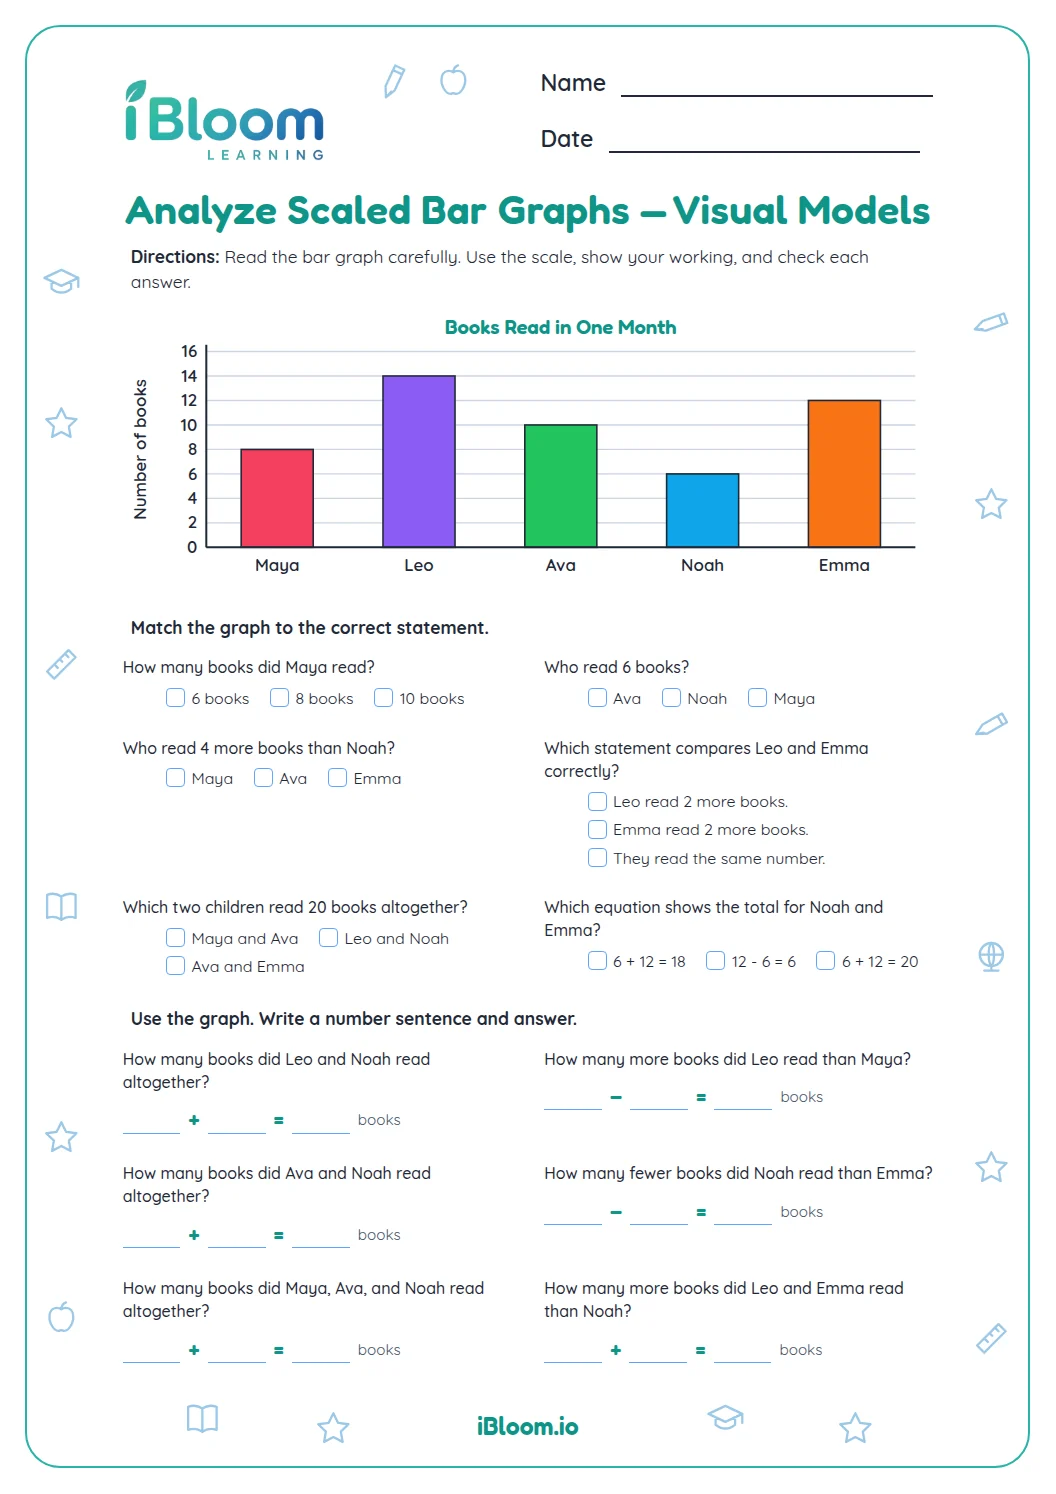
Page 1 has a bar graph called Books Read in One Month. The bars show Maya 4, Leo 7, Ava 5 and Noah 3, and the side is labeled Books read and counts by 1s. Three questions ask what the bottom shows, how the scale counts and how many more books Leo read than Noah.
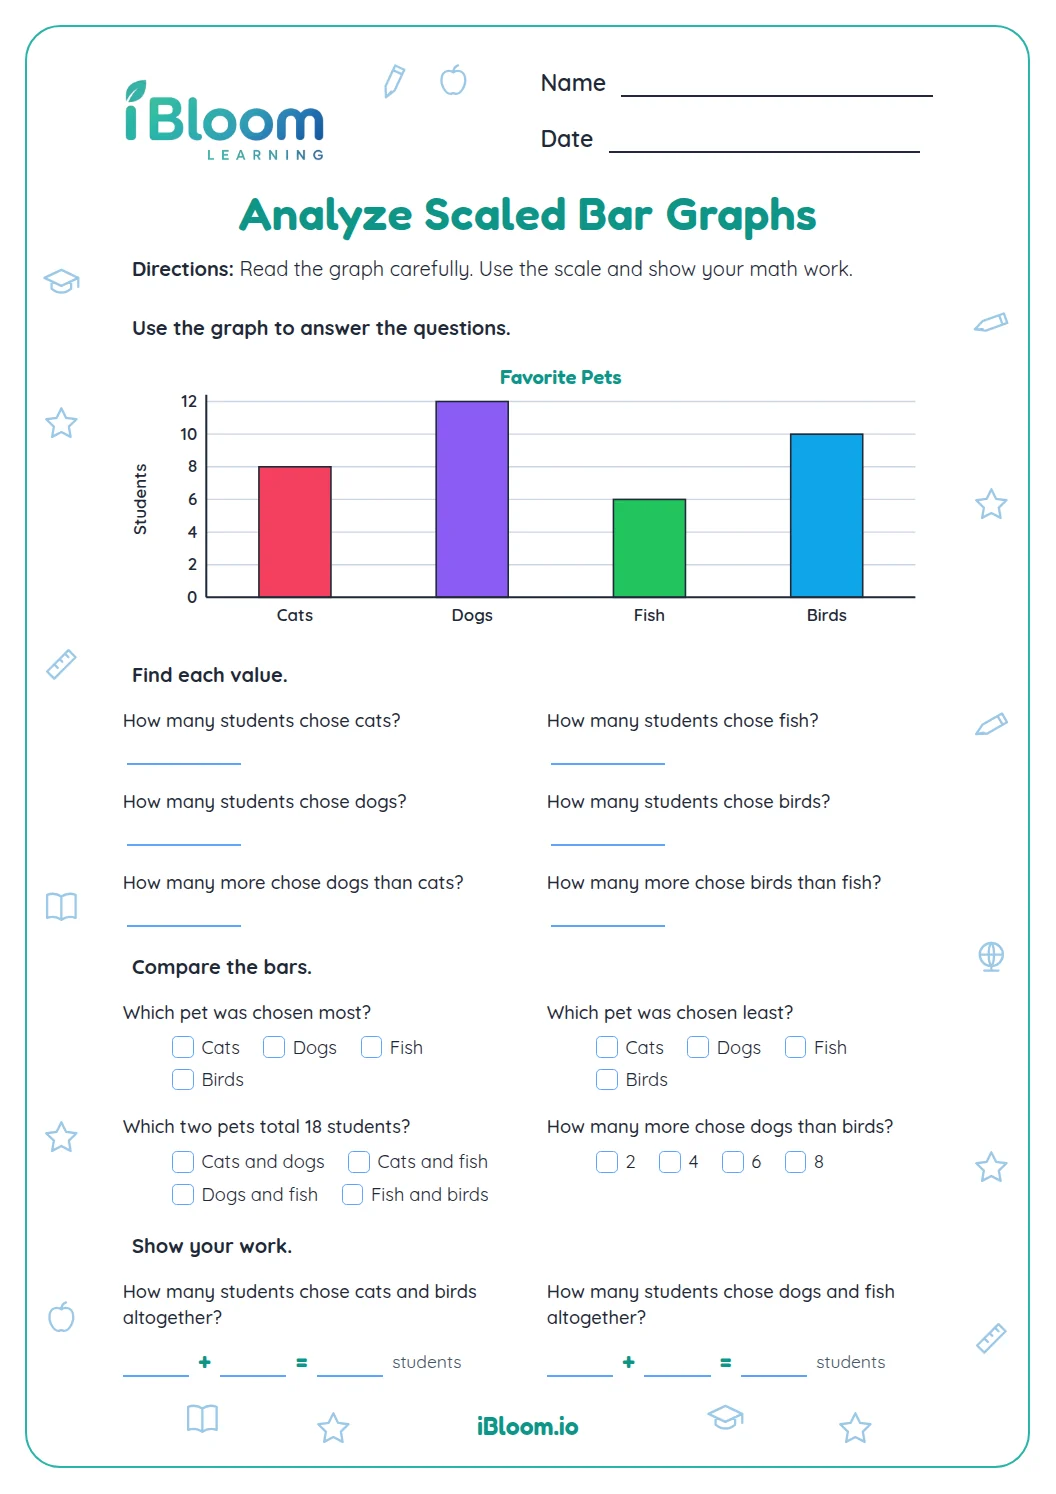
Page 2 has Favorite Pets in Room 12 with bars for Dog 10, Cat 6, Fish 4 and Bird 2. This graph has no label beside its numbers, so children choose the one that belongs there. They also read the scale, which counts by 2s, find how many more students chose dogs than birds, and pick a title for a graph Ben could make about classmates' favorite fruits.
- Part A: read the Books Read graph, 3 multiple-choice questions
- Part B: add the missing label to the Favorite Pets graph, scale and compare, 4 multiple-choice questions
How do you decide what label goes beside the numbers?
Ask what each bar is counting. On the Favorite Pets graph, the pets are already named along the bottom, so the numbers on the side must count something else: the children who picked each pet. The title confirms it, because favorite pets in a room come from the students in that room.
That is why Number of students is the answer to question 4. Kinds of pets and Pet names repeat what the bottom already says, so they cannot be the side label.
- 1Title: Favorite Pets in Room 12. Bottom: Dog, Cat, Fish, Bird.
- 2The bars count how many children chose each pet.
- 3The side label tells what the numbers count.
- 4Answer: Number of students
How do you read a scale that counts by 2s?
Read the numbers up the side in order. On the first graph they go 1, 2, 3, 4, so the scale counts by 1s. On the second graph they go 2, 4, 6, 8, 10, so each step is 2.
A scale tells you how much one gridline is worth, which is why children should check it before reading a bar. Once the scale is clear, how many more is subtraction. The Dog bar reaches 10 and the Bird bar reaches 2, so 10 − 2 = 8 more students chose dogs.
What makes a good graph title?
A good title says what is counted and who it is about. In question 7, Ben asks 20 classmates which fruit they like best: apple, grape or banana, so Favorite Fruits in Class fits. Fruit Prices and Fruit Trees describe different information that his bars would not show.
How to use this worksheet at home or in class
- 1Before any question, point to the title and read it aloud, then read the labels along the bottom.
- 2Ask your child what the numbers on the side count, and say it in a full sentence: "The side counts books read."
- 3For the scale questions, have your child touch each number up the side and say it out loud.
- 4For how many more, find both bars and subtract the smaller number from the larger.
- 5Check with the answer key, and if a label question is missed, go back to the title and ask what each bar counts.
Common mistakes and quick fixes
The mistake
Choosing Kinds of pets for question 4 because pets are what the graph is about.
The fix
The pets are already named along the bottom. Ask what the numbers count: each number is a count of students.
The mistake
Answering 1s for question 5 because the first graph counted by 1s.
The fix
Each graph has its own scale. Read the side numbers of this one: 2, 4, 6, 8, 10 count by 2s.
The mistake
Adding 7 + 3 = 10 books for question 3 instead of subtracting.
The fix
How many more compares two bars, so subtract: 7 − 3 = 4 books.
Common Core alignment
Grade 3 children use scaled bar graphs to answer how many more questions.
Use a scaled bar graph to solve how many more problems, such as dogs compared with birds.
On this sheet: Both graphs use a labeled scale, with questions that read the scale and compare two bars to find how many more.
Show the official wordingHide the official wording
Draw a scaled picture graph and a scaled bar graph to represent a data set with several categories. Solve one- and two-step “how many more” and “how many less” problems using information presented in scaled bar graphs. For example, draw a bar graph in which each square in the bar graph might represent 5 pets.
What to practice next
Make more practice
Further reading
Questions parents and teachers ask
What does this labeling graphs worksheet include?
It has two bar graphs and 7 multiple-choice questions. Page 1 uses a graph of books read by four students, and page 2 uses a graph of favorite pets with a scale that counts by 2s. Children choose labels and titles, read each scale and find how many more.
Why does the Favorite Pets graph have no label beside its numbers?
The missing label is the question. Children have to work out what the numbers count by using the title and the bottom labels. Since the pets are named along the bottom, the numbers must count students, so Number of students is the label that belongs there.
What are the answers?
Part A: Student names, 1s and 4 books. Part B: Number of students, 2s, 8 students and Favorite Fruits in Class. The answer key marks the right choice on each question across two pages. On the Books graph, Leo read 7 books and Noah read 3, so the difference is 4.
What is a scale on a bar graph?
The scale is the row of numbers up the side that shows how much each gridline is worth. On the Books graph it counts by 1s, and on the Favorite Pets graph it counts by 2s. Checking the scale first keeps children from reading a bar as if every line were 1.
How is this different from a worksheet that asks children to draw a graph?
Here the graphs are already drawn, and children study the labels, scale and title. That is the part that makes a graph readable. Once they can read and choose labels, drawing their own graph with a title, side label and scale is a natural next step.
How long does it take?
Plan on about 15 minutes. Each page has one graph and three or four questions, so you can do one page at a time. For extra talk, ask your child to say one sentence about each graph, such as "Leo read the most books."