



About this worksheet
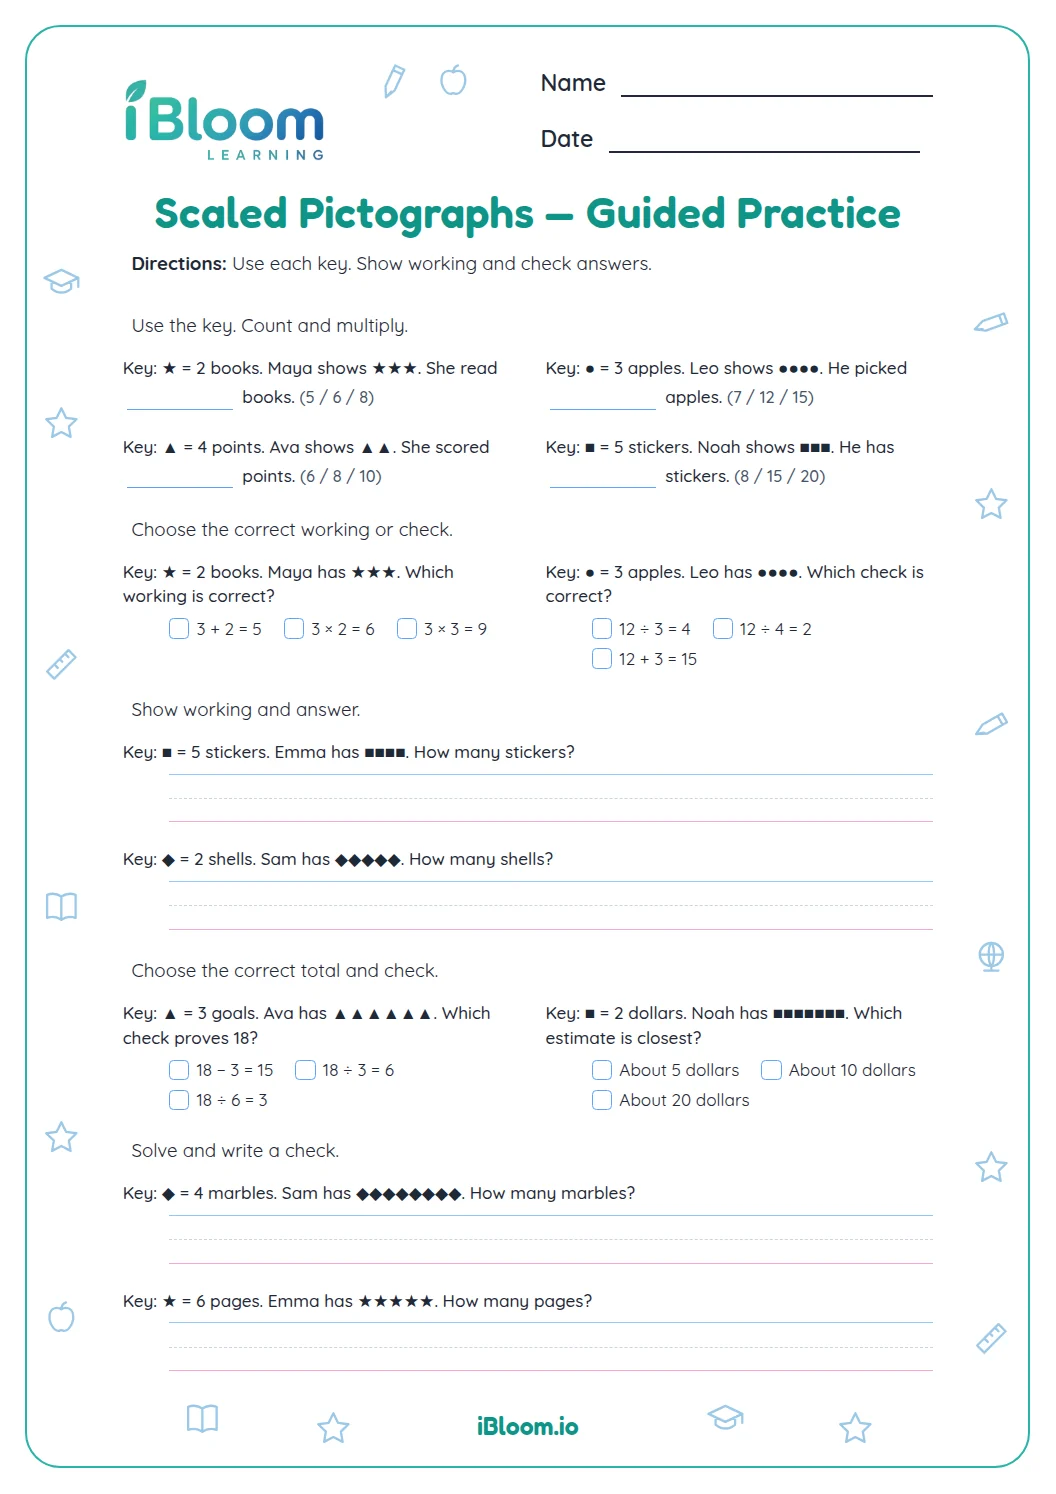
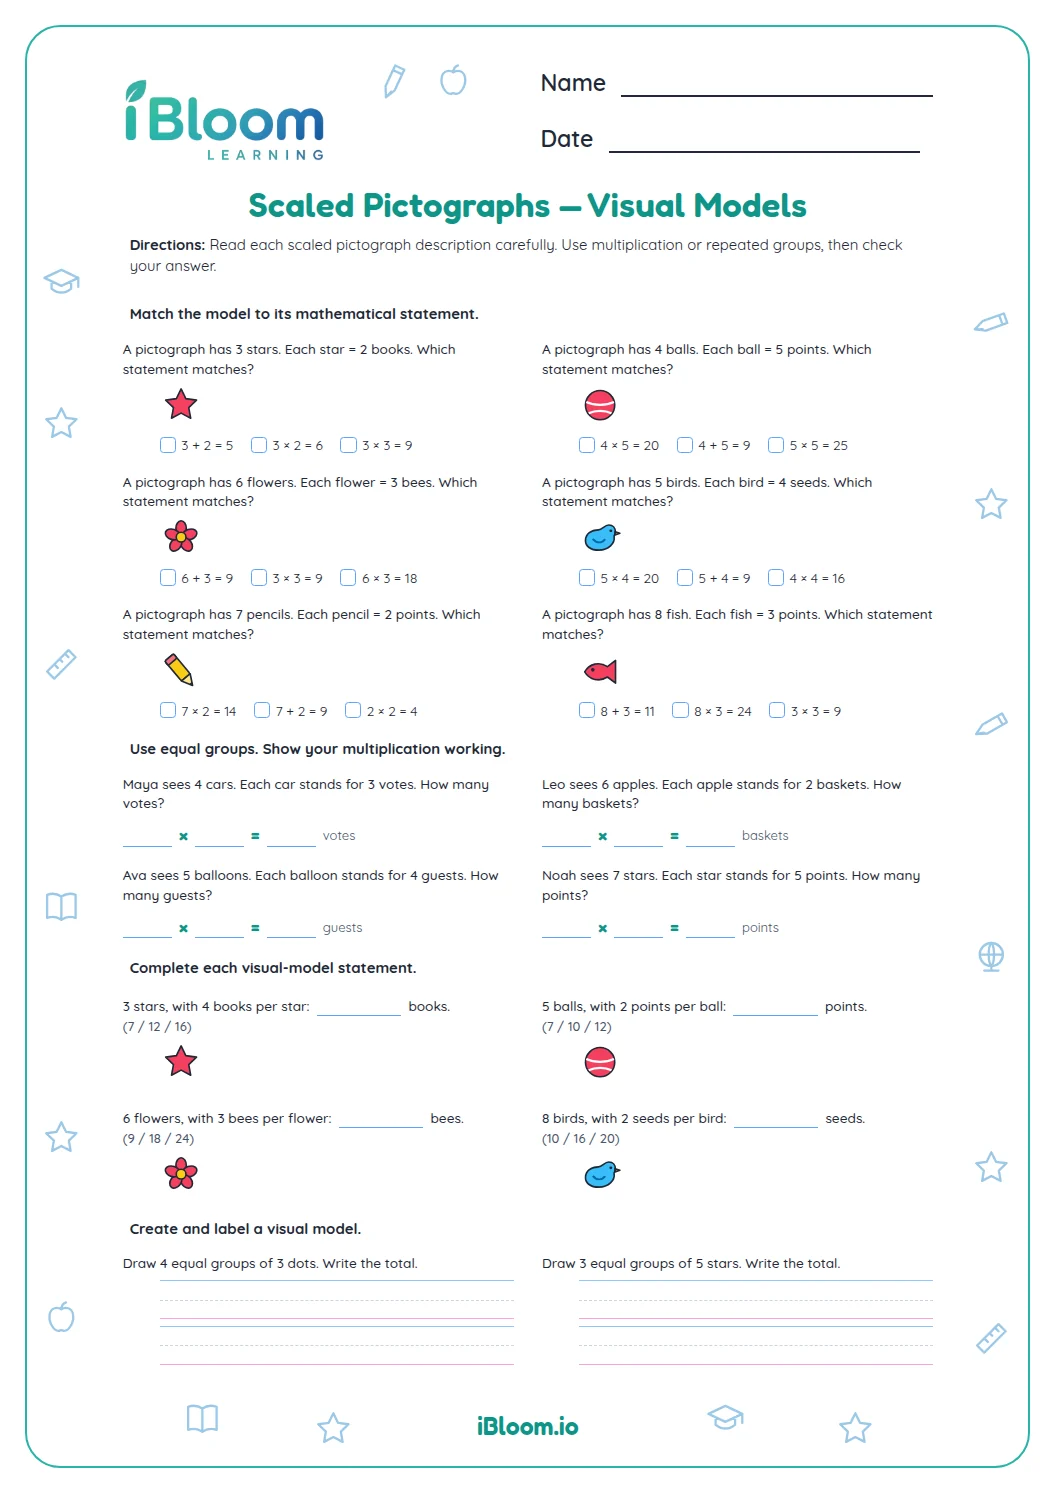
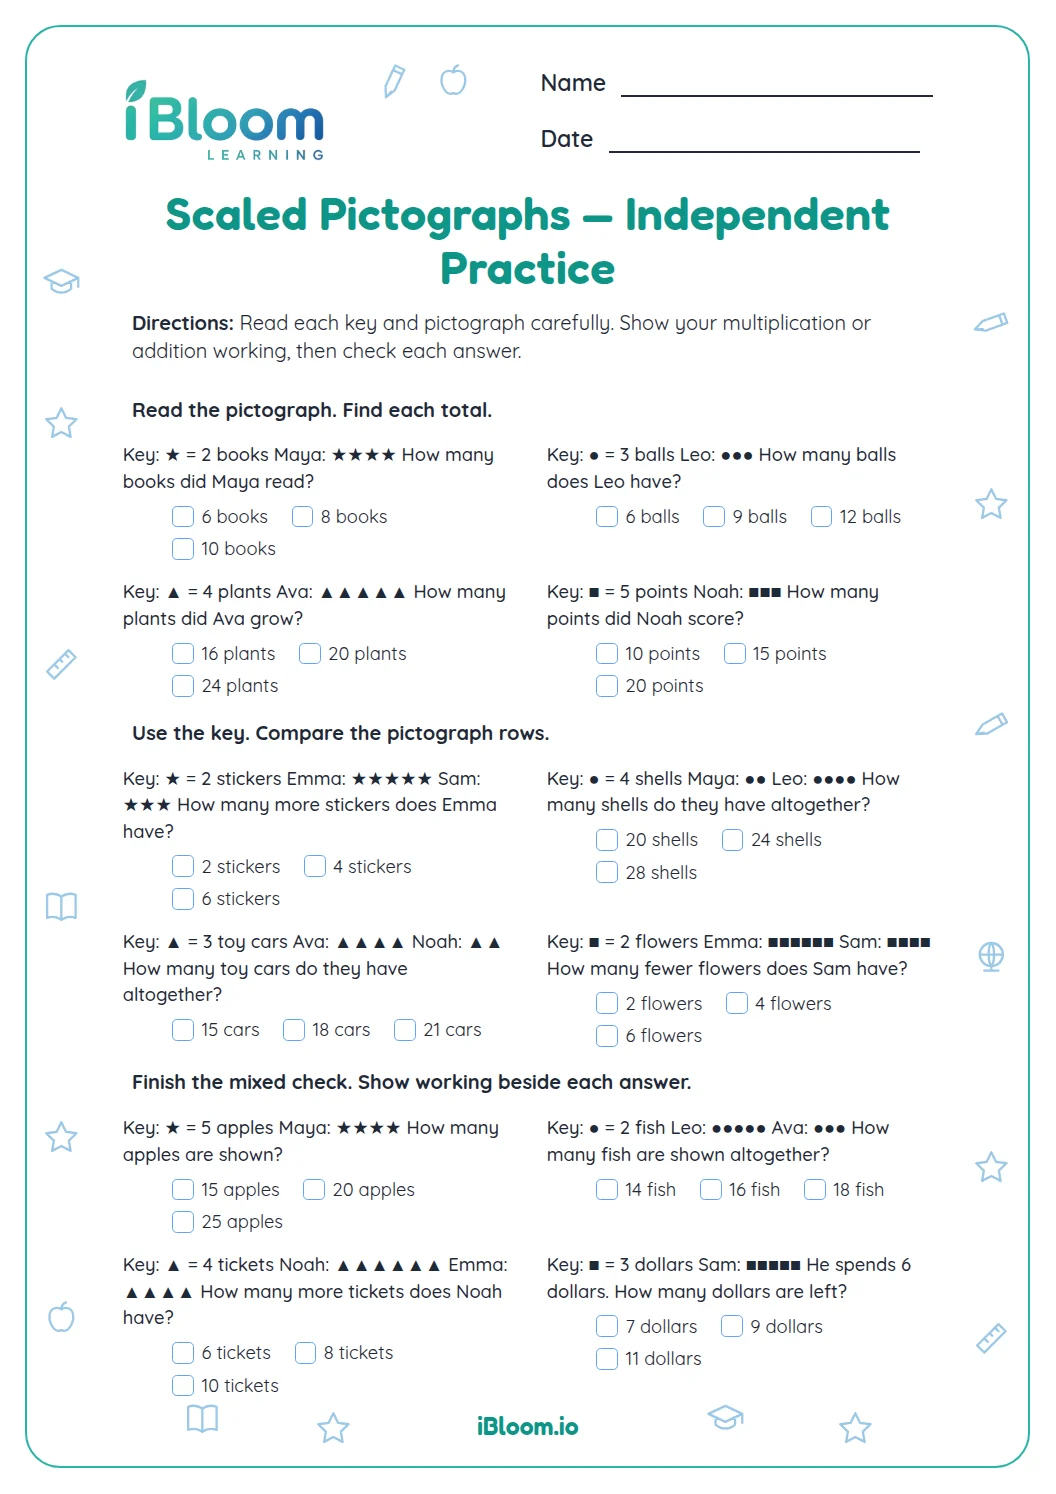
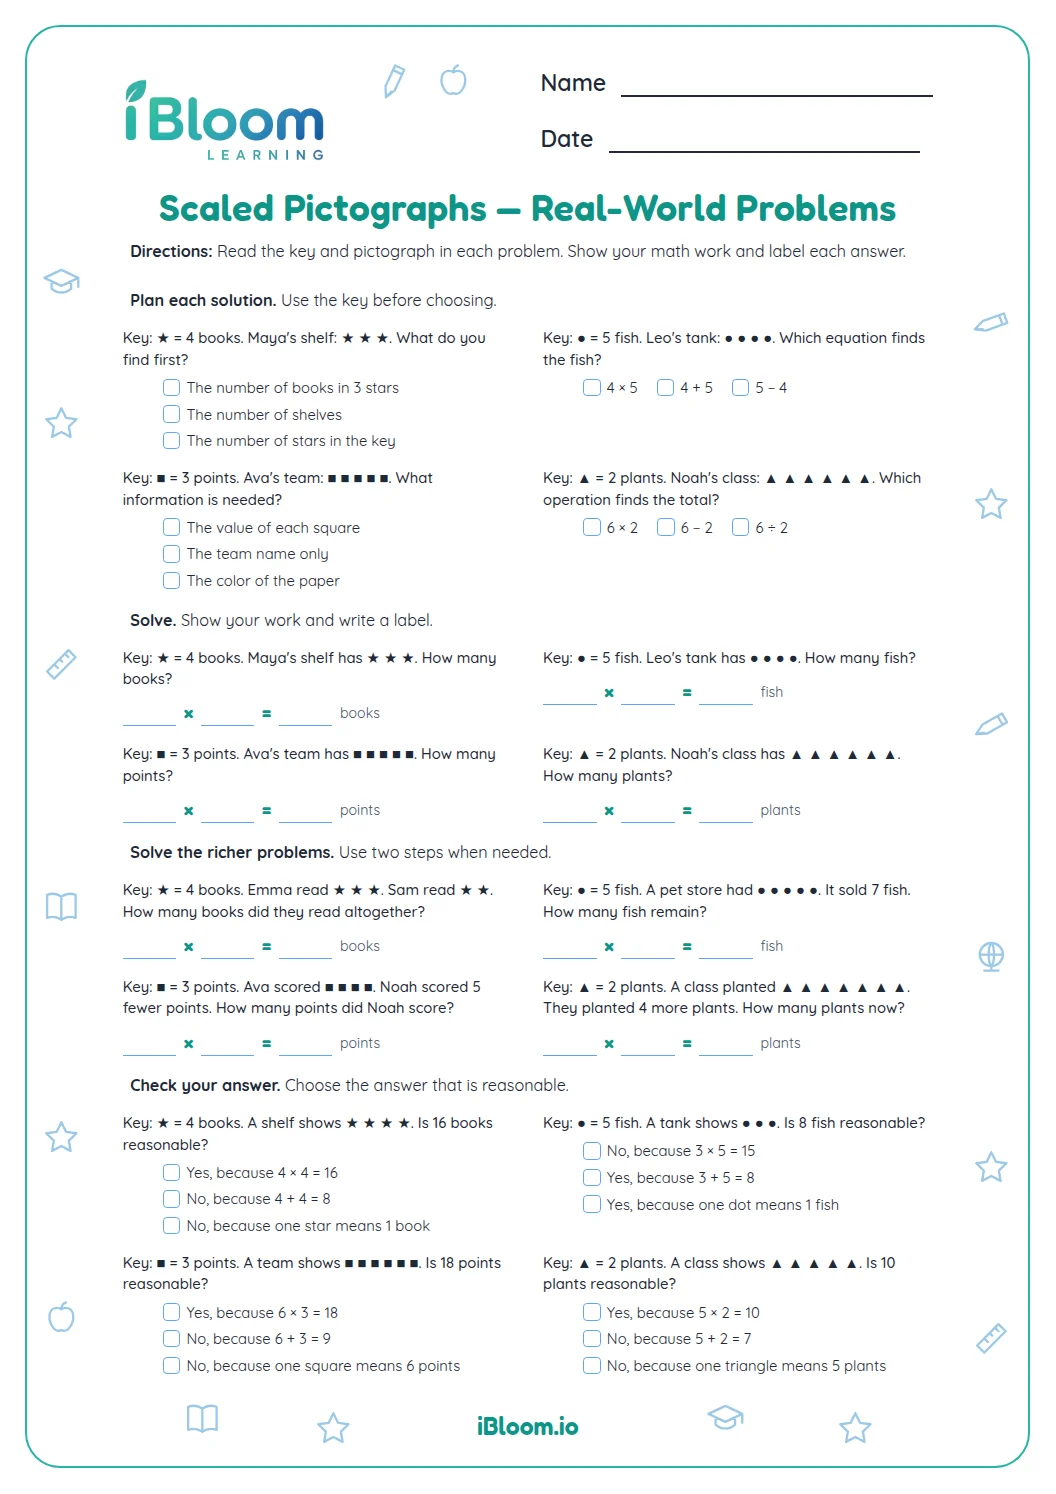
This free printable Grade 3 worksheet introduces scaled pictographs with pictures and symbols. Part A starts with one book picture for two books, then gives three new keys: a star for three pencils, a circle for four flowers, and a square for ten tickets. Part B uses one apple picture for five apples. In Part C, students draw a sticker graph using one circle for two stickers. The fourteen questions practice scaled-picture-graph representation in Common Core 3.MD.B.3. A separate answer key gives totals and a checklist for the drawing.
Aligned to 3.MD.B.3
How do students use a pictograph key?
Read the key before counting a row. The Books Read key assigns two books to every book icon, so count 2, 4, 6 across Mia’s row. Questions 6–8 change the value of one symbol to three, four, or ten. In Part B, each apple icon means five apples. Read every new key before calculating.
- 1Books Read: each book picture = 2 books.
- 2Mia has 3 book pictures.
- 33 × 2 = 6 books.
How do children compare two rows?
First turn each row into the amount it represents. Mia’s three book icons represent six books, while Leo’s five represent ten. Leo read four more books. Subtracting the icon counts first also works, as long as the difference of two icons is then multiplied by two.
Question 13 combines two apple baskets before comparing them with the third. Students find 15 + 10 = 25 apples in the Red and Yellow baskets, then subtract the Blue basket’s 20 apples to get five more.
What should the child’s picture graph contain?
The final task gives Ava 4 stickers, Ben 8 stickers, and Cam 6 stickers. Children draw three labeled rows and use one circle for every two stickers: two circles, four circles, and three circles. They add the title Stickers and a key that says one circle means two stickers.
Keep the circles similar in size and begin each row at the same position. Those choices make the rows easier to compare, while the key tells the reader how to turn the drawings back into sticker totals.
How to use this worksheet
- 1Read the Books Read title, row labels, and key before answering Part A.
- 2Count each book picture as two books and write the totals.
- 3Use the keys in questions 6–8 to multiply the symbol counts by three, four, and ten.
- 4Start Part B by reading its new key: one apple picture means five apples.
- 5For question 13, add the Red and Yellow totals before comparing with Blue.
- 6Draw the sticker pictograph with its title, labels, circles, and key; check your drawing and answers.
Mistakes to notice and fix
The mistake
Writing 3 books for Mia because her row has three pictures.
The fix
Use the key: 3 pictures × 2 books = 6 books.
The mistake
Continuing to count by twos in the apple pictograph.
The fix
Pause at the new key and count 5, 10, 15 for the Red basket.
The mistake
Drawing eight circles for Ben’s eight stickers.
The fix
Group the eight stickers in pairs; one circle represents each pair, so Ben needs four circles.
Curriculum alignment
Represent category totals in a picture graph using a key greater than one.
On this sheet: Students interpret keys of two, three, four, five, and ten, then draw a scaled picture graph for three sticker collections.
Show the official wordingHide the official wording
Draw a scaled picture graph and a scaled bar graph to represent a data set with several categories. Solve one- and two-step “how many more” and “how many less” problems using information presented in scaled bar graphs. For example, draw a bar graph in which each square in the bar graph might represent 5 pets.
What to practice next
Make more practice
Further reading
Questions parents and teachers ask
What scales are used on this worksheet?
The worksheet uses keys of two, three, four, five, and ten. Books count by twos; stars represent three pencils, circles represent four flowers, and squares represent ten tickets. Apples count by fives. The final sticker graph returns to two stickers per circle, so every new key matters.
How many books did each child read?
Mia read 6 books, Leo read 10 books, and Zoe read 4 books. Their rows contain three, five, and two book pictures, respectively, with each picture worth two books. These totals make 20 books altogether, and Leo’s total is four more books than Mia’s total.
Why is the answer to question 13 five apples?
The Red basket has 15 apples and the Yellow basket has 10, for a combined total of 25. The Blue basket has 20 apples. Subtracting 20 from 25 gives five more apples. Students need both the addition and the subtraction to answer this comparison correctly.
What should the sticker graph look like?
It should have a Stickers title, rows labeled Ava, Ben, and Cam, and a key showing that one circle means two stickers. Ava’s row has two circles, Ben’s has four, and Cam’s has three. The key lists those counts so an adult can check the drawing.
Can children subtract picture counts instead of totals?
Yes, if they convert the difference back into the quantity represented by the key. Leo has two more book pictures than Mia, and each picture means two books, so the difference is four books. Writing only two would give the difference in pictures rather than the requested number of books.