
About this worksheet
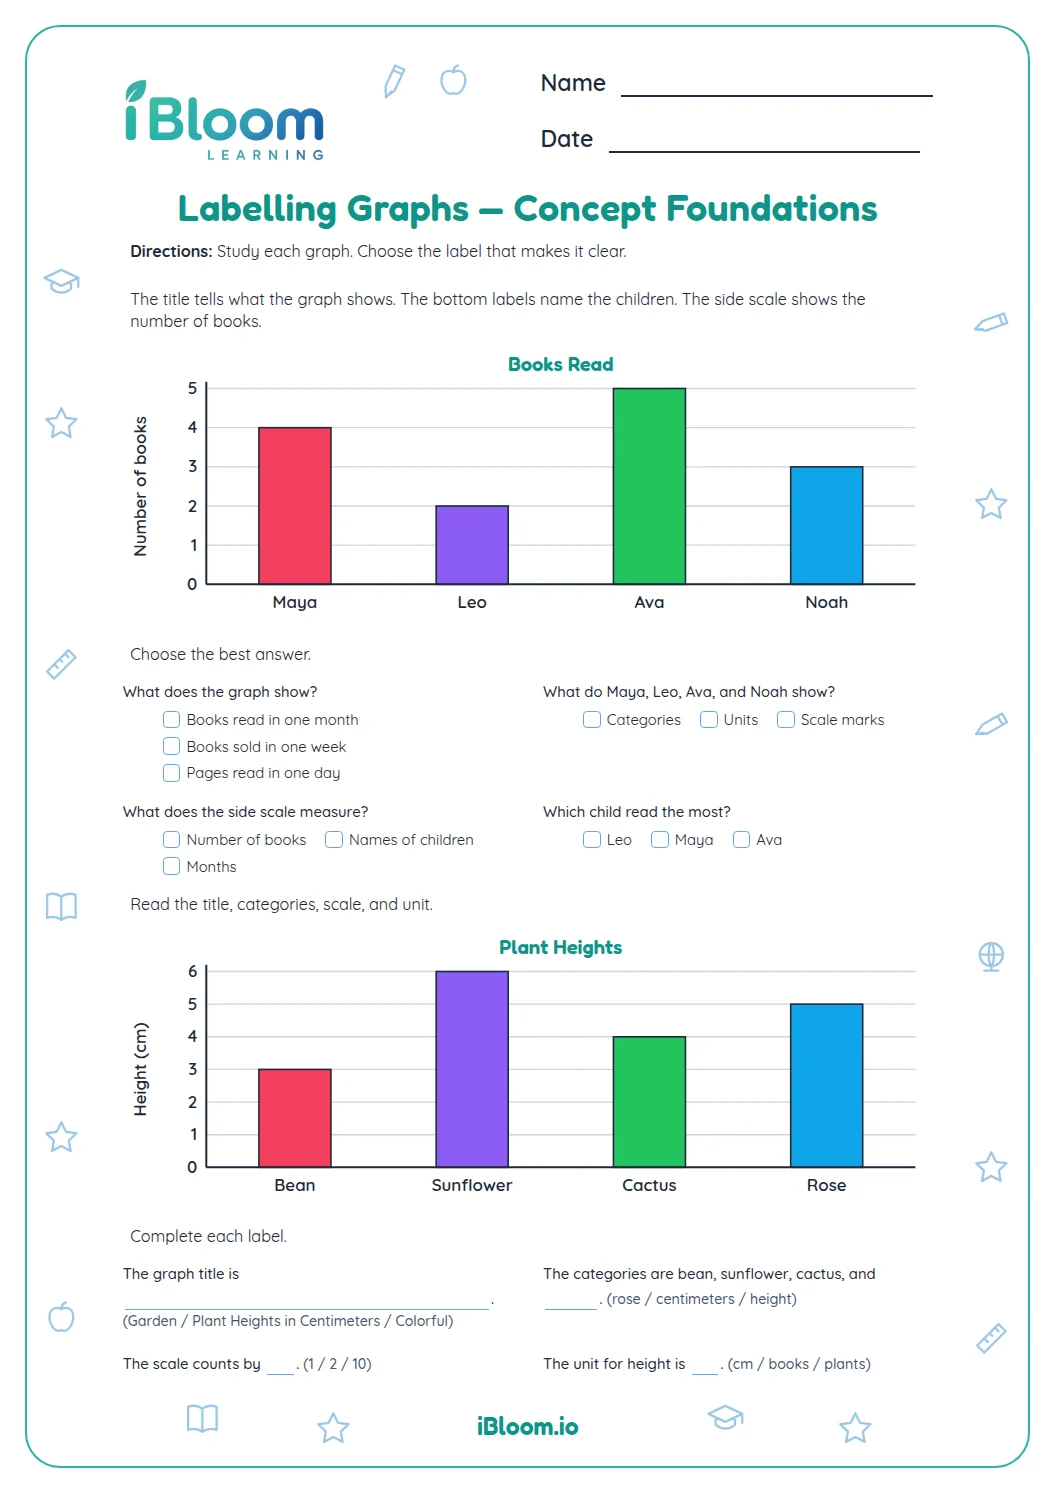
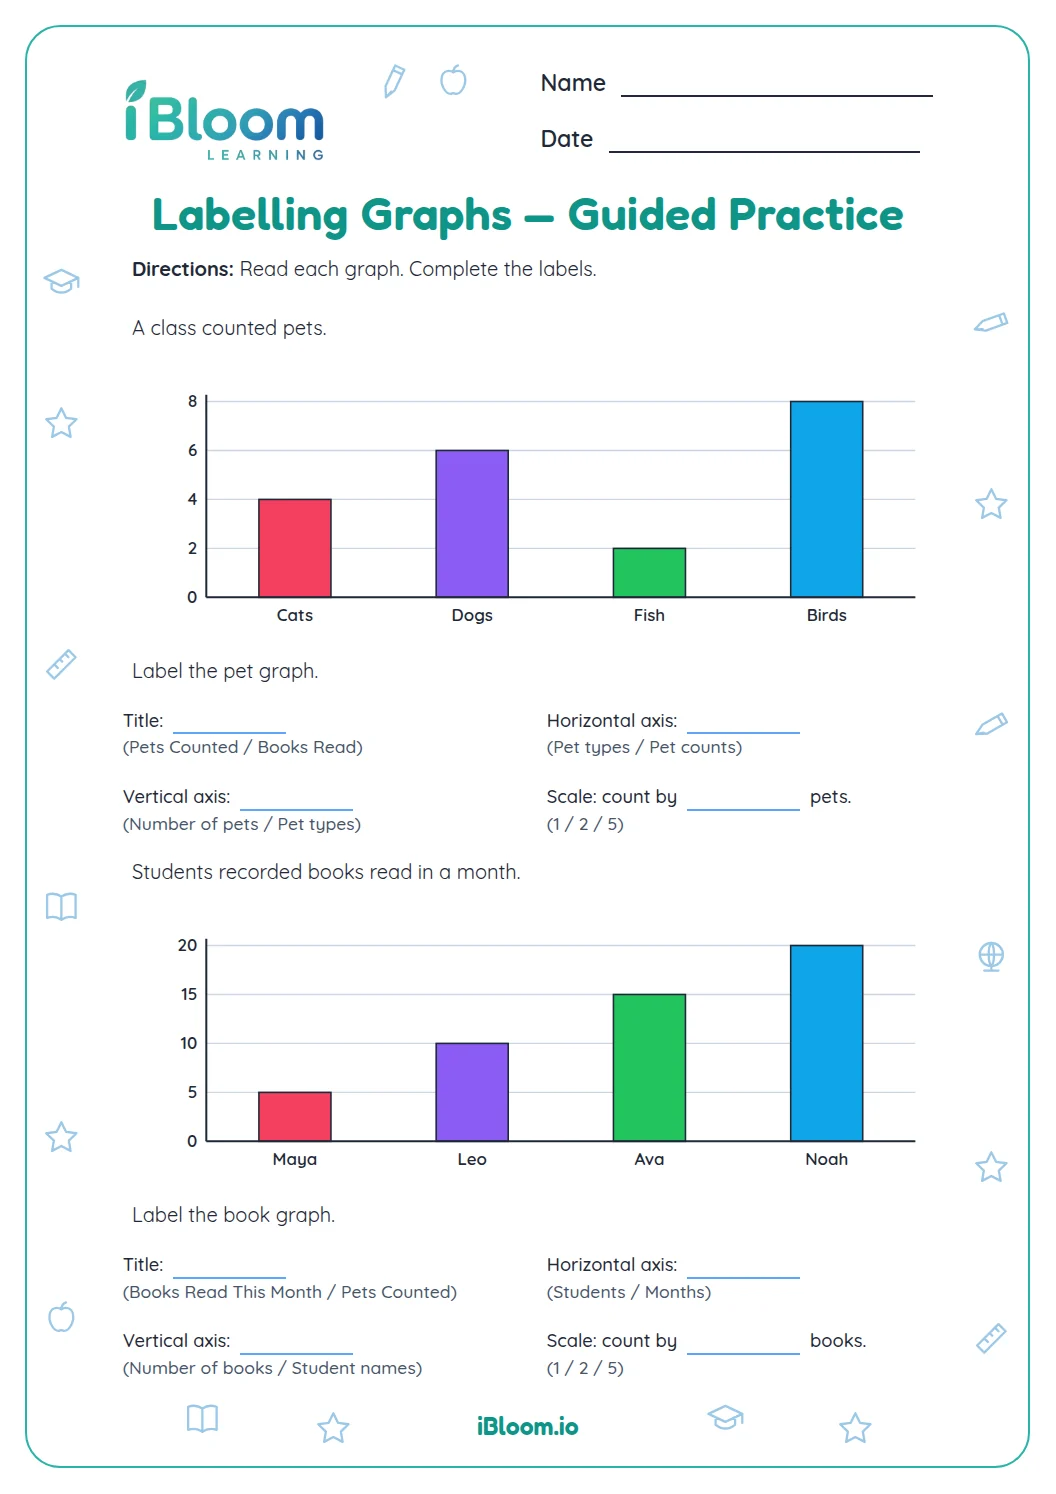
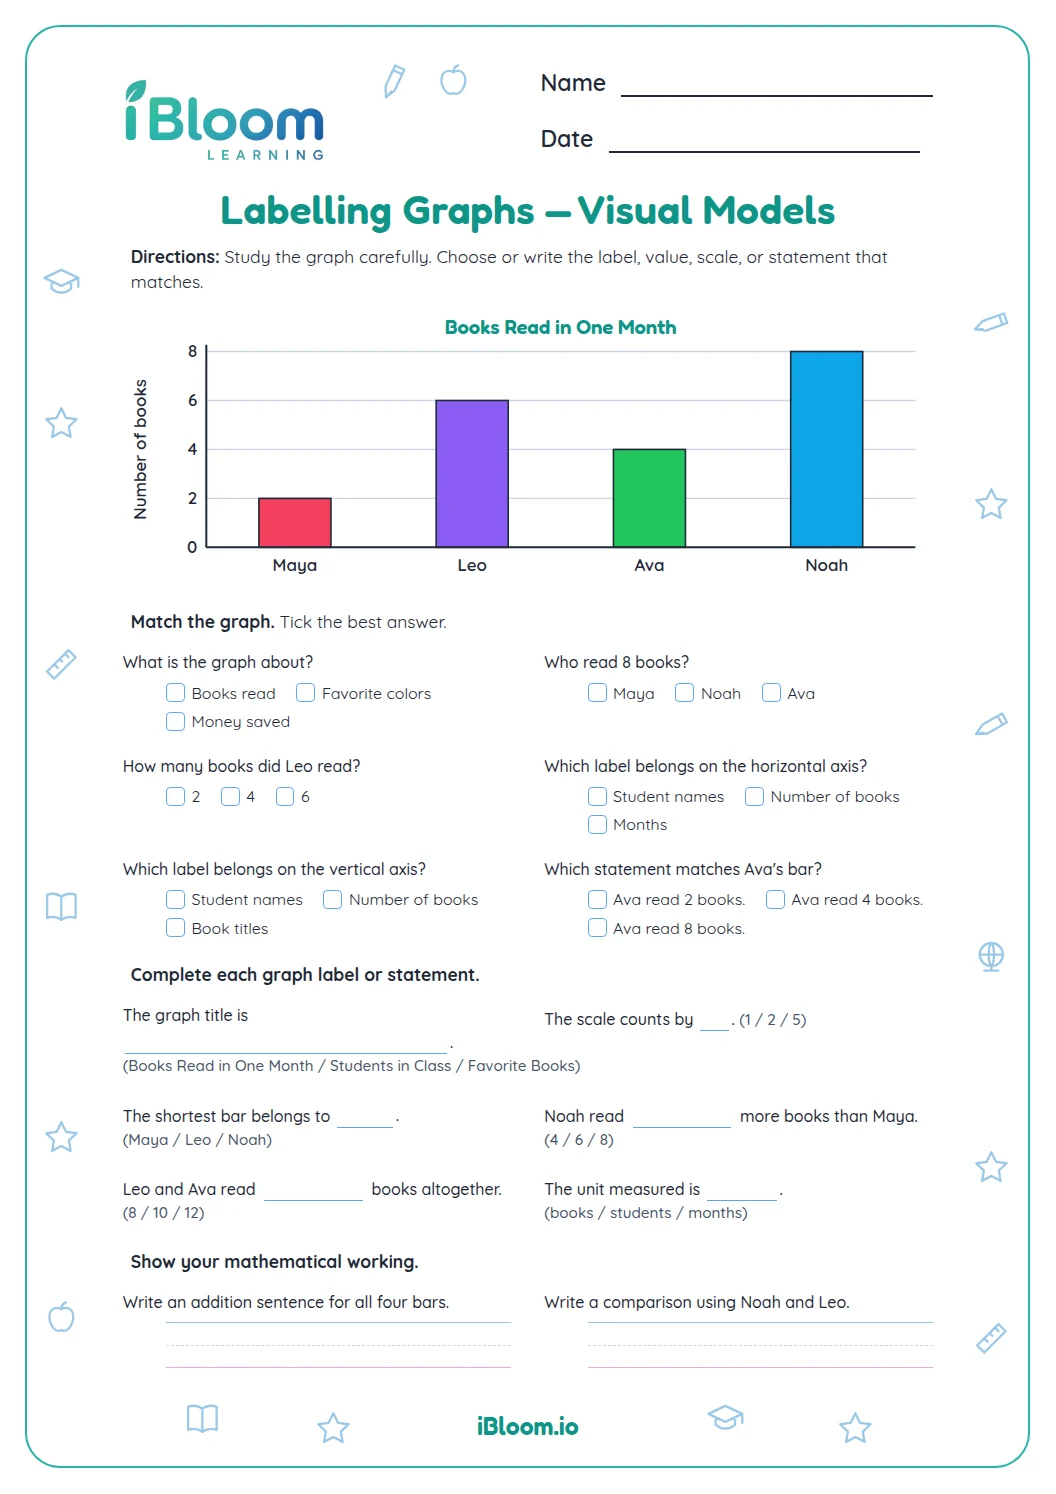
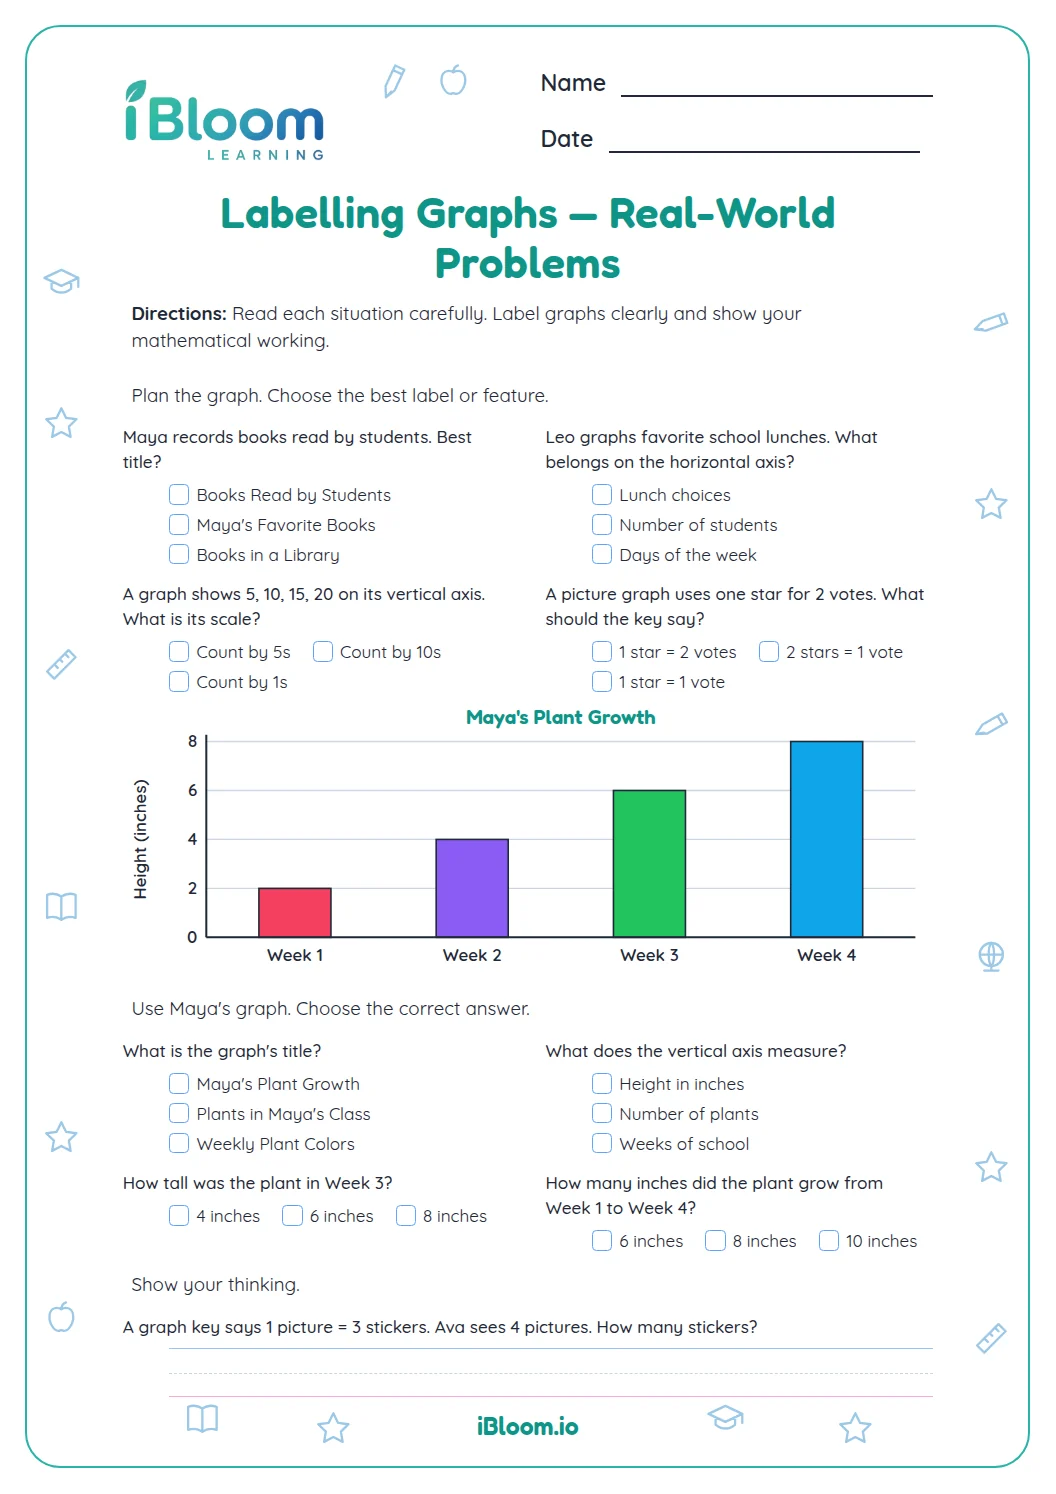
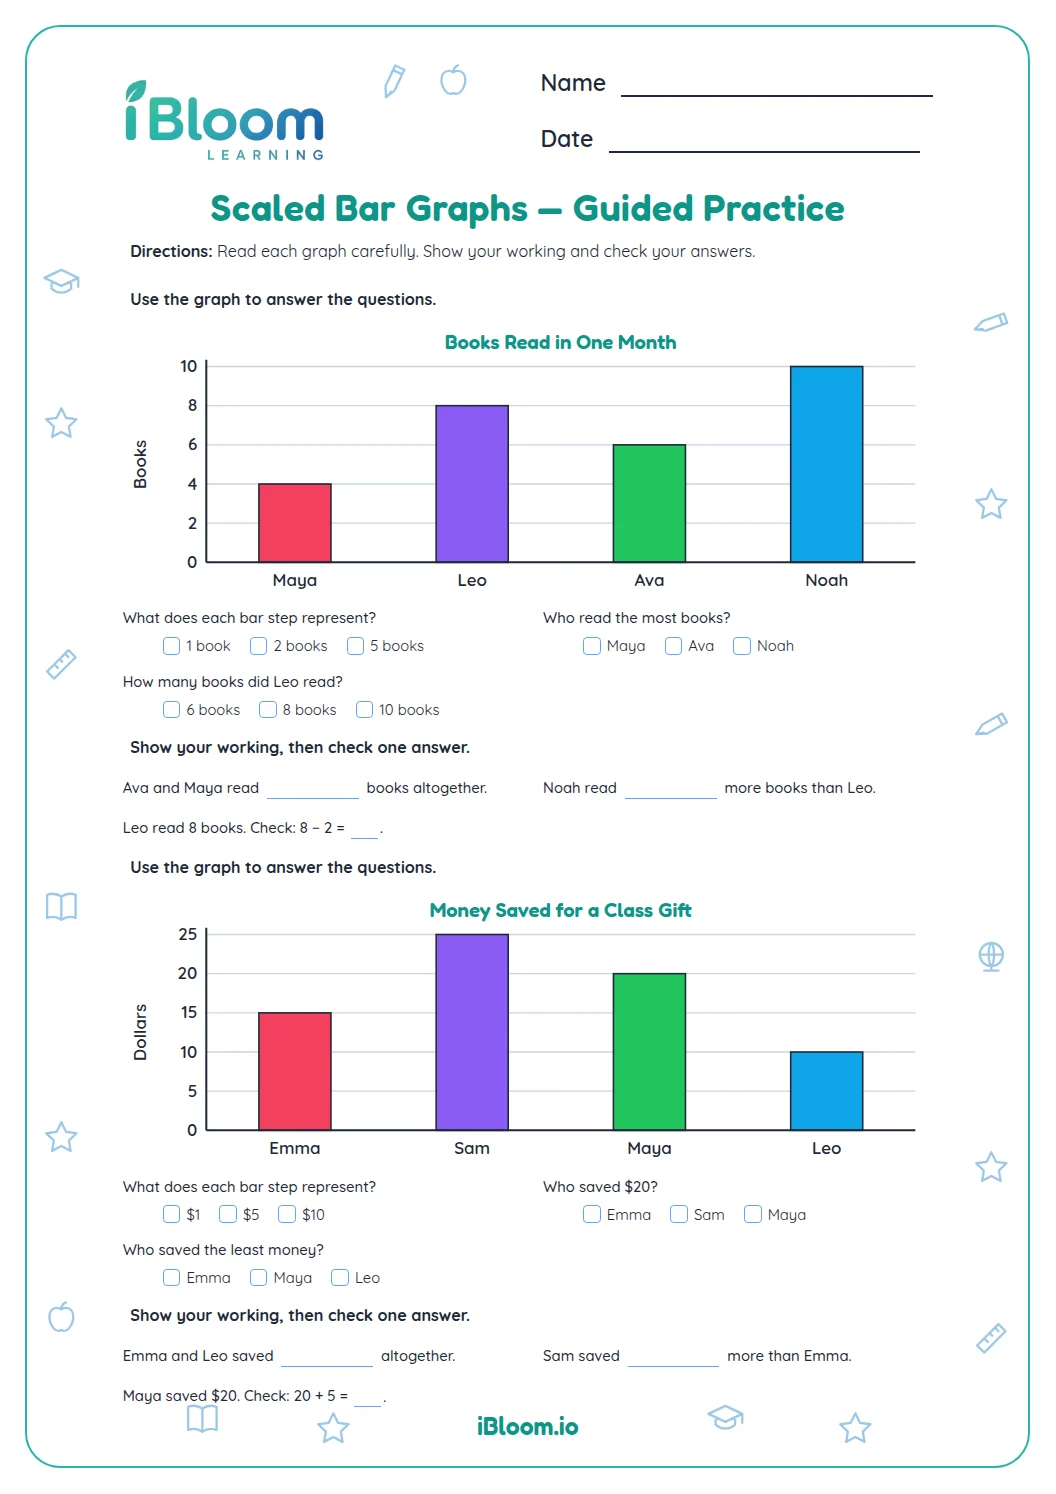
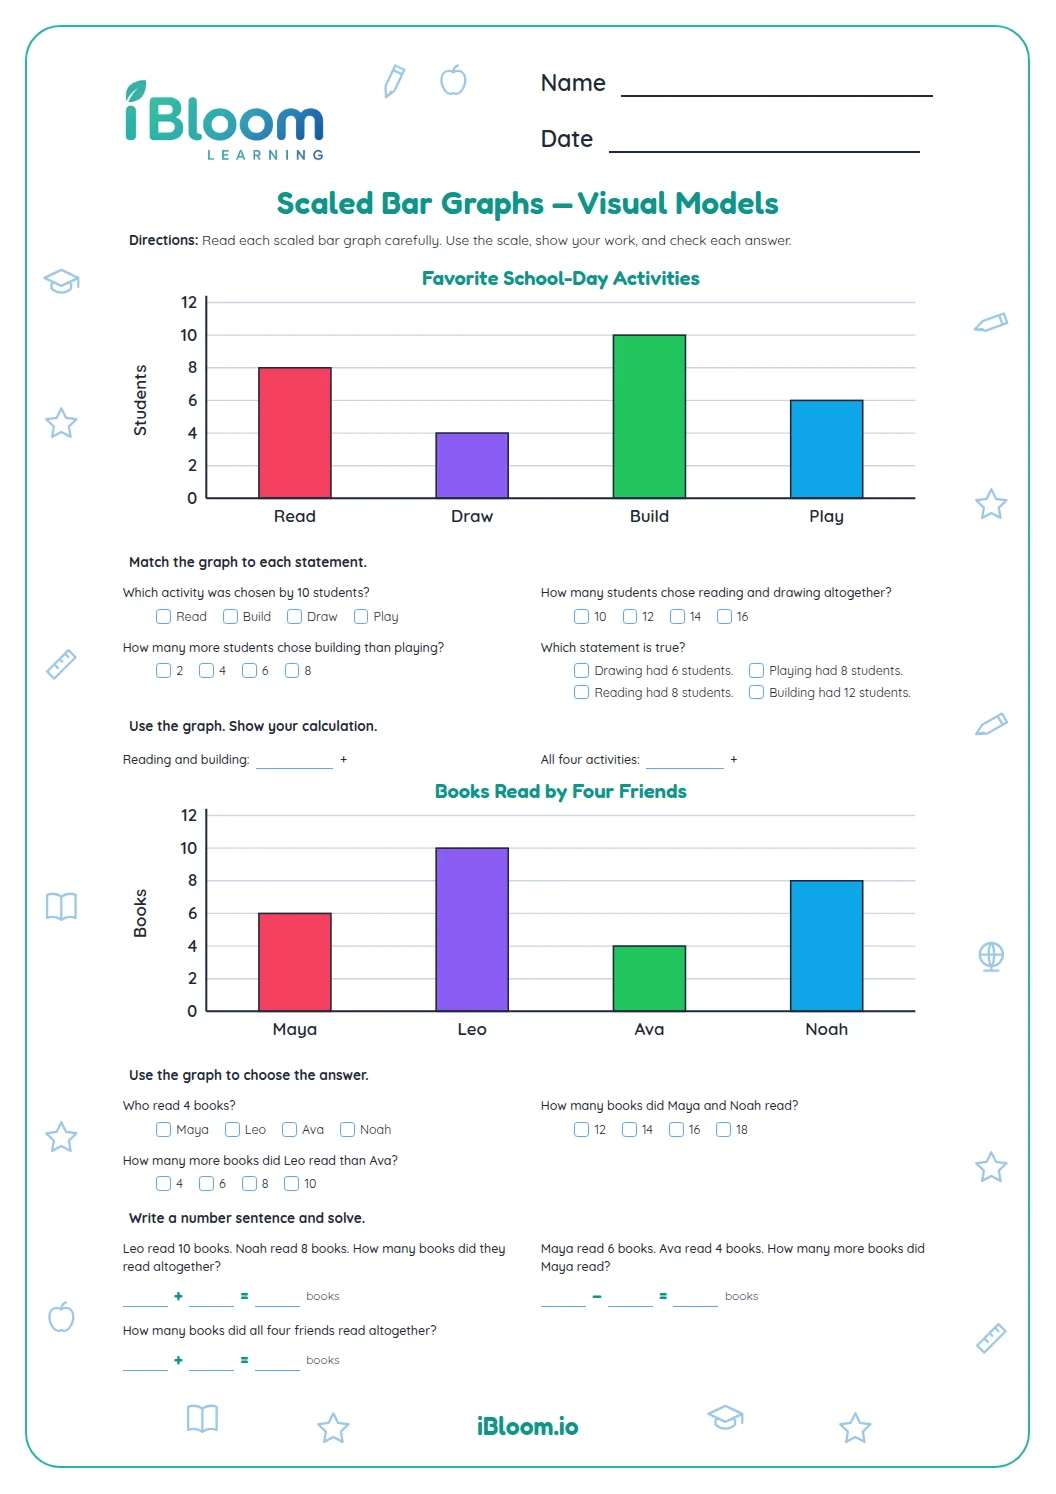
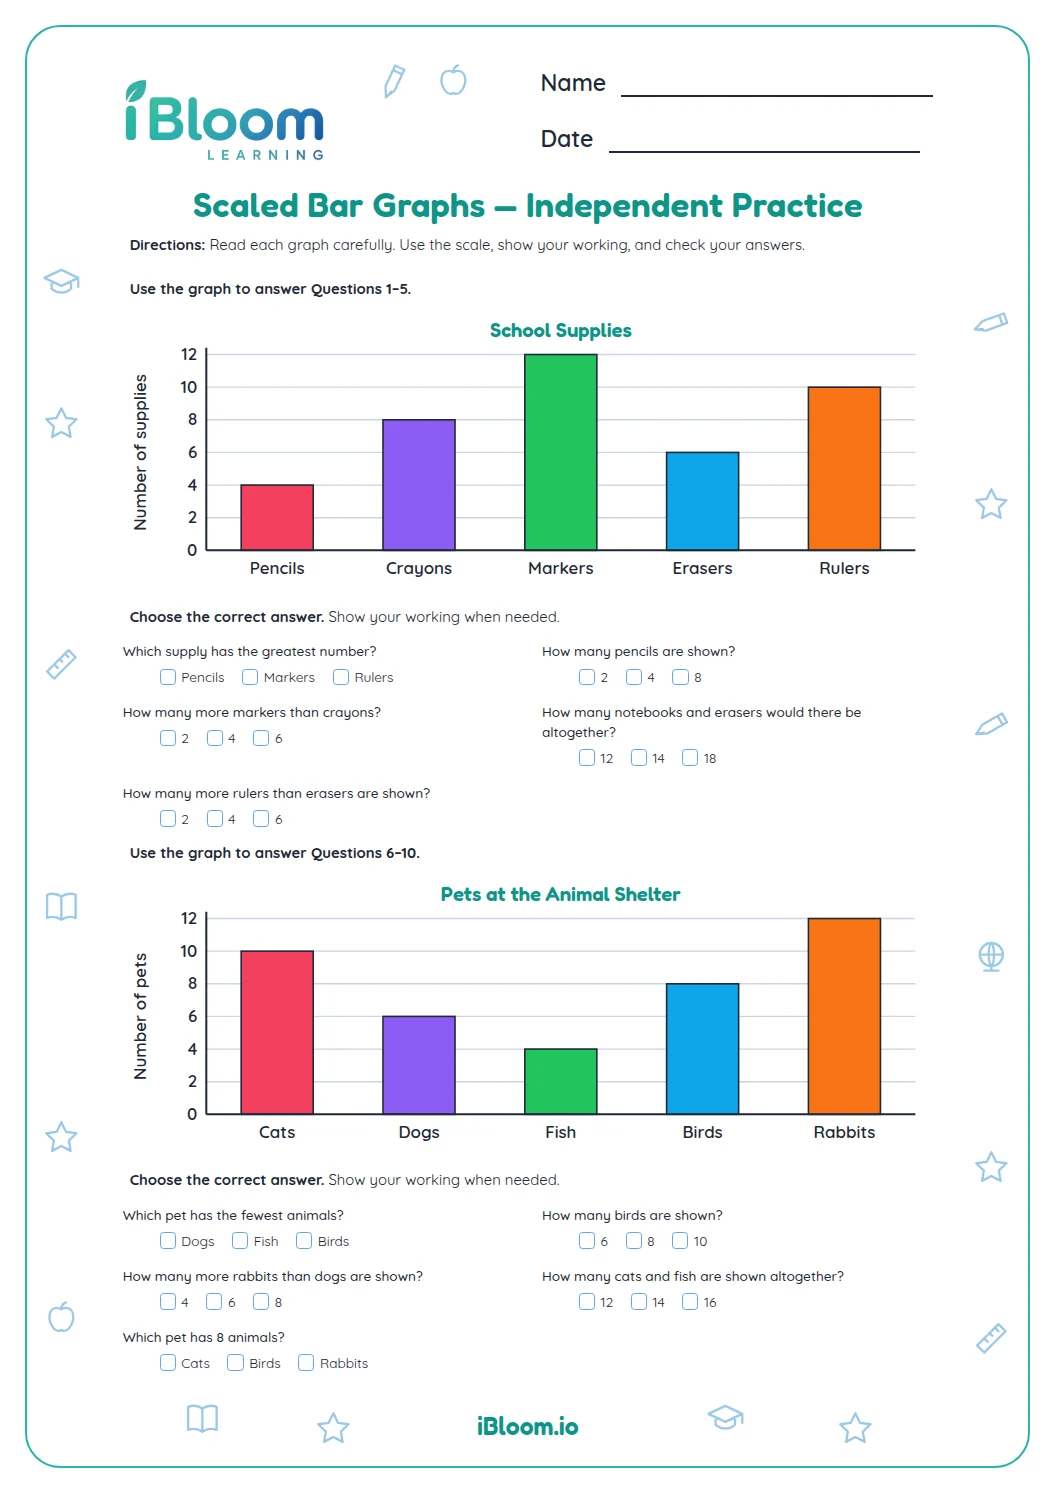
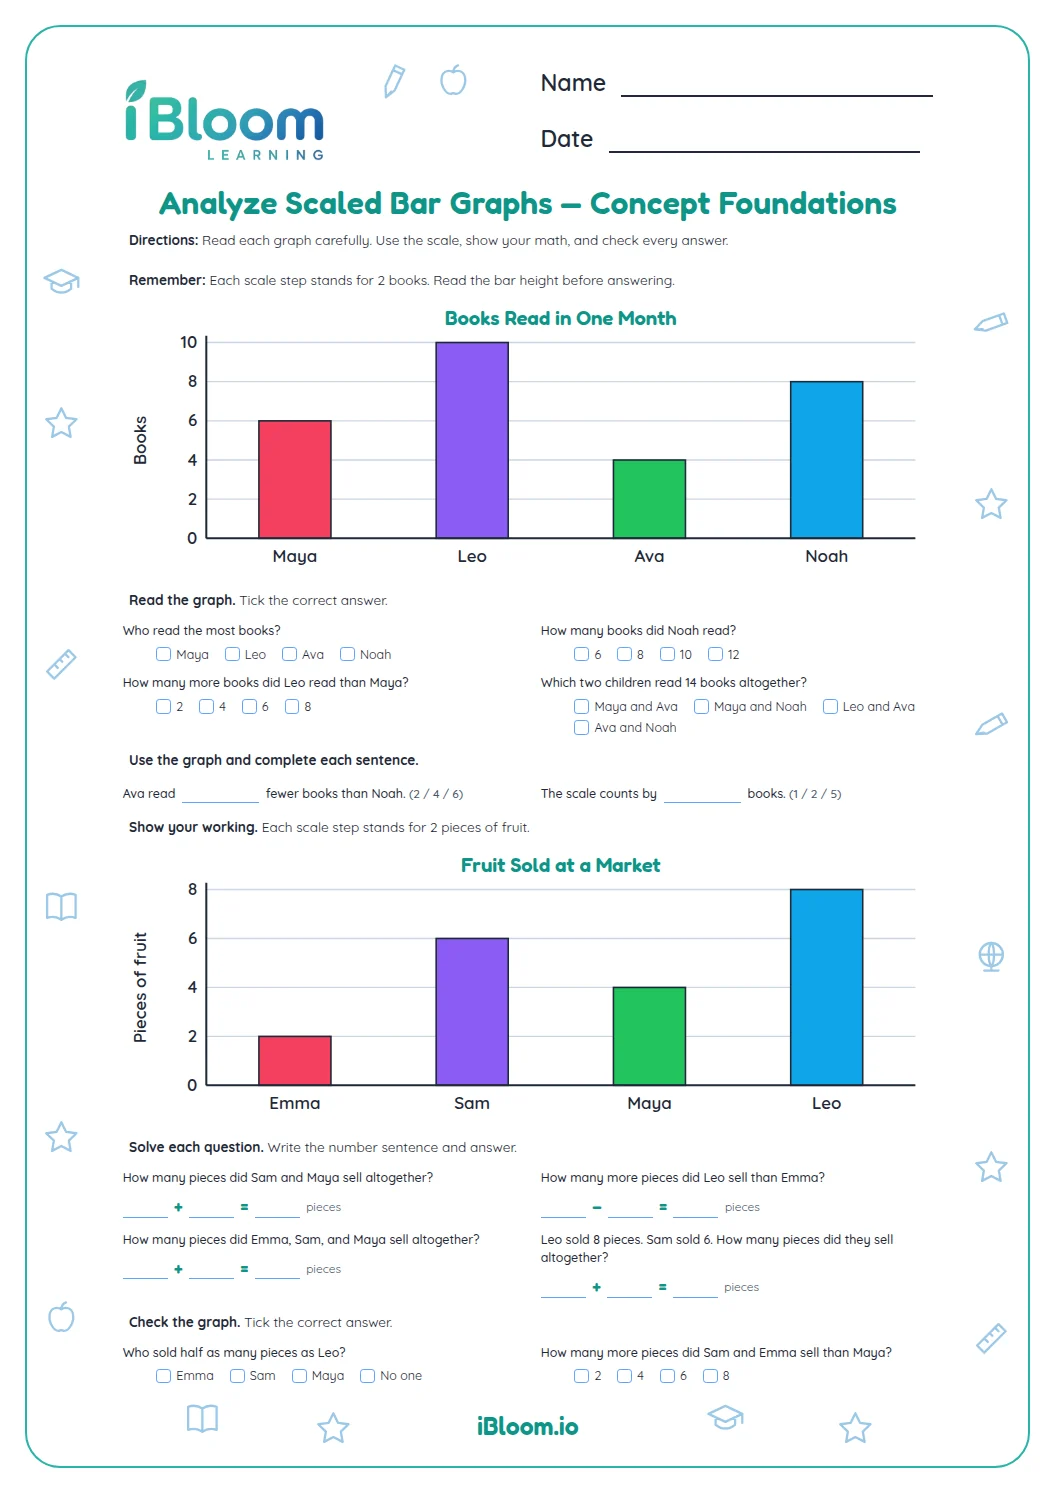
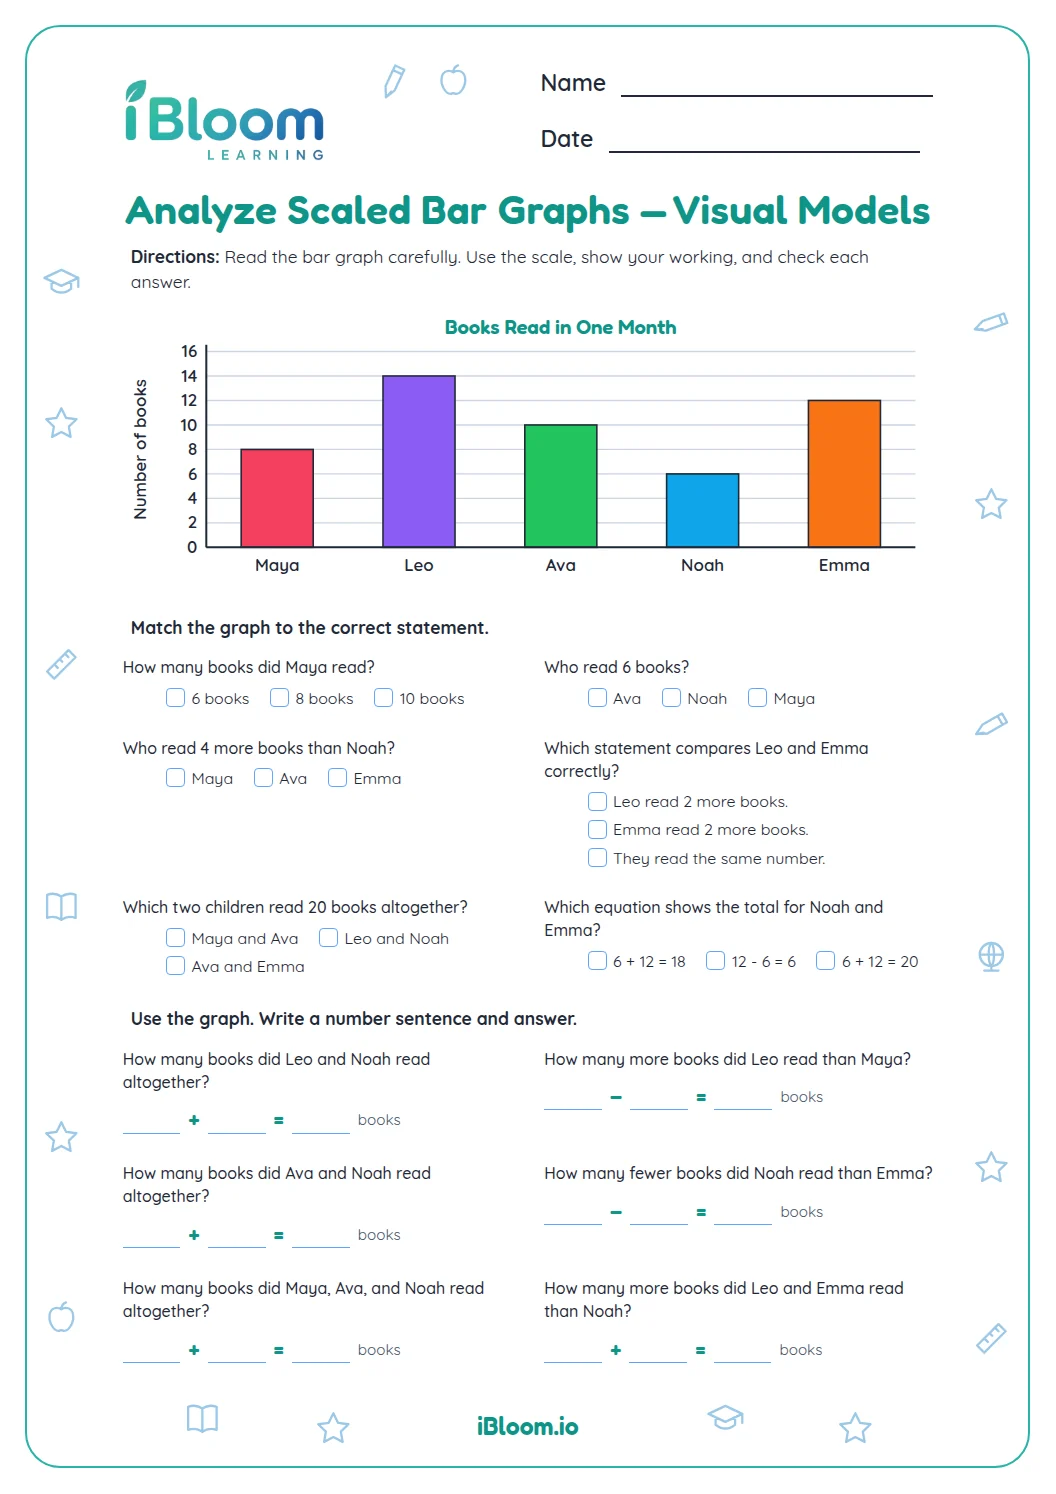
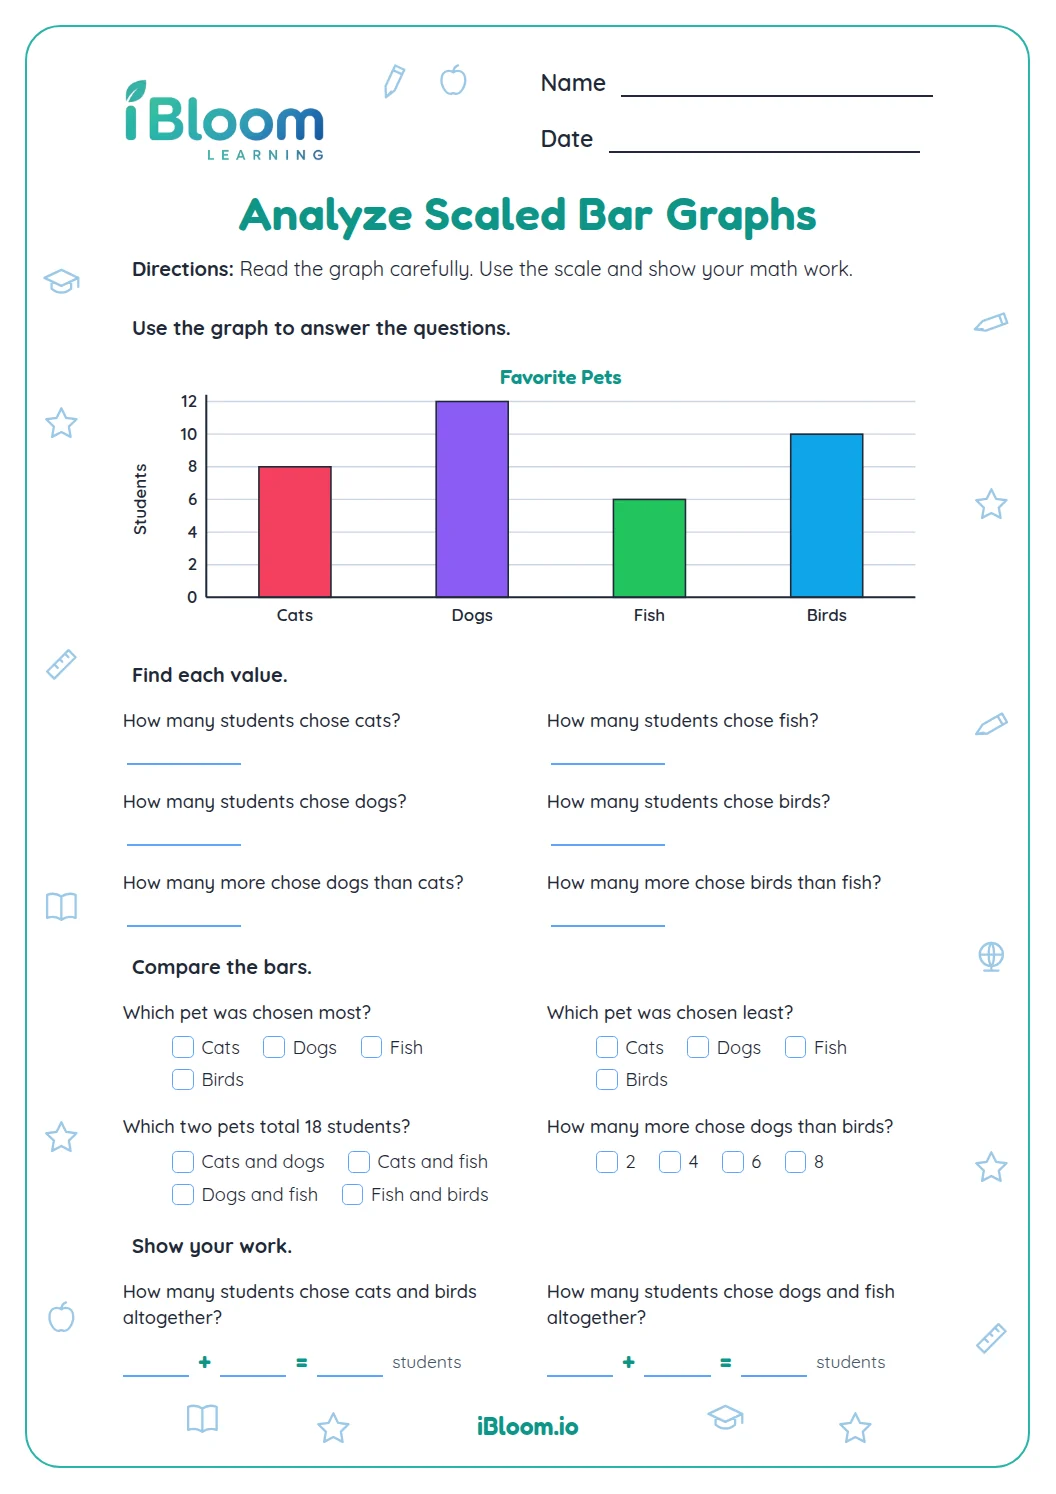
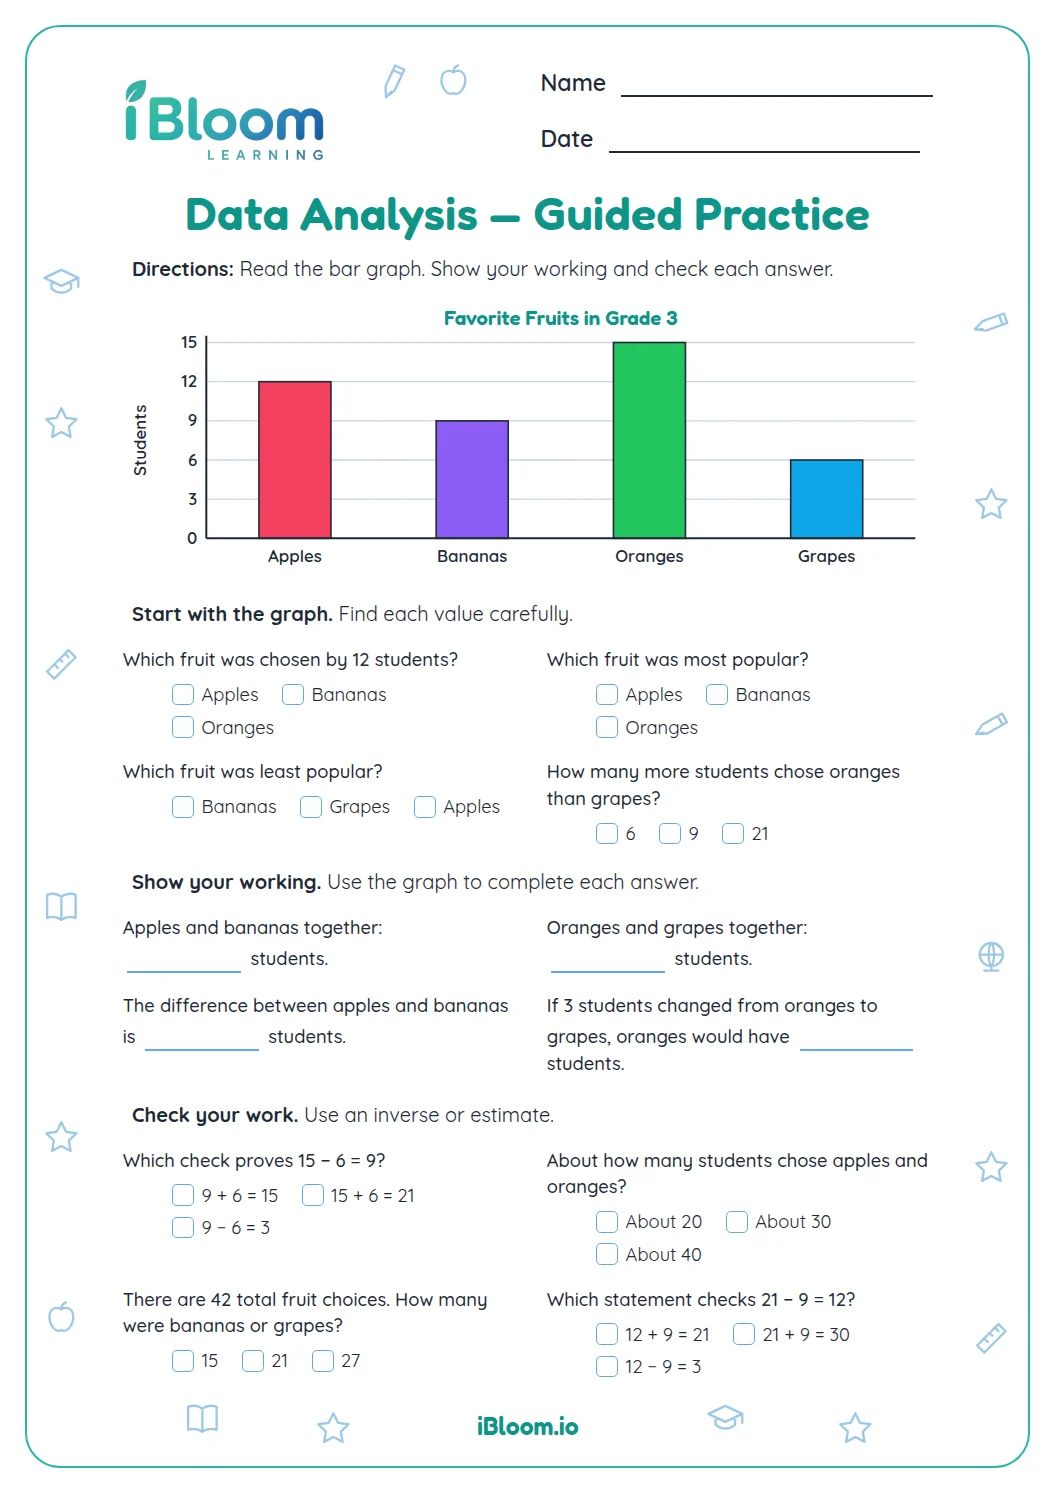
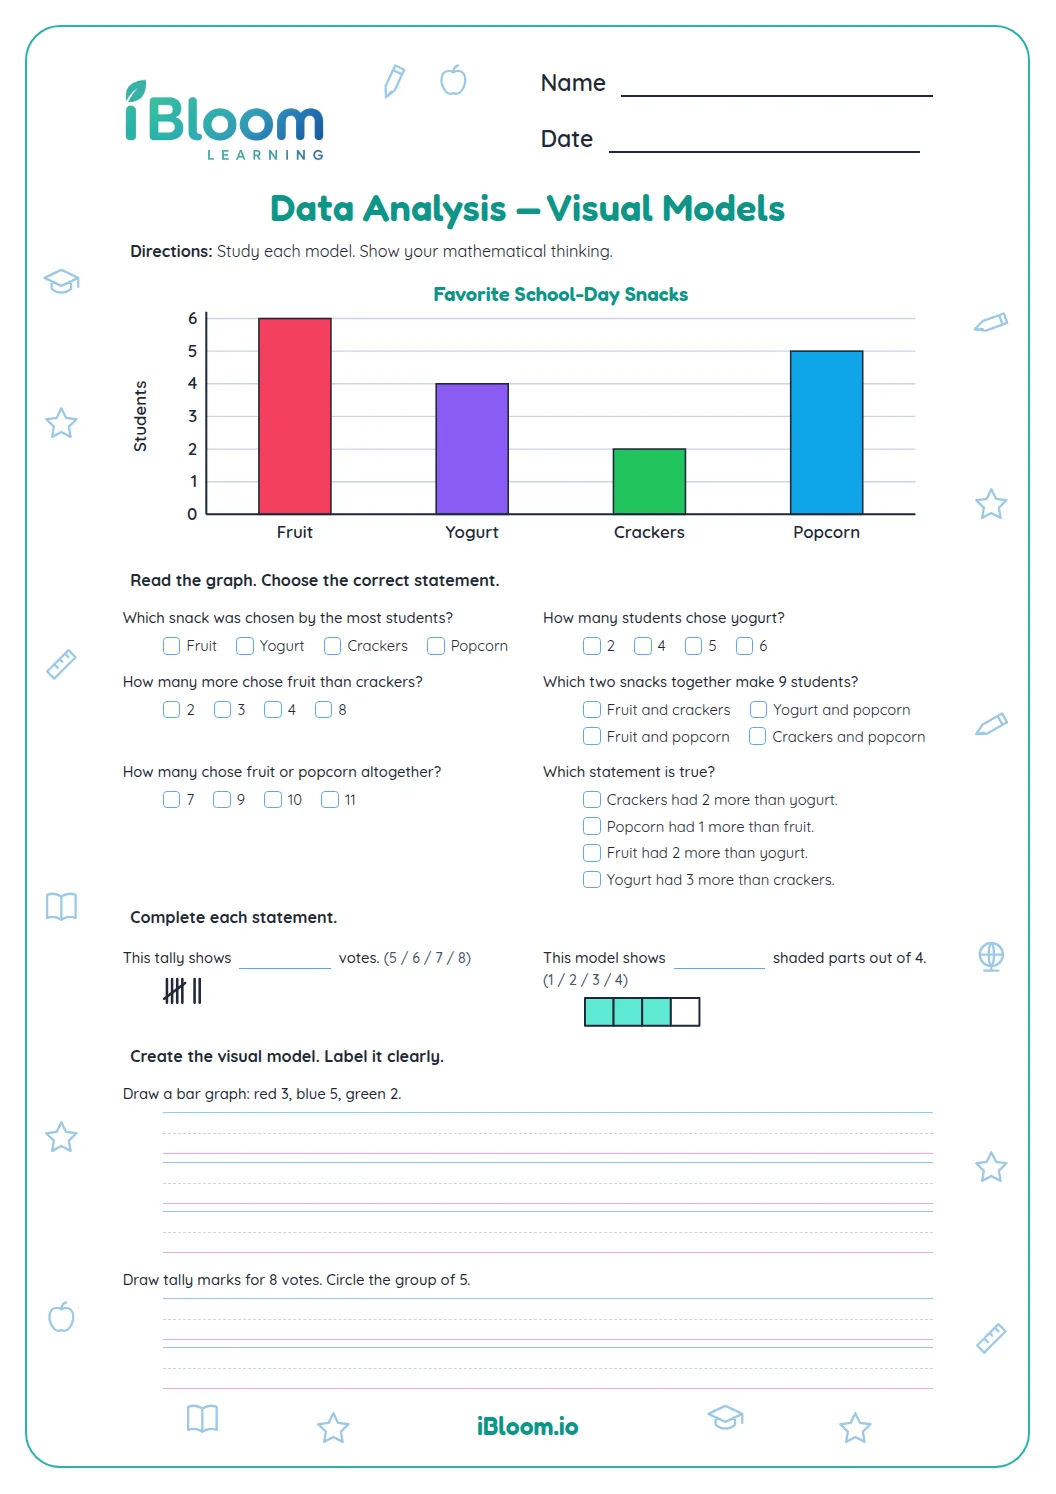
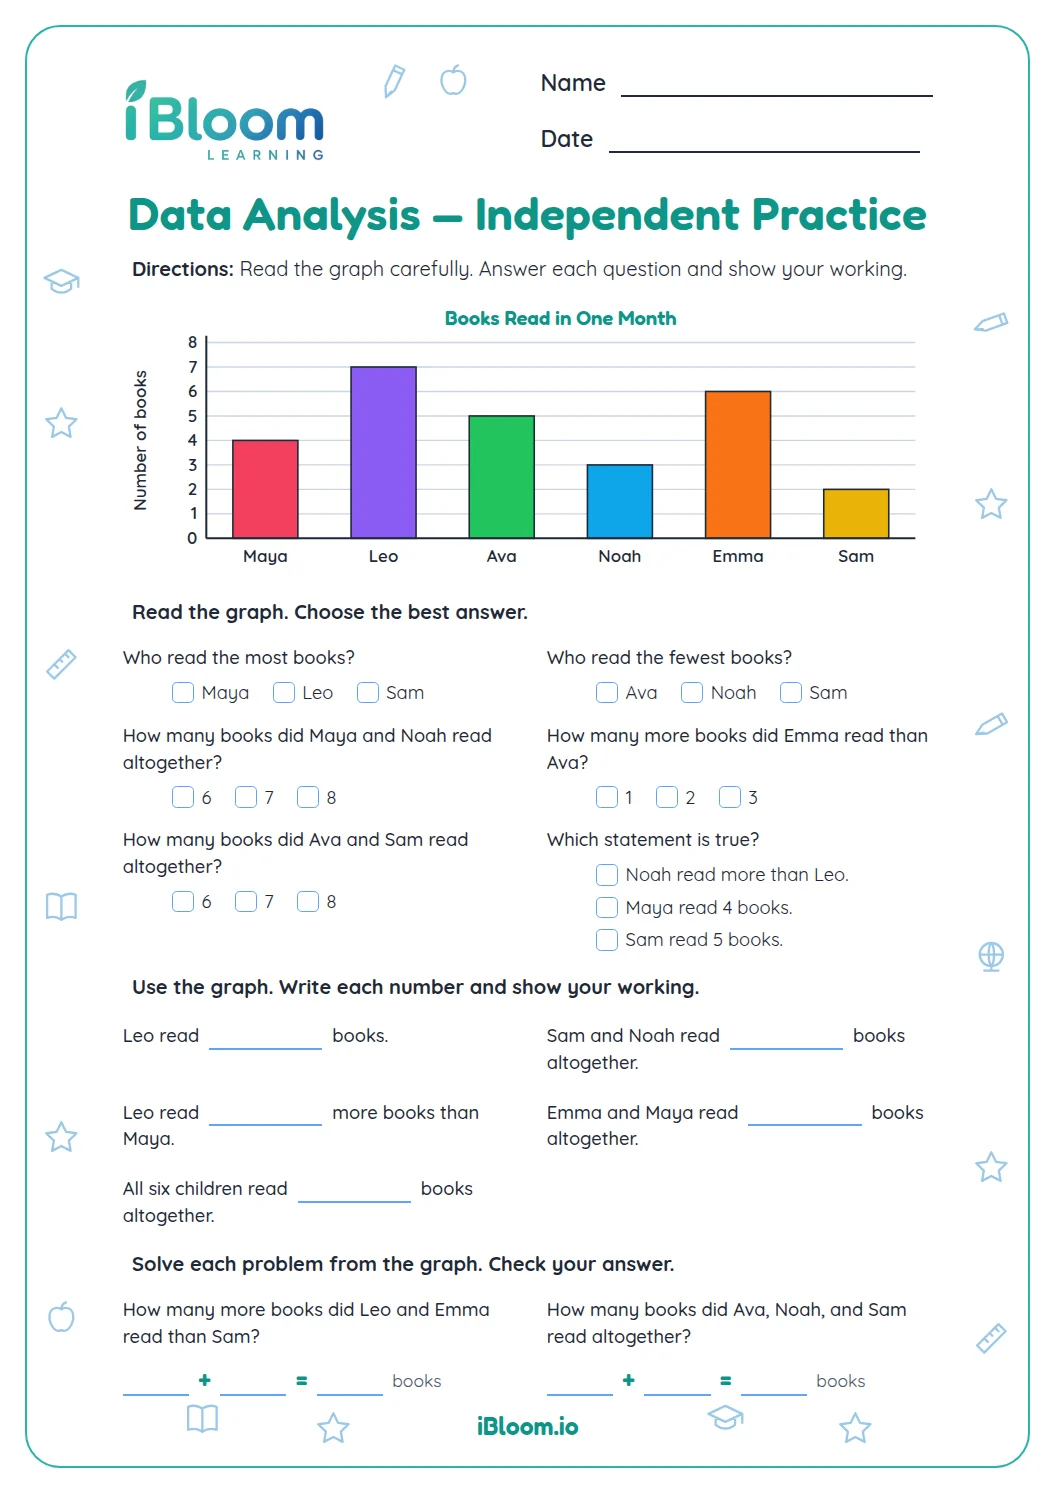
This Grade 3 printable builds graph-reading and graph-labeling reasoning with a scaled bar graph about books read. Students read a scale of two, identify the graph title and axis labels, compare values, and find totals. The 14 questions move from reading single bars to using several labels and values together. A separate answer key supports checking. The work aligns with CCSS 3.MD.B.3 because students use information from a scaled bar graph to answer comparison and total questions.
Aligned to 3.MD.B.3
How do students read the graph labels and scale?
The graph gives one data set about four students’ books. Read the vertical scale by twos, then match each bar to the student named below it.
- 1Ben’s bar reaches 8 on the vertical scale.
- 2The title says Books Read, so Ben read 8 books.
- 3Check: the bar ends at the gridline labeled 8.
- Part A reads individual values and compares bars.
- Part B uses the labels and scale to answer multi-step questions.
How can students check their work?
Use the answer key after the student has tried each item. Ask them to point to the value, observation, or place-value step that supports a response.
How should I use the answer key?
Print the worksheet pages for practice and keep the key separate for checking. Review any missed item by finding the step that needs correction.
How to use this worksheet
- 1Read the graph title to find its topic.
- 2Read the horizontal labels to identify each category.
- 3Check the value-axis label and count its scale steps.
- 4Find the requested bar, then compare or combine values.
- 5Use a graph label or bar as evidence when explaining.
Common mistakes and quick fixes
The mistake
Counting gridlines as one book when the scale counts by twos.
The fix
Read the axis labels and count each step as 2 books.
The mistake
Mixing up a bar’s value and its category.
The fix
Read the student name directly below the bar.
The mistake
Adding values when the question asks how many more.
The fix
For a difference, subtract the smaller bar height from the larger one.
Curriculum alignment
Read a scaled bar graph and solve comparison and total questions from its data.
On this sheet: Students read a scale of two on a bar graph and solve one- and two-step questions about its data.
Show the official wordingHide the official wording
Draw a scaled picture graph and a scaled bar graph to represent a data set with several categories. Solve one- and two-step "how many more" and "how many less" problems using information presented in scaled bar graphs.
What to practice next
Make more practice
Further reading
Questions parents and teachers ask
What does this graphing worksheet ask students to do?
Students read a scaled bar graph about books read by four students. They identify what the title and axes mean, use a scale that counts by twos, and answer comparison and total questions from the bars. Have the student point to a bar and name its category before answering.
How many questions are on the sheet?
There are 16 questions. The first set focuses on reading bar heights; the second asks students to use the graph title, category labels, axis label, and scale to explain or calculate more facts. Students can record each value, then use the key to check their work.
What does the scale count by?
Each step on the vertical axis represents 2 books. A bar that reaches 8 therefore represents eight books, even though the graph’s grid steps are labeled by twos. The bar at 8 reaches its gridline, so no extra scale step is needed.
Does the worksheet include an answer key?
Yes. The key gives the expected answer for each question, including a sample response for the prompt about a useful graph label. Students can point to the bar or label that supports each answer. A useful label explains the topic, category, or unit being measured.
How can I help a student who misreads a bar?
Have the student find zero first, then count the scale marks by twos until reaching the top of the bar. Next, reread the category label below it so the value is connected to the right student. Counting upward by twos from zero helps locate the exact height of a bar.