



About this worksheet
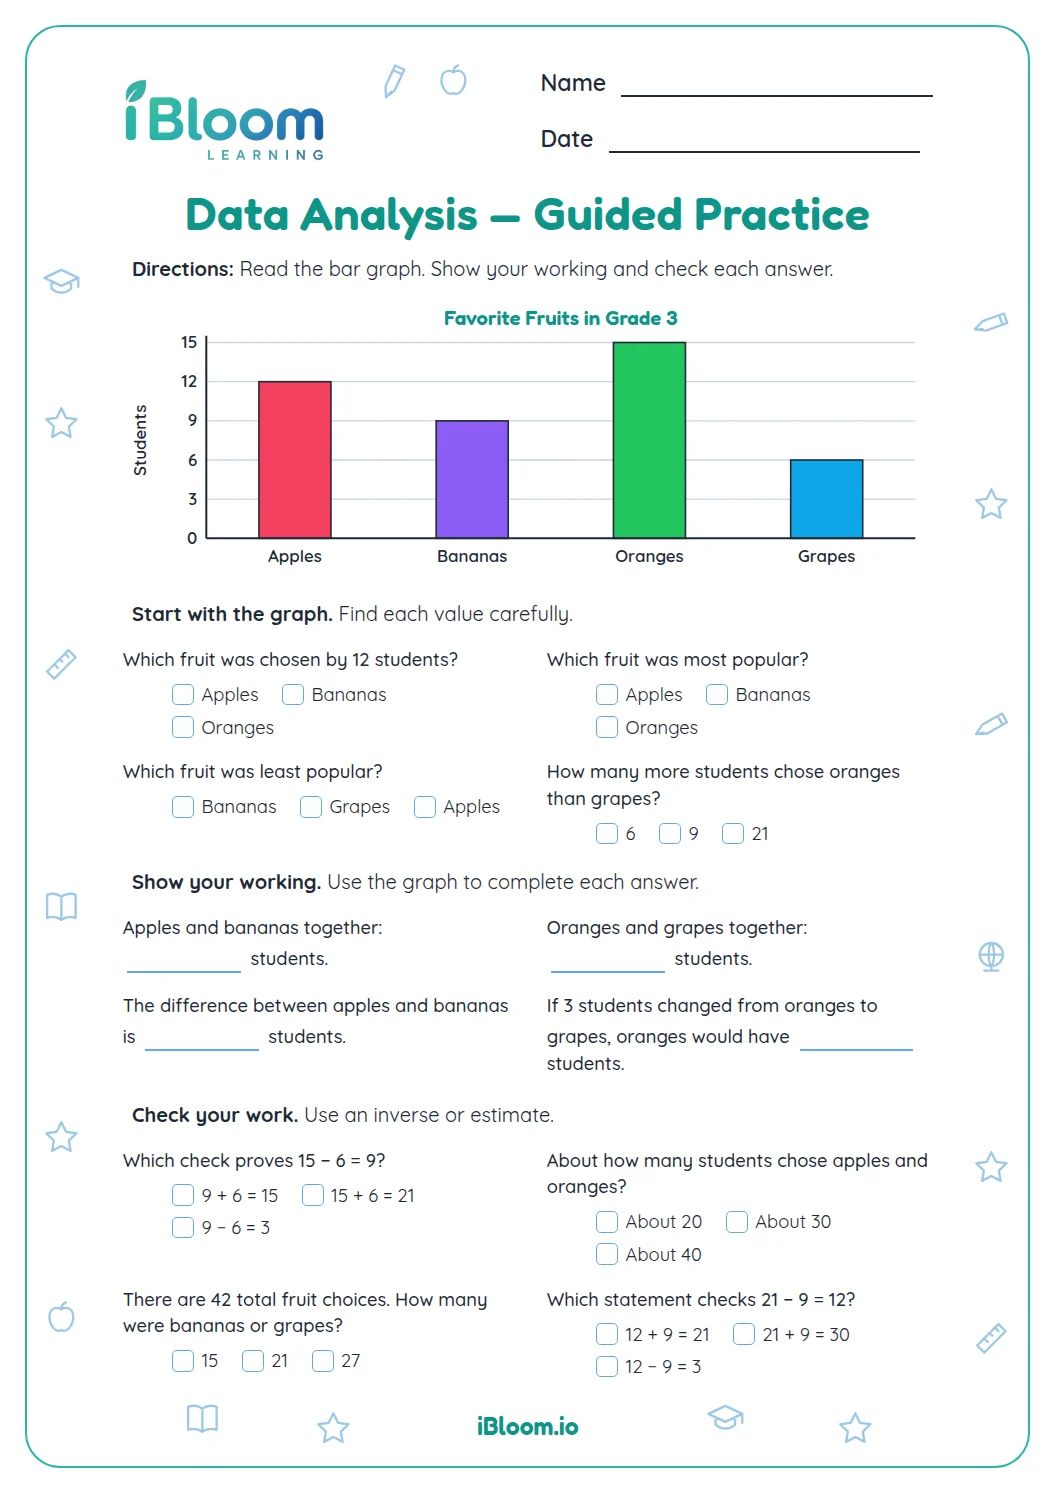
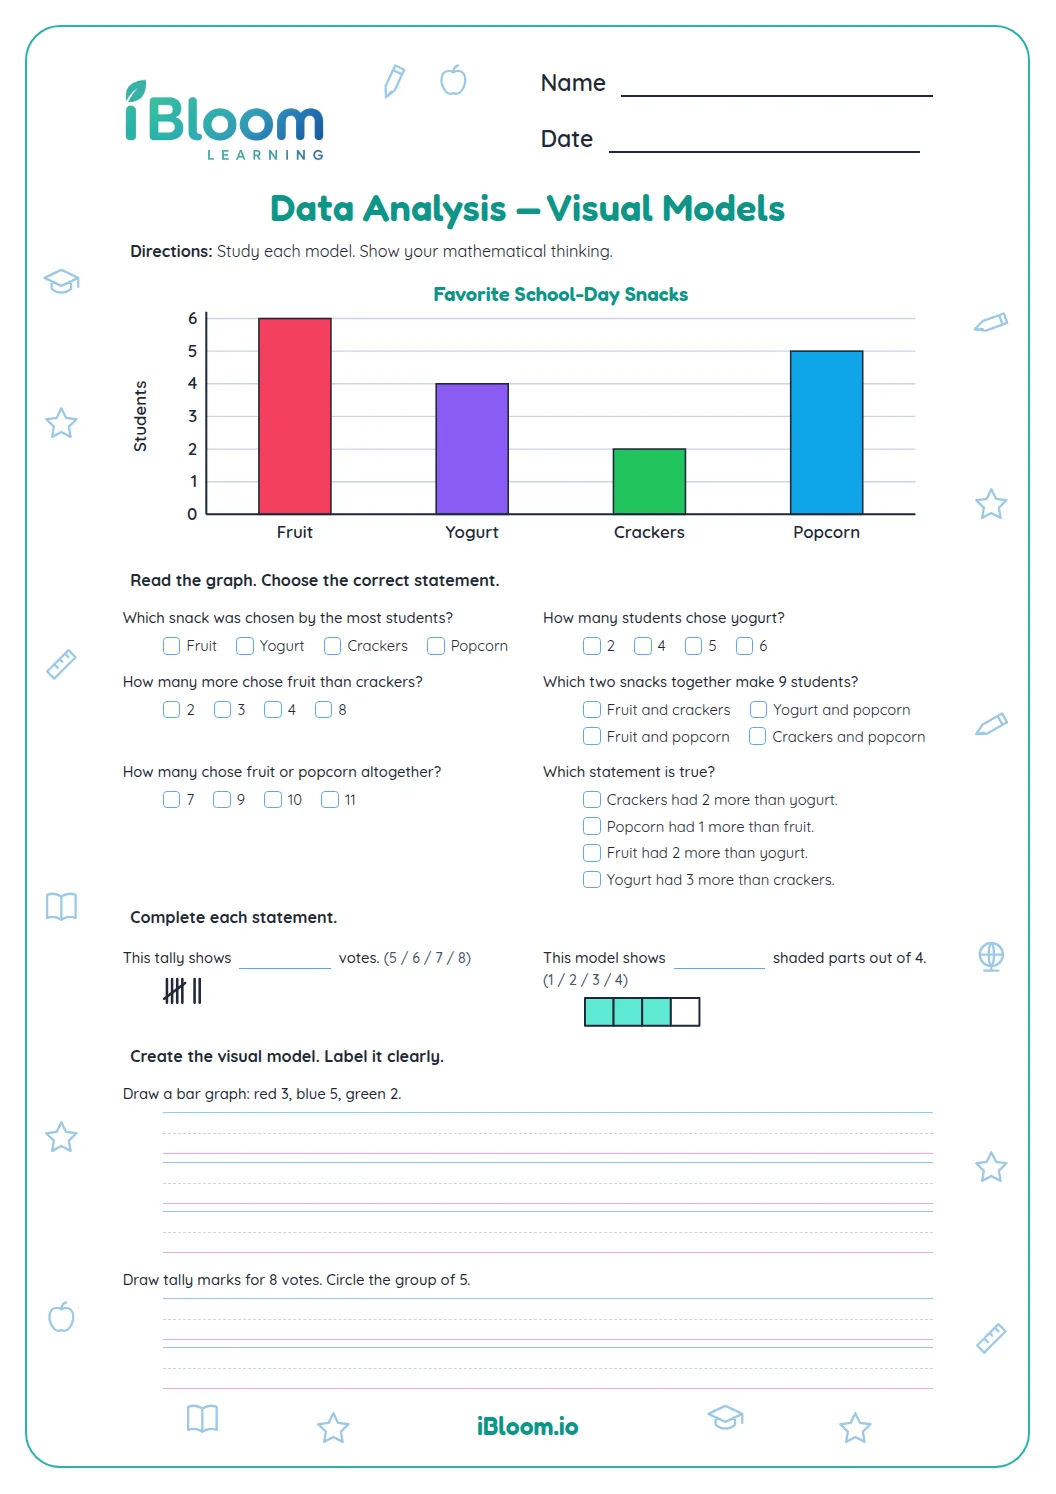
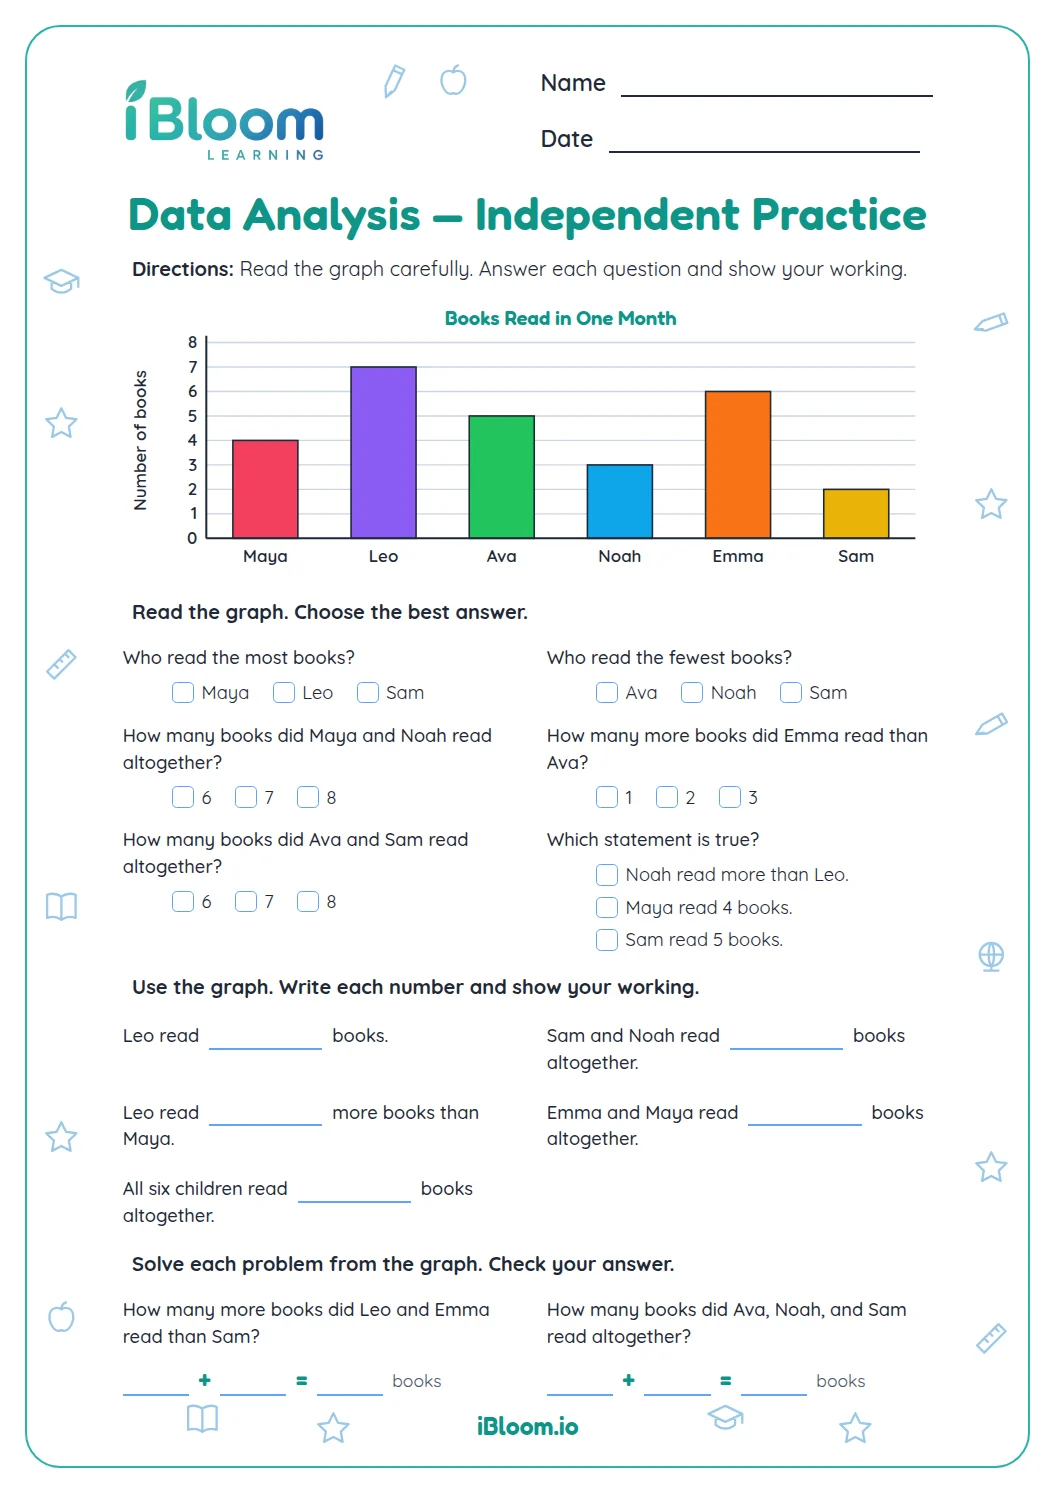
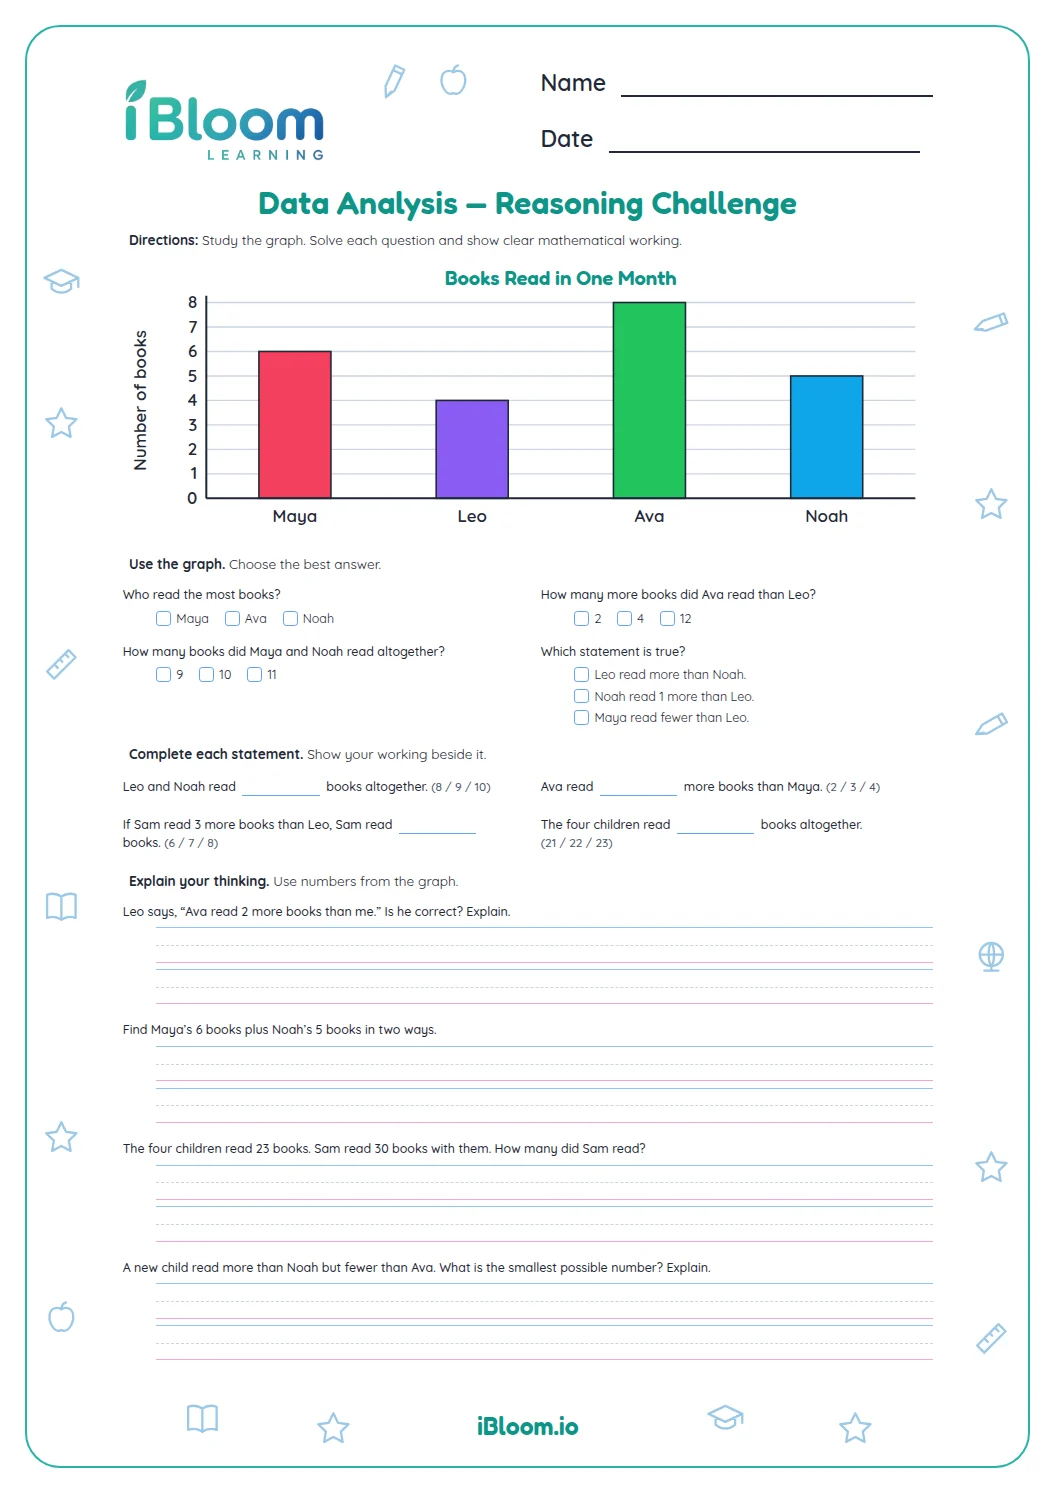
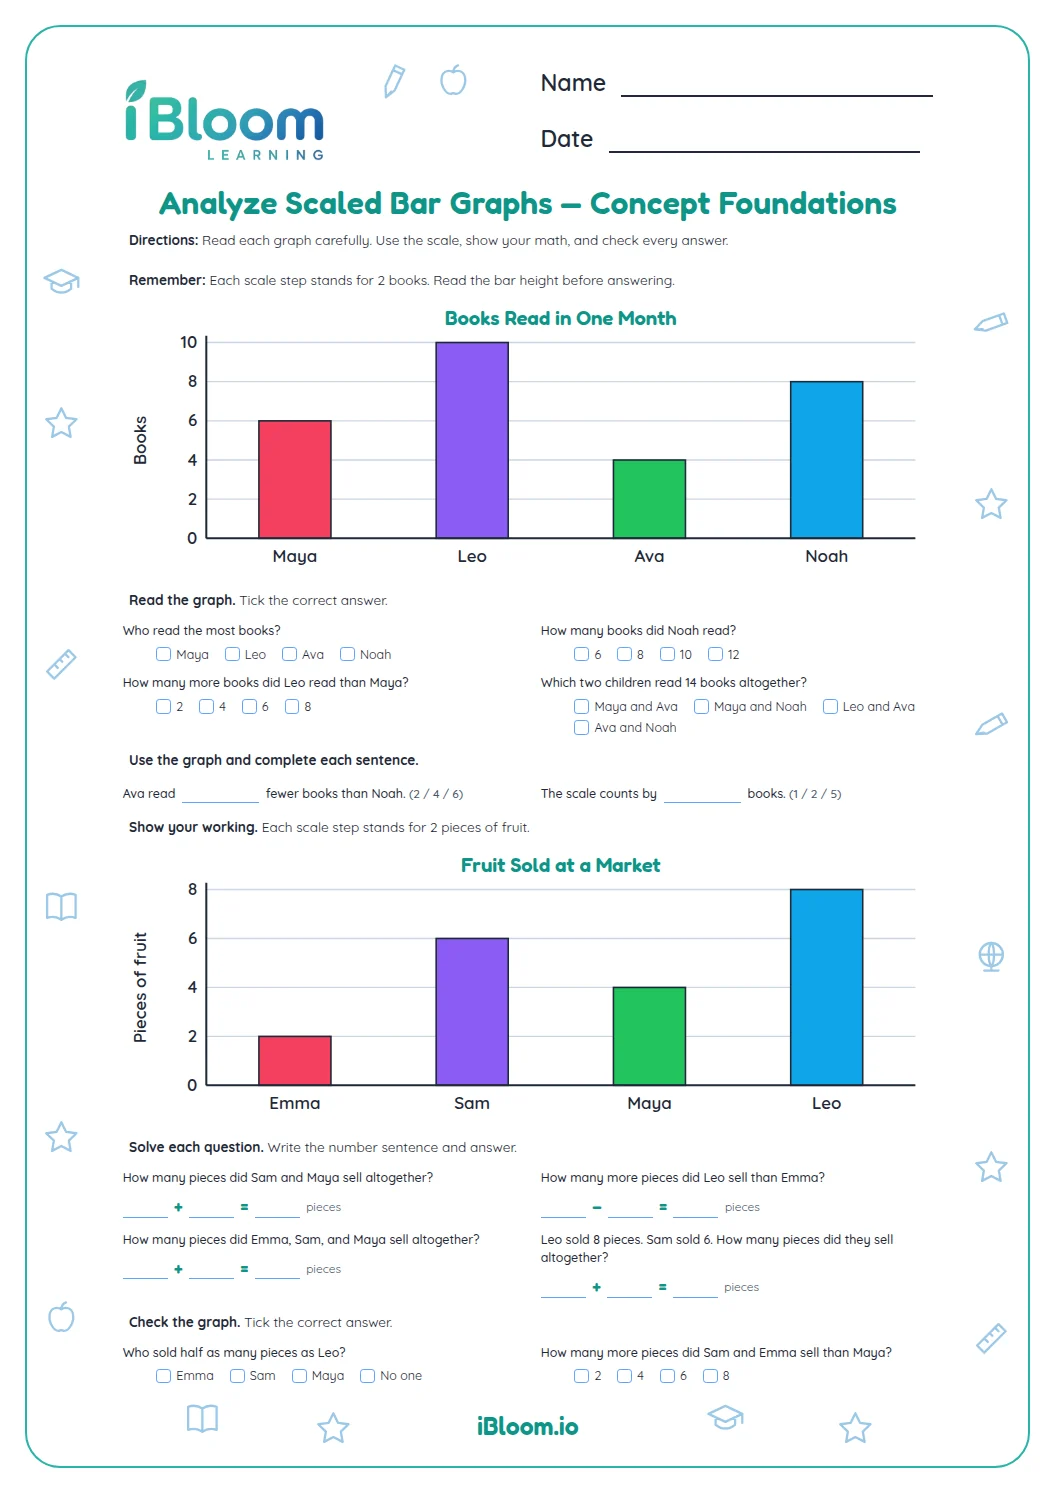
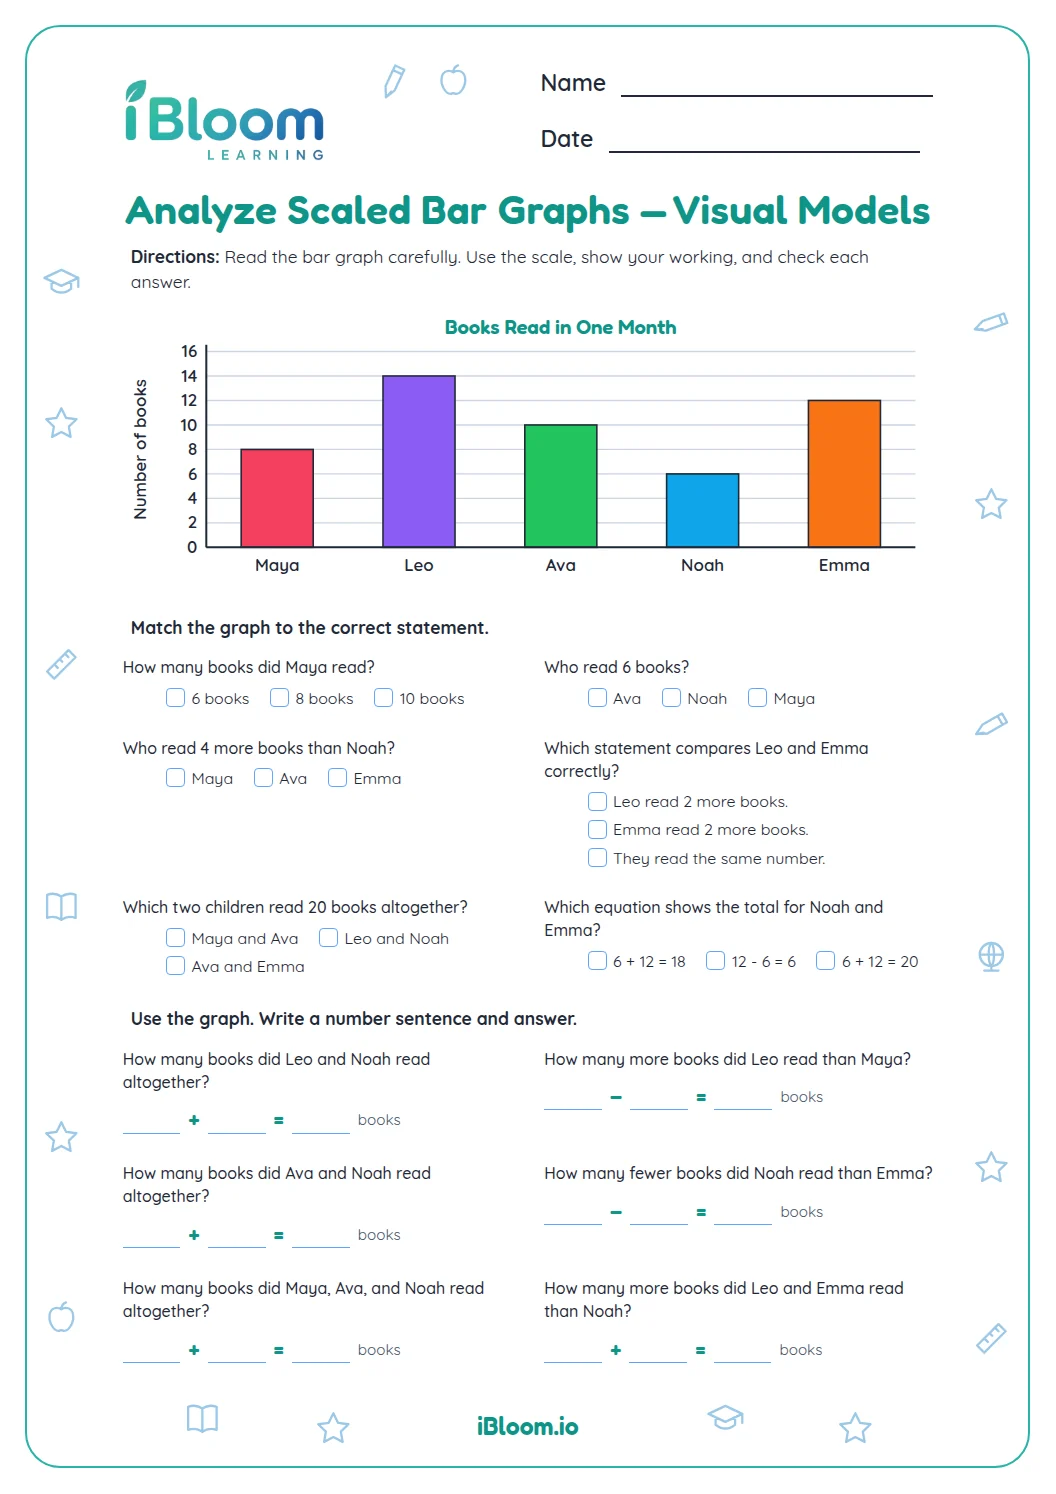
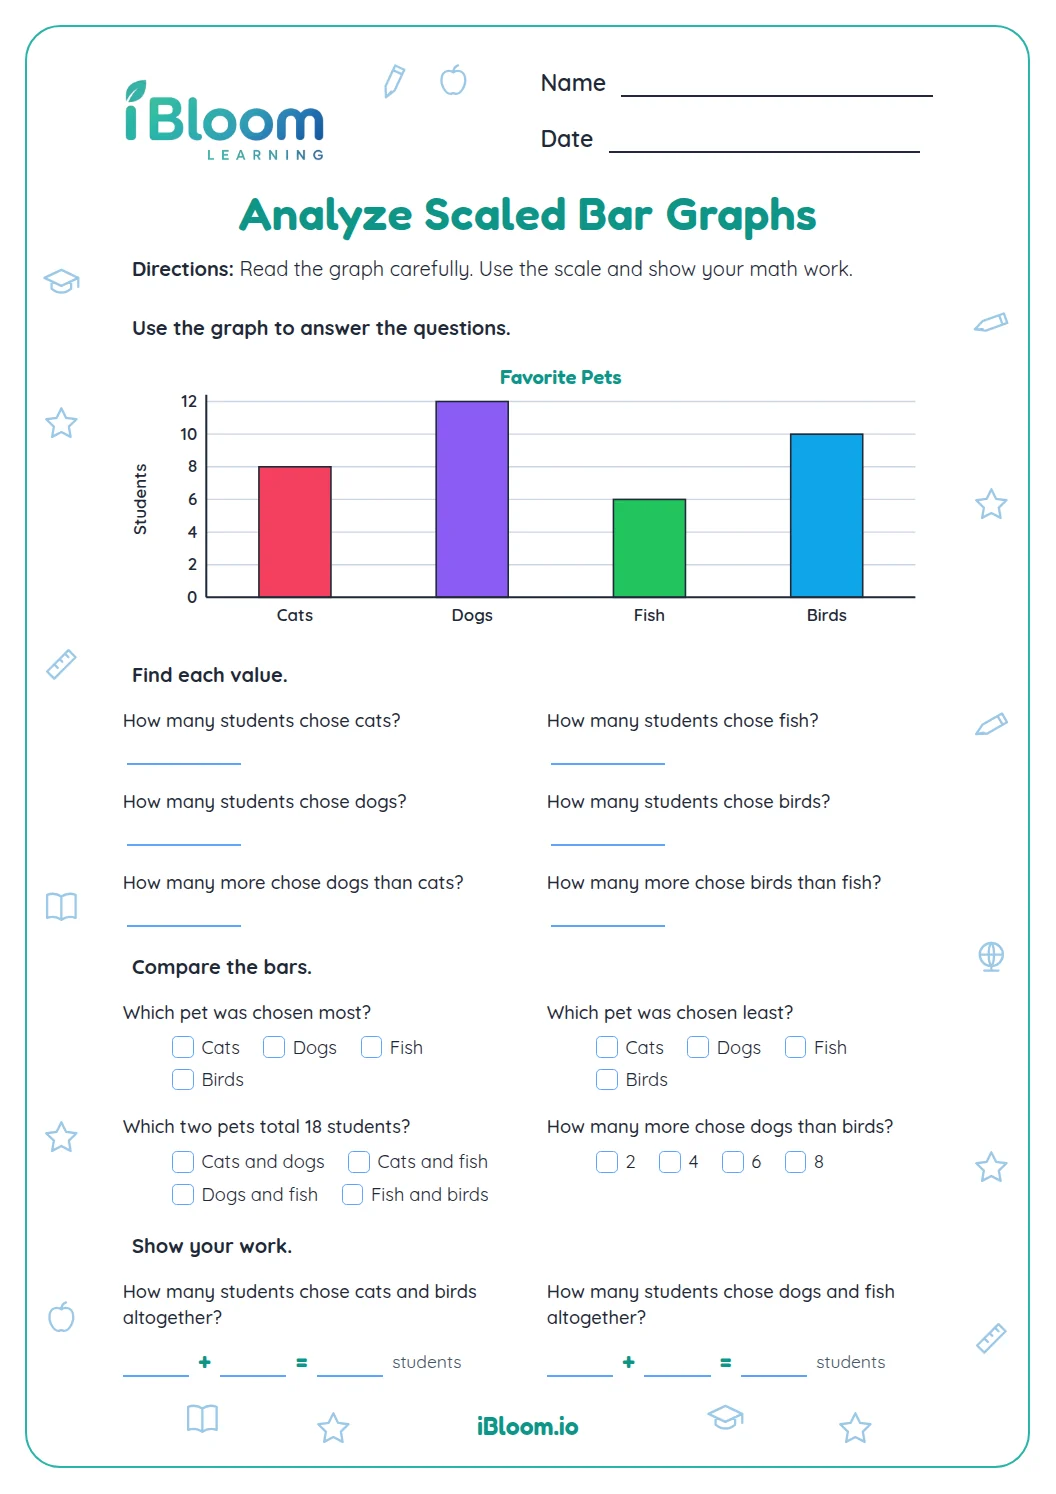
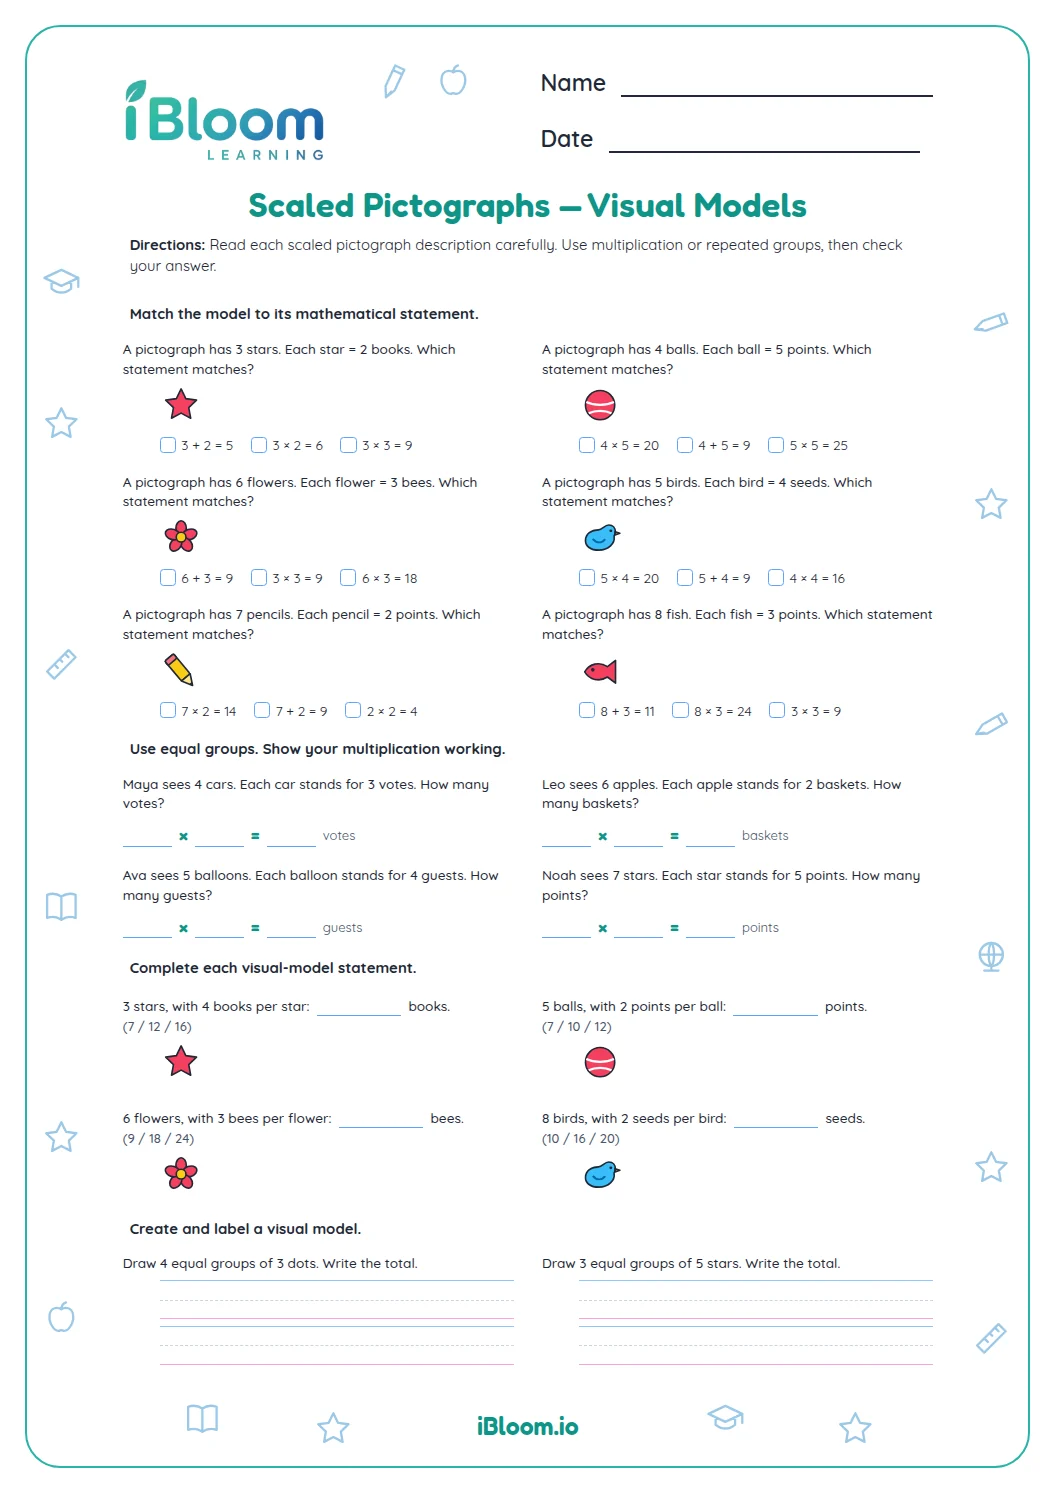
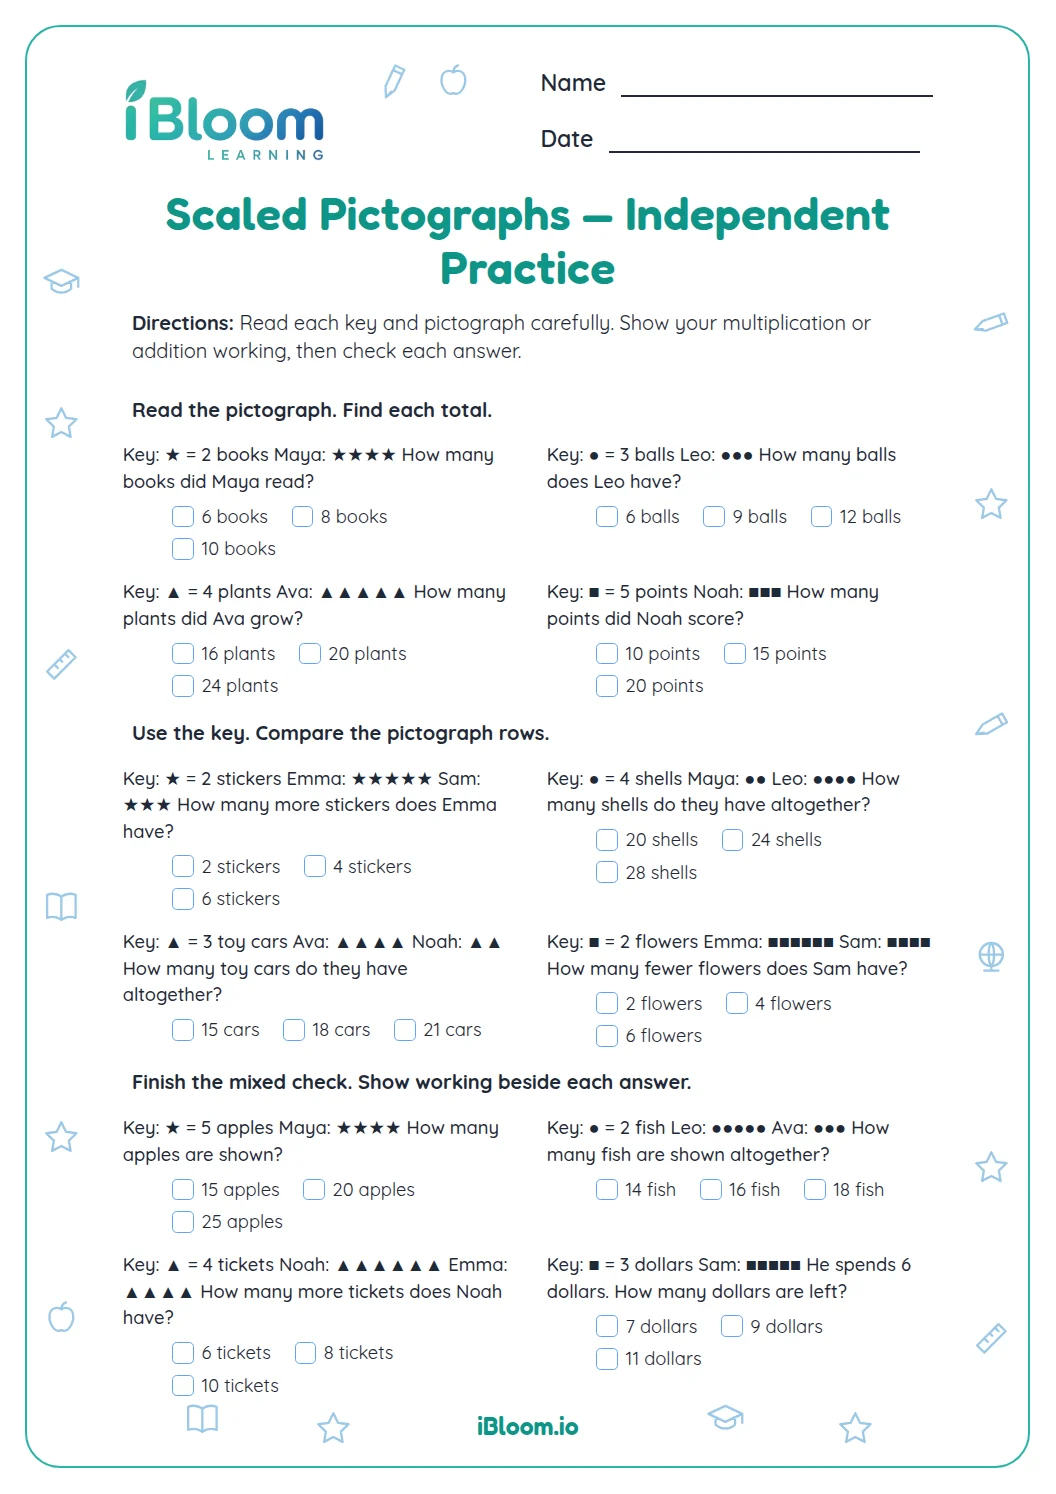
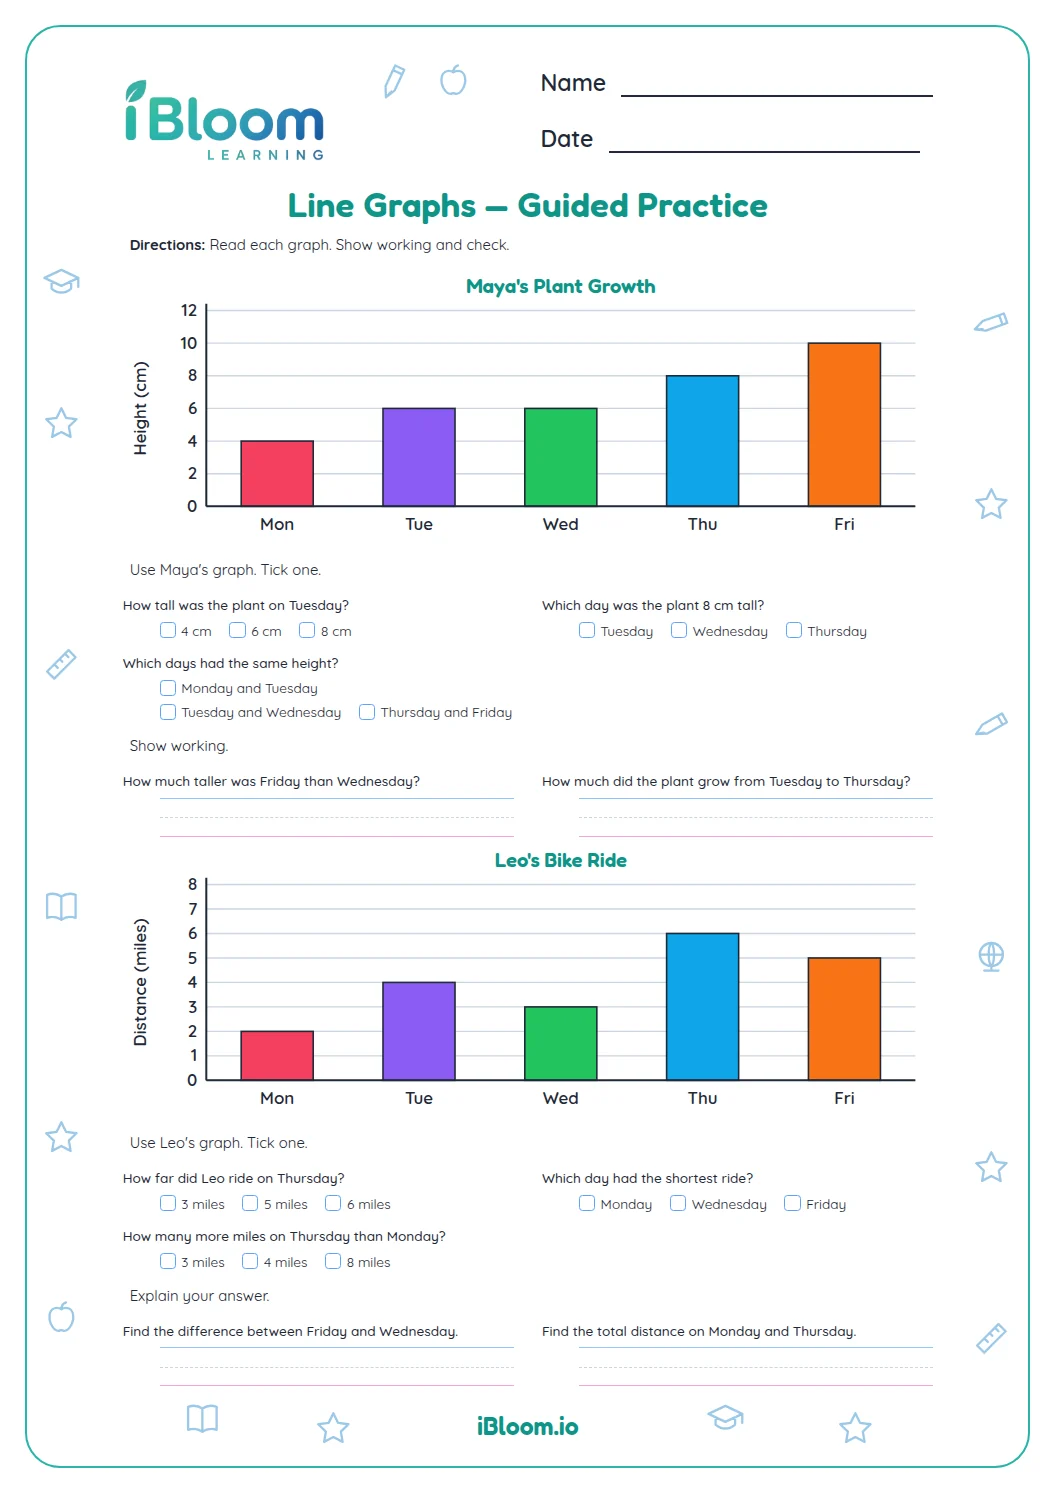
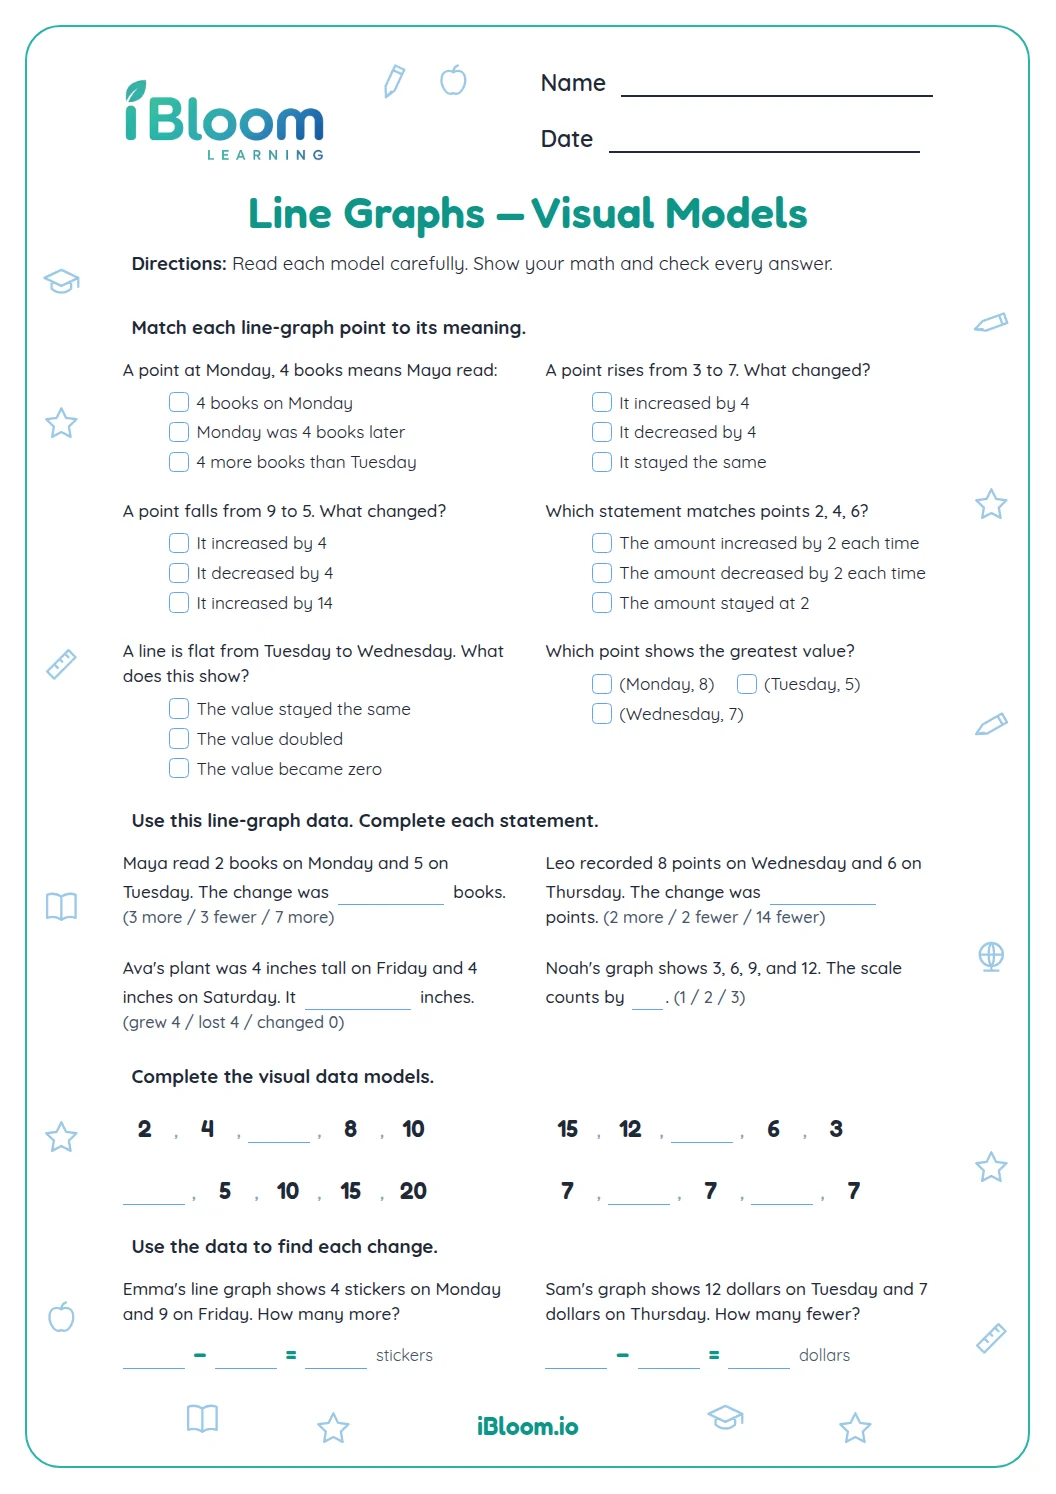
This Grade 3 data worksheet uses two bar graphs: books borrowed across four days and seedlings grown from four kinds of seeds. Children read the scales, compare category values, and solve addition and subtraction questions using the displayed data. It practices CCSS 3.MD.B.3, with a separate answer key.
Aligned to 3.MD.B.3
How do you read the books graph?
The first graph shows 8 books on Monday, 5 on Tuesday, 10 on Wednesday, and 6 on Thursday. Its scale advances by two, so each bar’s height must be read against the labeled axis. Questions 1–8 ask children to find values, compare days, and combine totals.
- 1Monday shows 8 books and Thursday shows 6.
- 2Together: 8 + 6 = 14 books.
How do you compare the seedling data?
The second graph shows 9 bean seedlings, 6 pea seedlings, 12 corn seedlings, and 3 sunflower seedlings. Its scale advances by three. Questions 9–16 ask readers to identify values and solve comparisons using the graph.
- 1Corn: 12 seedlings; sunflowers: 3 seedlings.
- 2Difference: 12 − 3 = 9 seedlings.
How to use this worksheet
- 1Look at the graph title to identify what is being counted.
- 2Read the axis labels and note the scale steps.
- 3Match each category to the top of its bar.
- 4For “how many more” or “fewer,” subtract the smaller value from the larger.
- 5For “altogether,” add the relevant values.
Common mistakes and quick fixes
The mistake
Reading a bar’s height without checking the scale.
The fix
Follow the gridlines to the numbered axis; the scale may count by twos or threes.
The mistake
Subtracting in the wrong order for a difference.
The fix
Write the larger value first, then subtract the smaller one.
The mistake
Adding every category when a question names only two.
The fix
Circle or name just the categories included in the question before computing.
Common Core alignment
Children solve one- and two-step problems by reading scaled bar graphs.
Read scaled bar graphs and solve one- and two-step problems using the data.
On this sheet: Children read two scaled bar graphs and compare, add, and subtract values.
Show the official wordingHide the official wording
Draw a scaled picture graph and a scaled bar graph to represent a data set with several categories. Solve one- and two-step how many more and how many less problems using information presented in scaled bar graphs.
What to practice next
Make more practice
Further reading
Questions parents and teachers ask
What graphs are on this worksheet?
The worksheet has two scaled bar graphs. One shows books borrowed Monday through Thursday, and the other shows seedlings for beans, peas, corn, and sunflowers. Questions refer to values read from each graph and use them in comparisons.
Why should a child check the graph scale?
The scale shows how much each grid step represents. The books graph counts by twos, while the seedling graph counts by threes. Reading the labels prevents a child from treating every gridline as one unit when reading the bar heights.
How do you answer a “how many more” question?
Find both category values on the graph, then subtract the smaller from the larger. For example, the seedling graph has 12 corn seedlings and 3 sunflower seedlings, so the difference is 9 seedlings. Labeling the values first can help.
How many questions are included?
There are 16 questions, with eight based on each graph. The questions include reading a single value, finding a greatest or least category, adding values, and comparing amounts. Each question uses one of the two graph displays on the worksheet.
Does the page include an answer key?
Yes. The answer key lists the graph-based answers and the calculations needed for totals and differences. Children can use the graph to explain how they found each value before checking the final response against the answer key. The categories are labeled below each bar.