
About this worksheet
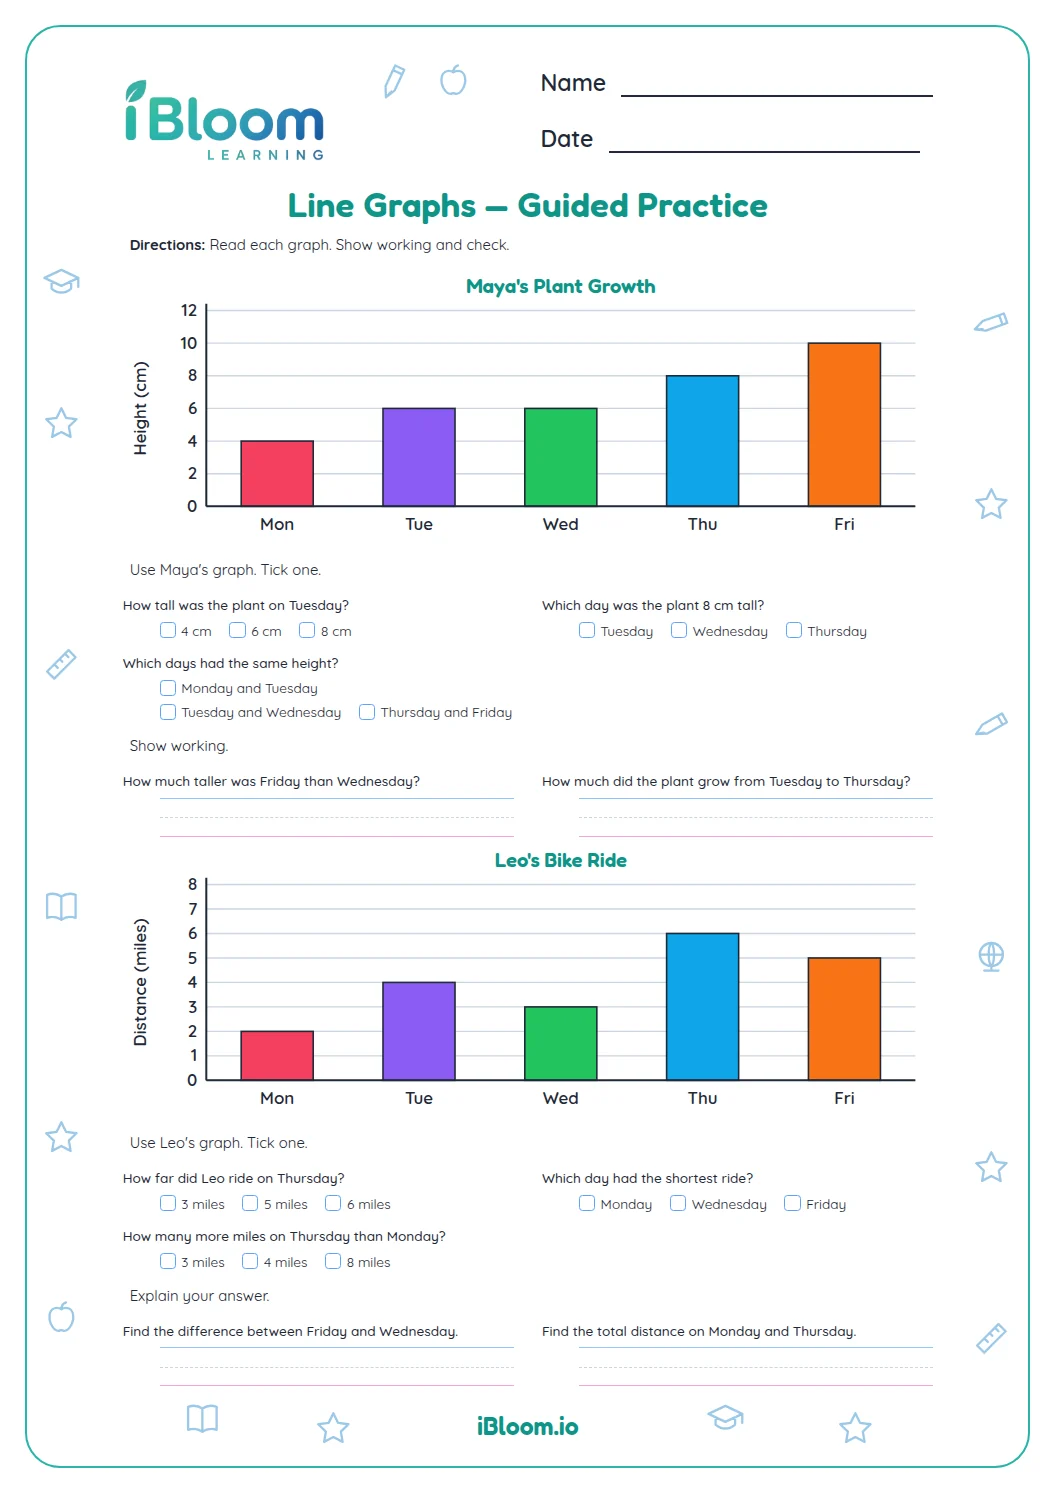
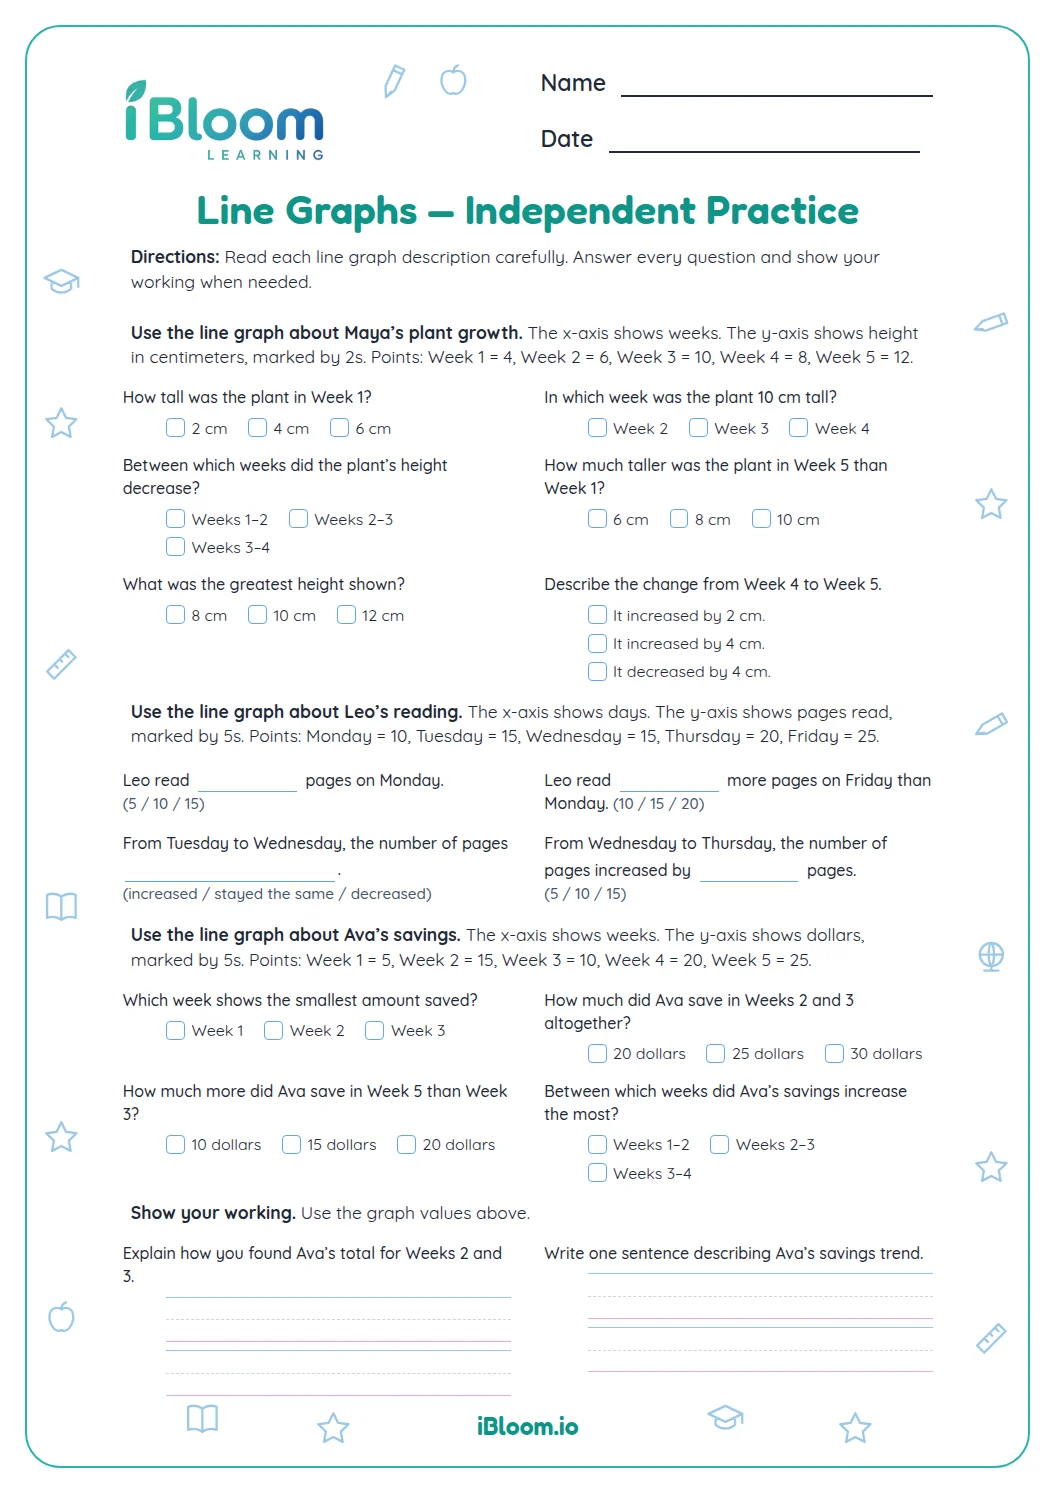
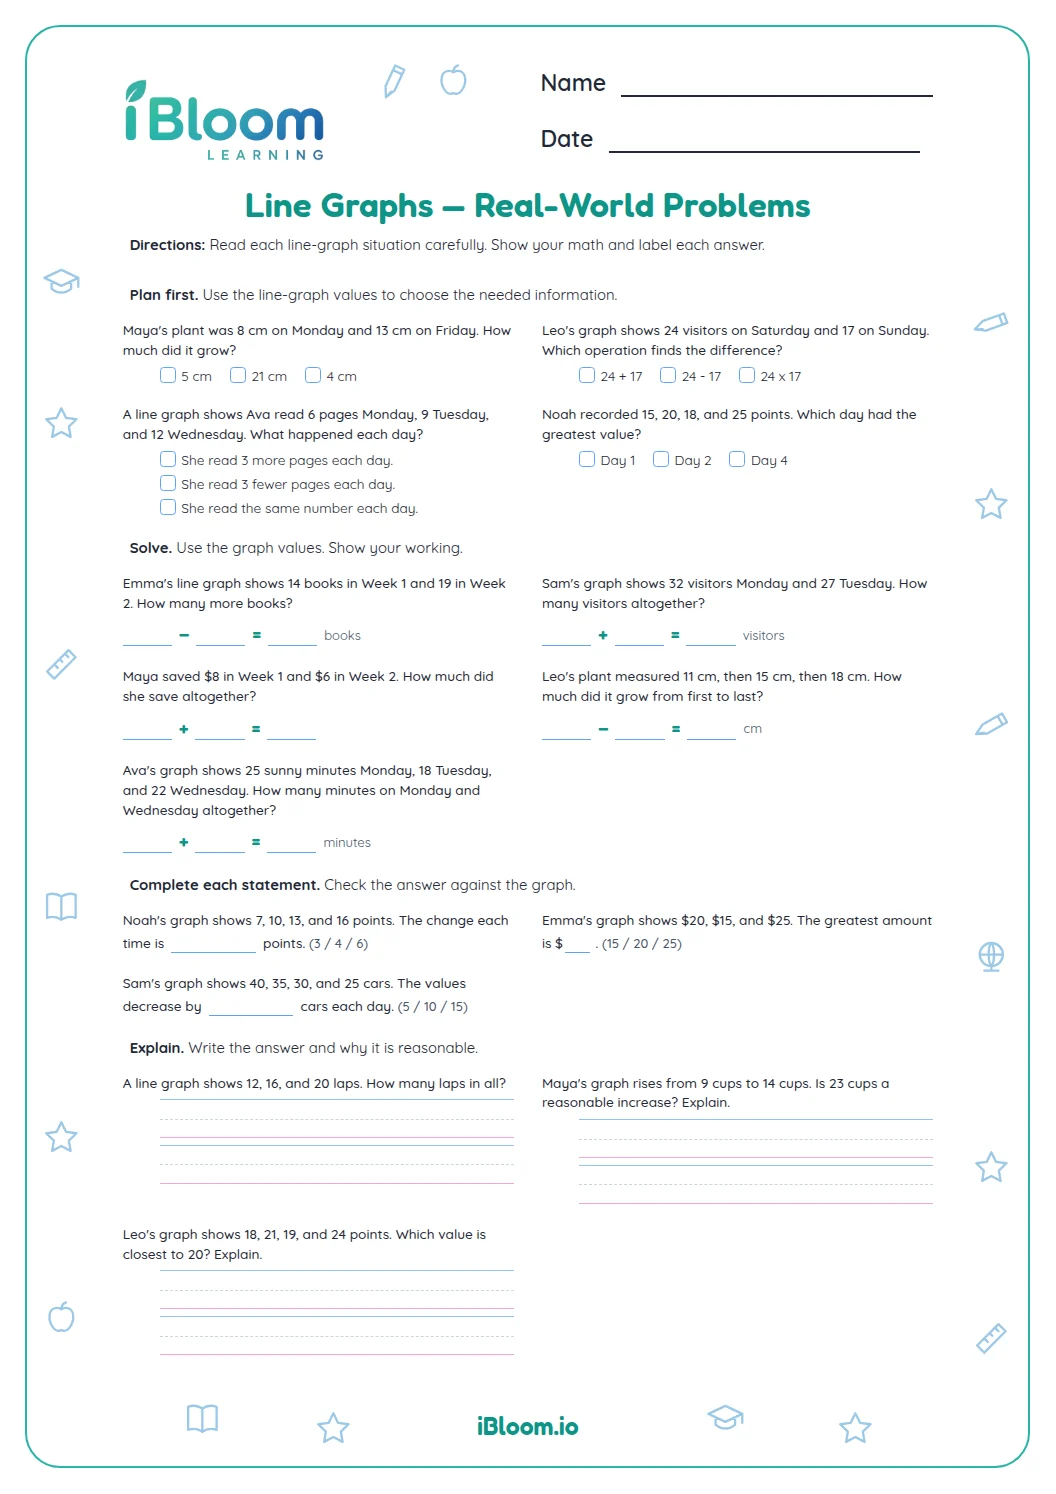
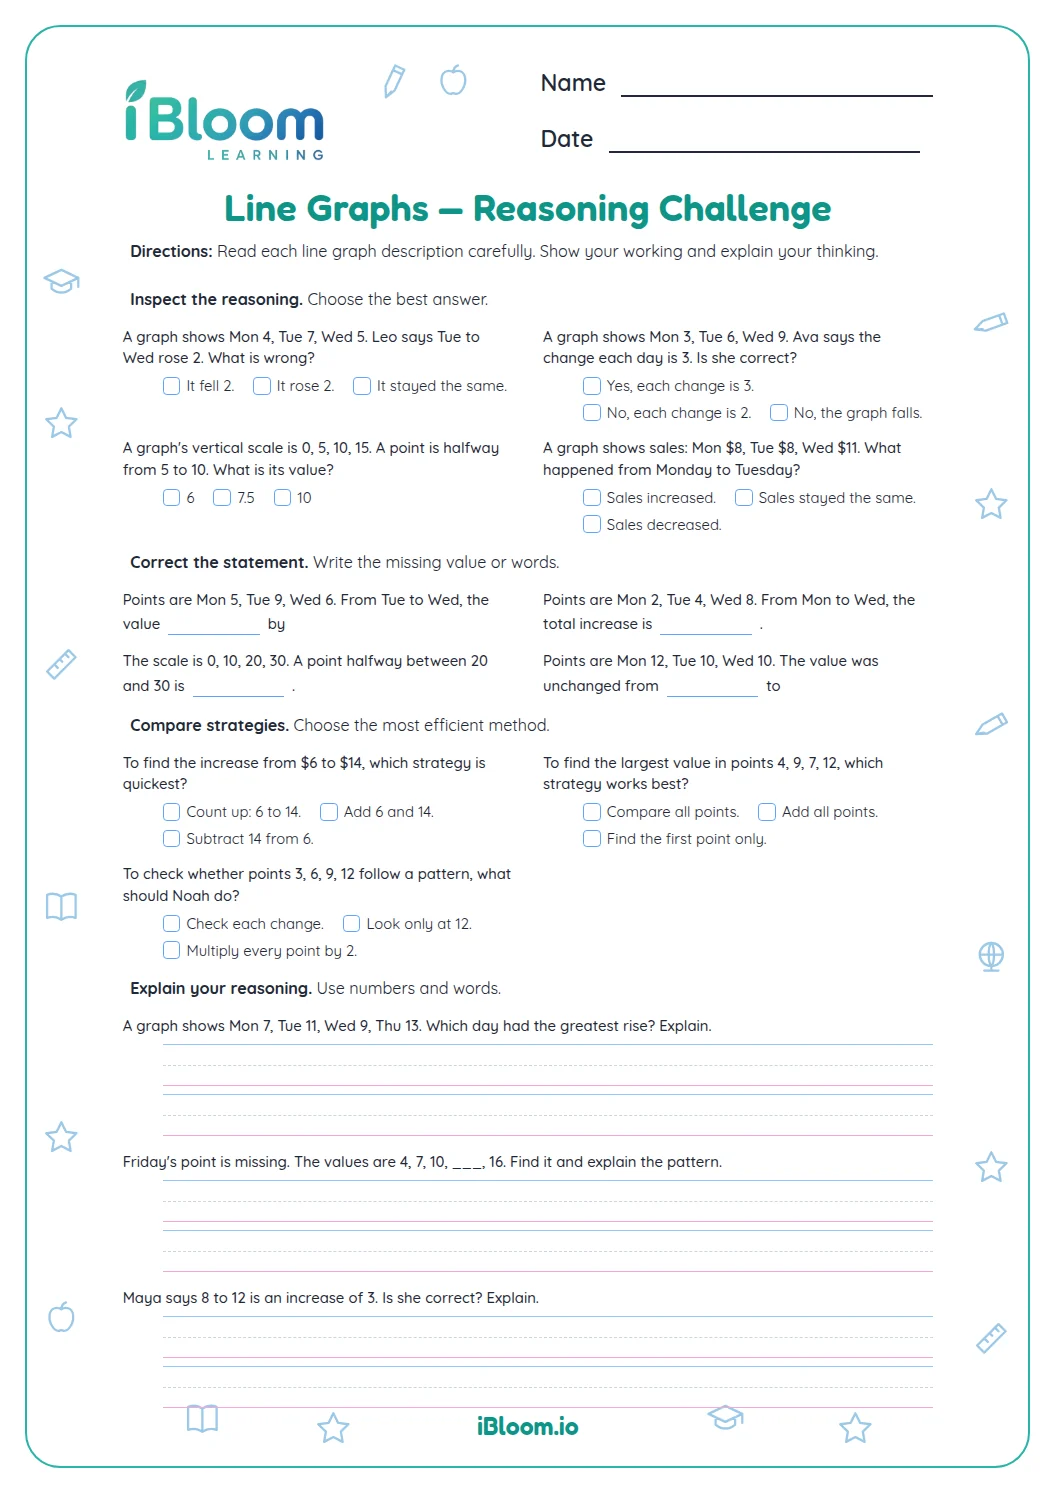
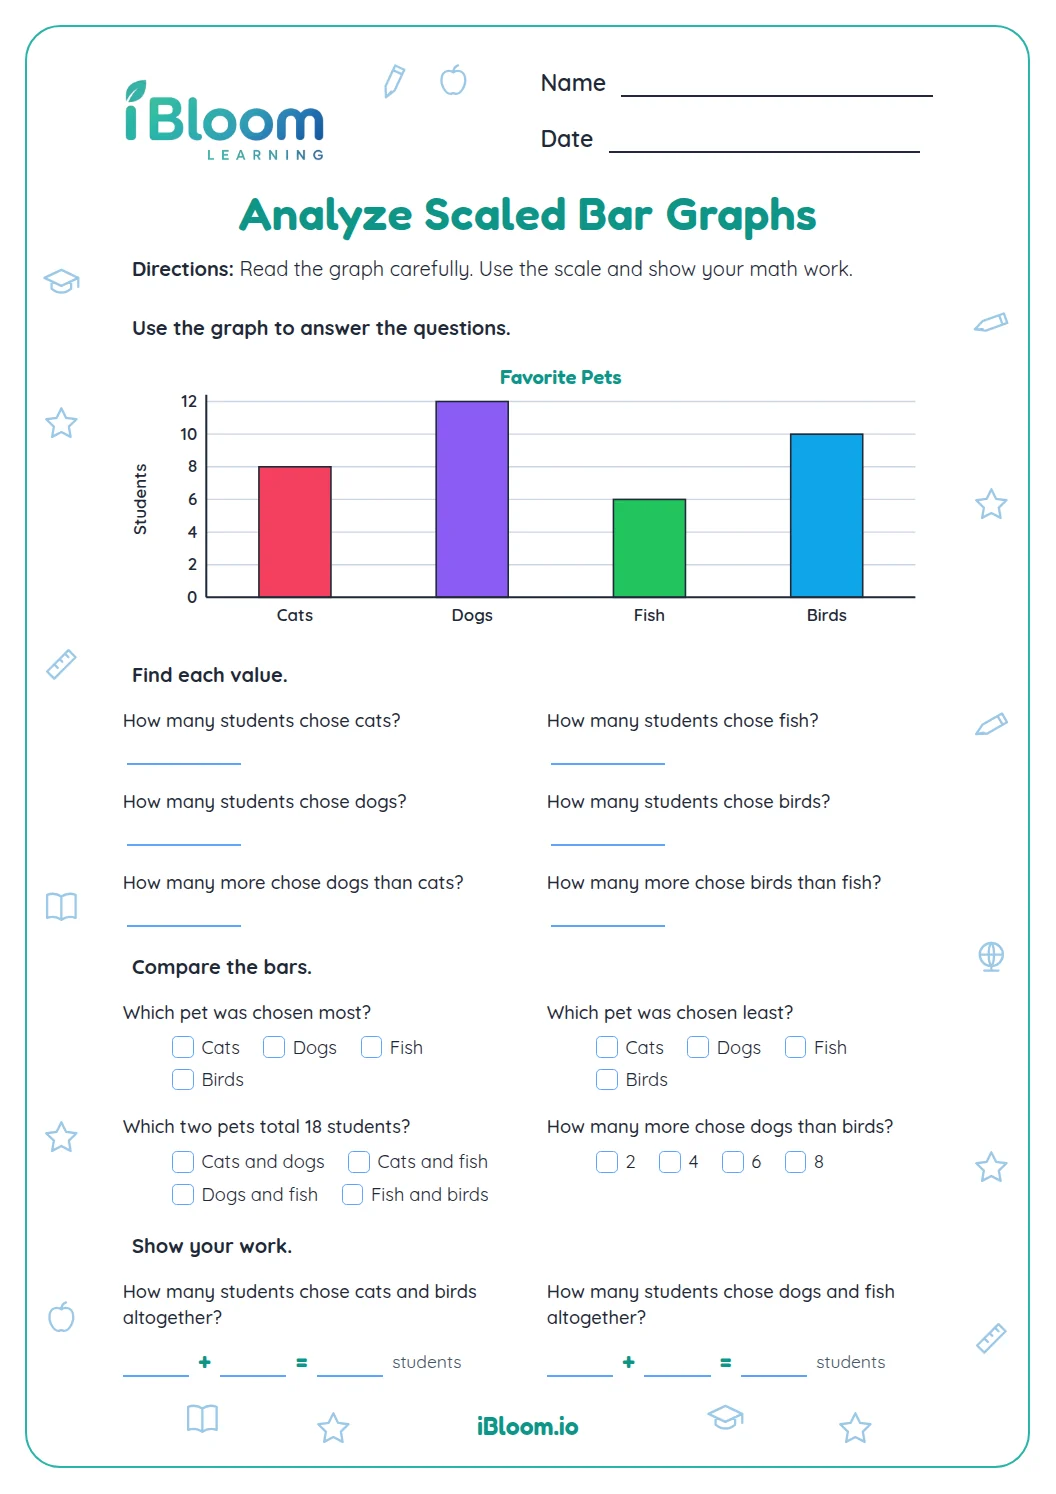
This Grade 3 printable uses three line graphs about reading minutes, plant height, and rainfall. Students read titles and scales, find values for particular days, compare points, and describe increases, equal values, and decreases. All 14 questions include a graph to read, and a separate answer key lists the correct responses.
What does each part of a line graph show?
A graph title names the data, the horizontal labels identify days, and the vertical scale gives the measured amount. Each plotted point pairs one day with one value. Read the scale interval before estimating a point.
How do you read a plotted value?
Find the day along the bottom, move up to its point, then read the amount on the vertical scale. Each of the 14 questions includes a graph with the information needed.
- 1On the Reading Minutes graph, Monday is 10 and Friday is 50.
- 250 − 10 = 40, so Friday has 40 more reading minutes.
How can a line show change?
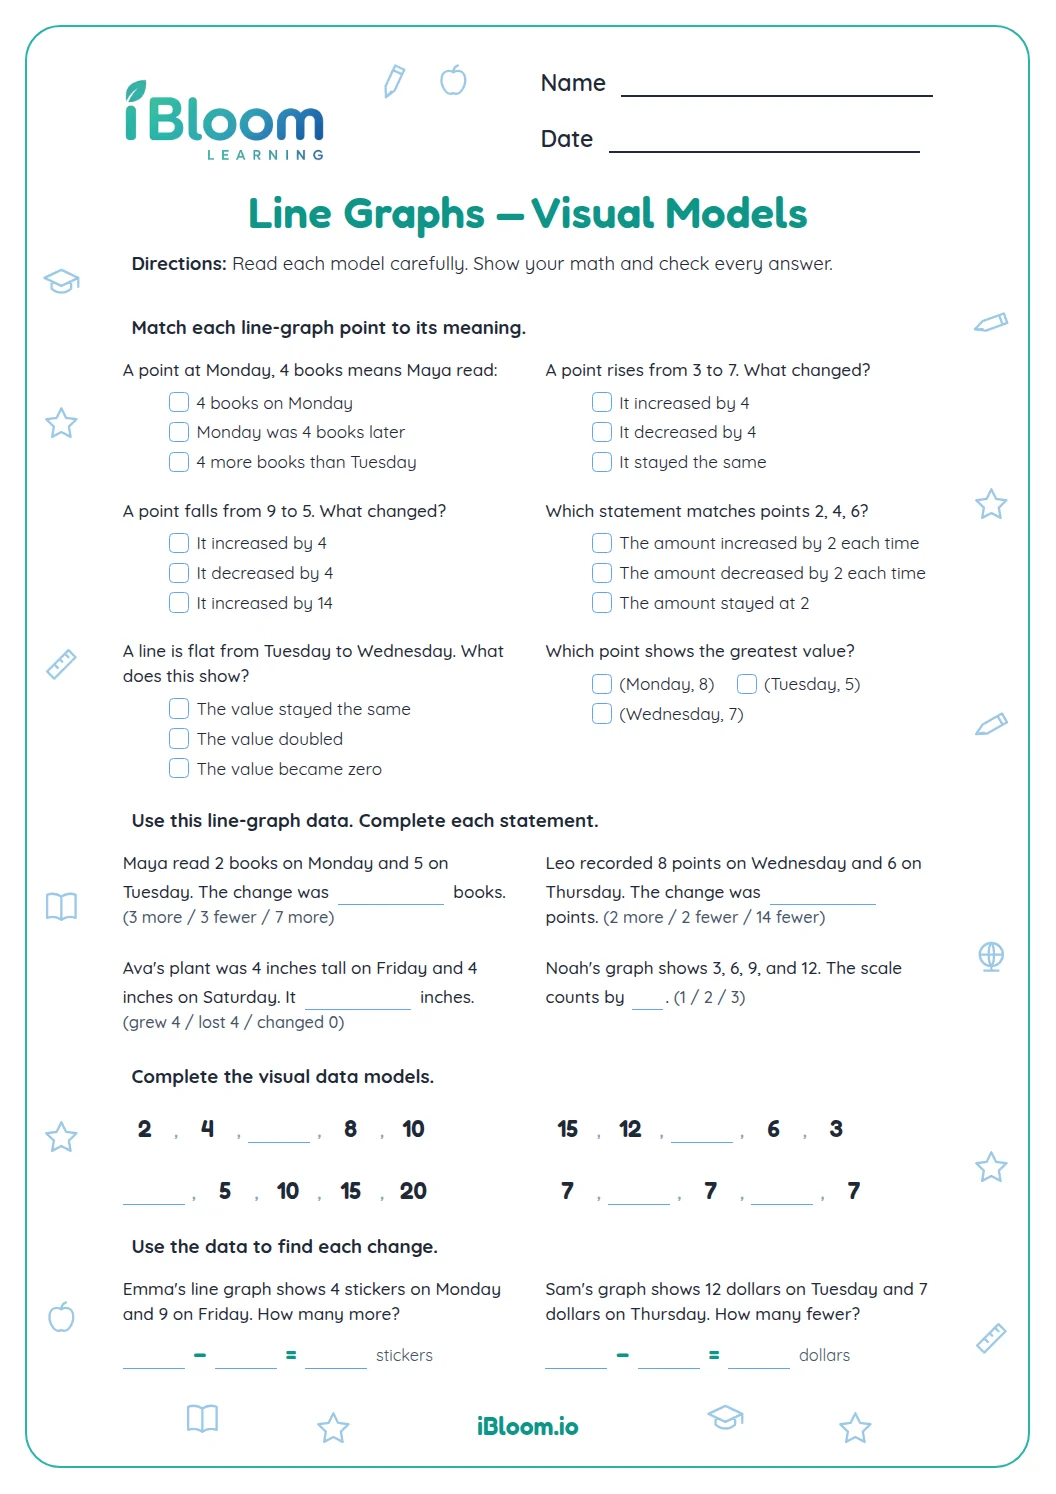
A rising segment means the measured value increased; a falling segment means it decreased. A flat segment means two neighboring values are equal. Compare the heights of the points to tell which pattern appears.
How can students check a comparison?
Return to the graph and read both points before subtracting. For “how many more,” subtract the smaller value from the larger one, then check that the difference fits the scale.
How to use this worksheet
- 1Read the title and axis labels.
- 2Check the amount represented by each scale step.
- 3Find the requested day on the horizontal axis.
- 4Move to its point and read the vertical value.
- 5For a comparison, subtract the smaller value from the larger.
Common mistakes and quick fixes
The mistake
Reading a day label as the measured value.
The fix
Use the vertical scale to read the point’s amount.
The mistake
Skipping a scale interval.
The fix
Count each interval from the baseline to the point.
The mistake
Giving a larger value instead of the difference.
The fix
Subtract the smaller plotted value from the larger.
What to practice next
Make more practice
Further reading
Questions parents and teachers ask
How many graphs and questions are included?
The worksheet has 14 questions across three line graphs. The data sets show reading minutes, plant height, and rainfall over five weekdays, and each group of questions refers to the graph printed with that group. This gives families a simple way to review each step together at home.
What should students read before looking at a point?
Start with the graph title and axis labels. They identify what is measured and which labels name the days; then check the scale to see how much each step represents before reading a point or comparing two values. This gives families a simple way to review each step together at home.
Does the worksheet include comparison questions?
Yes. Students compare plotted values, find how much one day exceeds another, and describe increases, decreases, or equal values. Each answer can be checked against the graph’s scale and the points for the named days. This gives families a simple way to review each step together at home.
Is there an answer key?
Yes. A separate answer key lists the correct choice for all 14 questions. Students can return to the matching graph and check which point or comparison supports each response before making corrections. This gives families a simple way to review each step together at home.
Which data patterns appear on the graphs?
The reading graph rises each day, plant height stays level from Tuesday to Wednesday, and rainfall both rises and falls. Students use the plotted points to notice these different patterns across the five days. This gives families a simple way to review each step together at home.