
About this worksheet
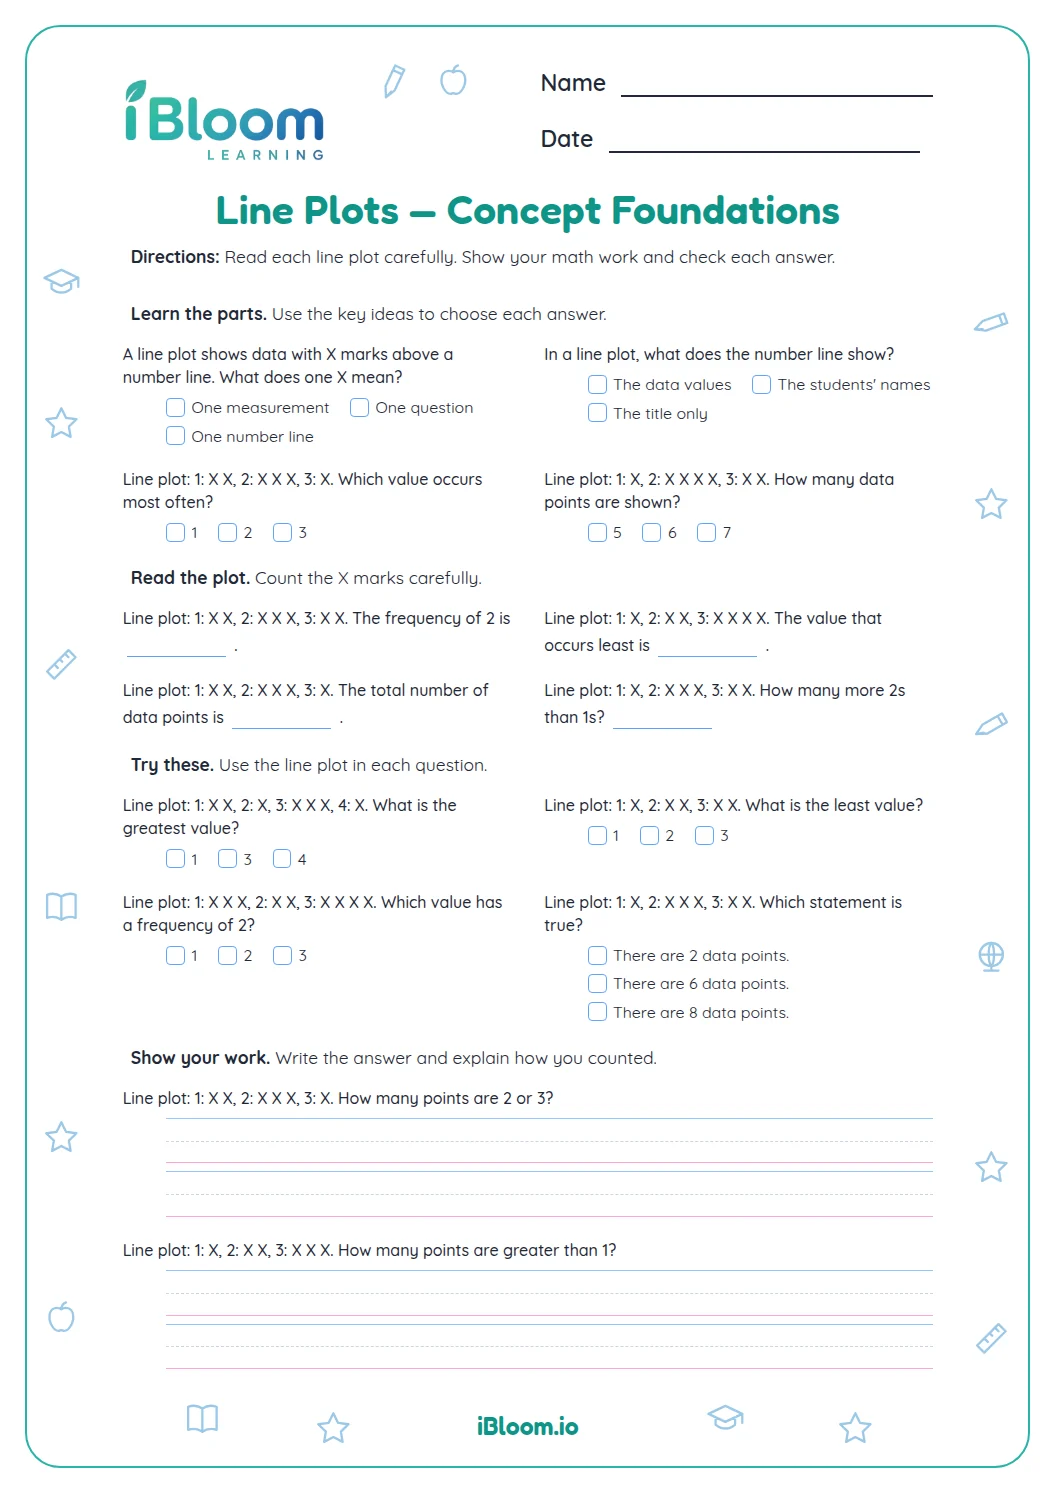
This Grade 3 printable gives students 14 compact questions about reading and interpreting line-plot data. They use X counts and repeated measurement lists to find frequencies, totals, least values and differences. Whole-number, half-inch and quarter-inch lengths appear throughout. A separate answer key gives the response to every item.
Aligned to 3.MD.B.4
How do I read a line plot?
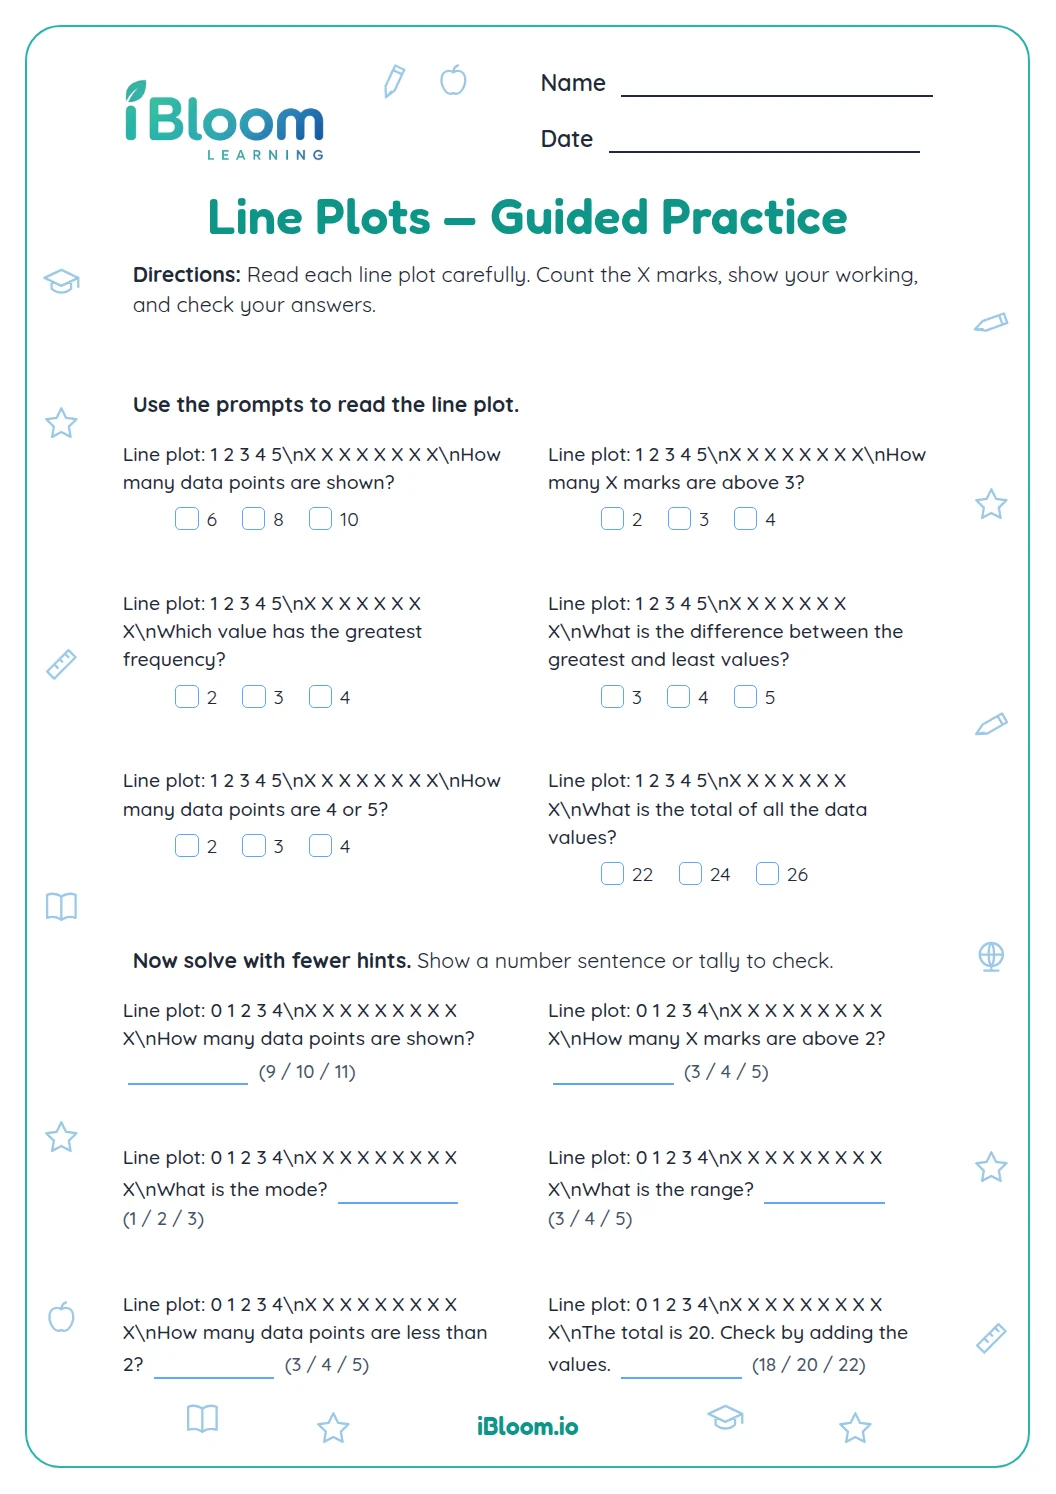
A line plot groups measurements by value and stacks an X for each occurrence. For question 1, three Xs are at 2 inches, so three lengths measure 2 inches.
- 1Question 1 gives 3 Xs at 2 inches.
- 2Count the marks at that value.
- 3Answer: 3 lengths measure 2 inches.
How can a line plot show which measurement is most common?
Compare the number of Xs above two values. Question 4 gives three measurements of 2 inches and one measurement of 1 inch, a difference of two.
How do repeated measurements become X marks?
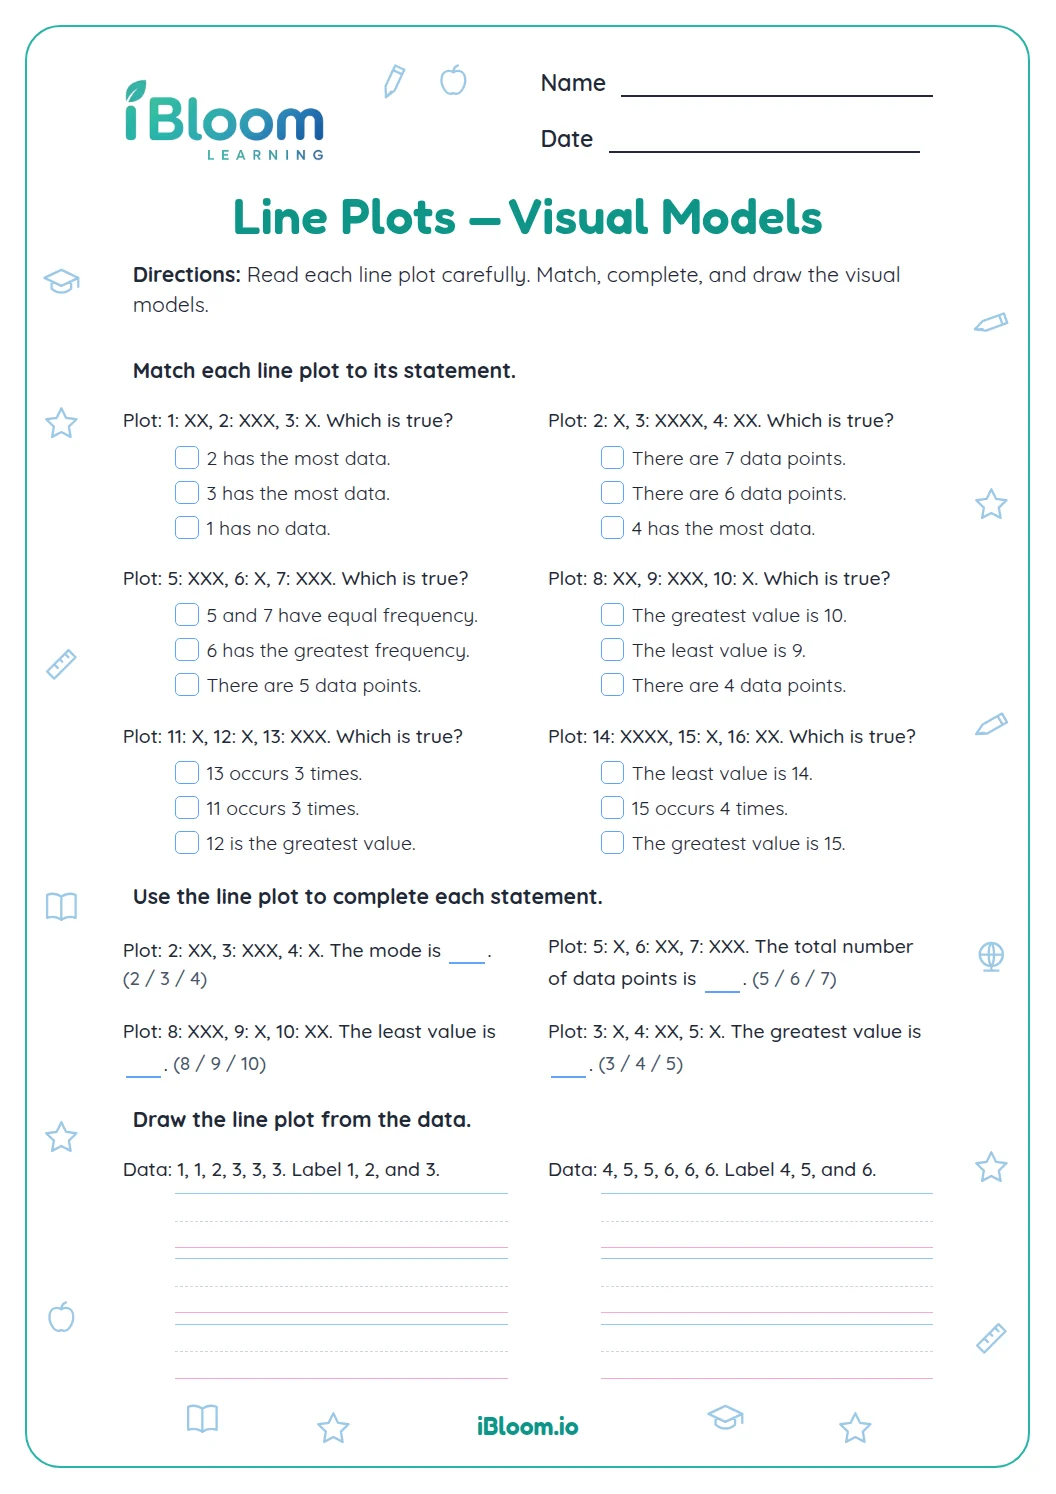
Each repeated measurement adds one X above its value. In question 9, 1 appears twice, 2 appears three times and 3 appears once, so the counts are 2, 3 and 1.
What does this printable include?
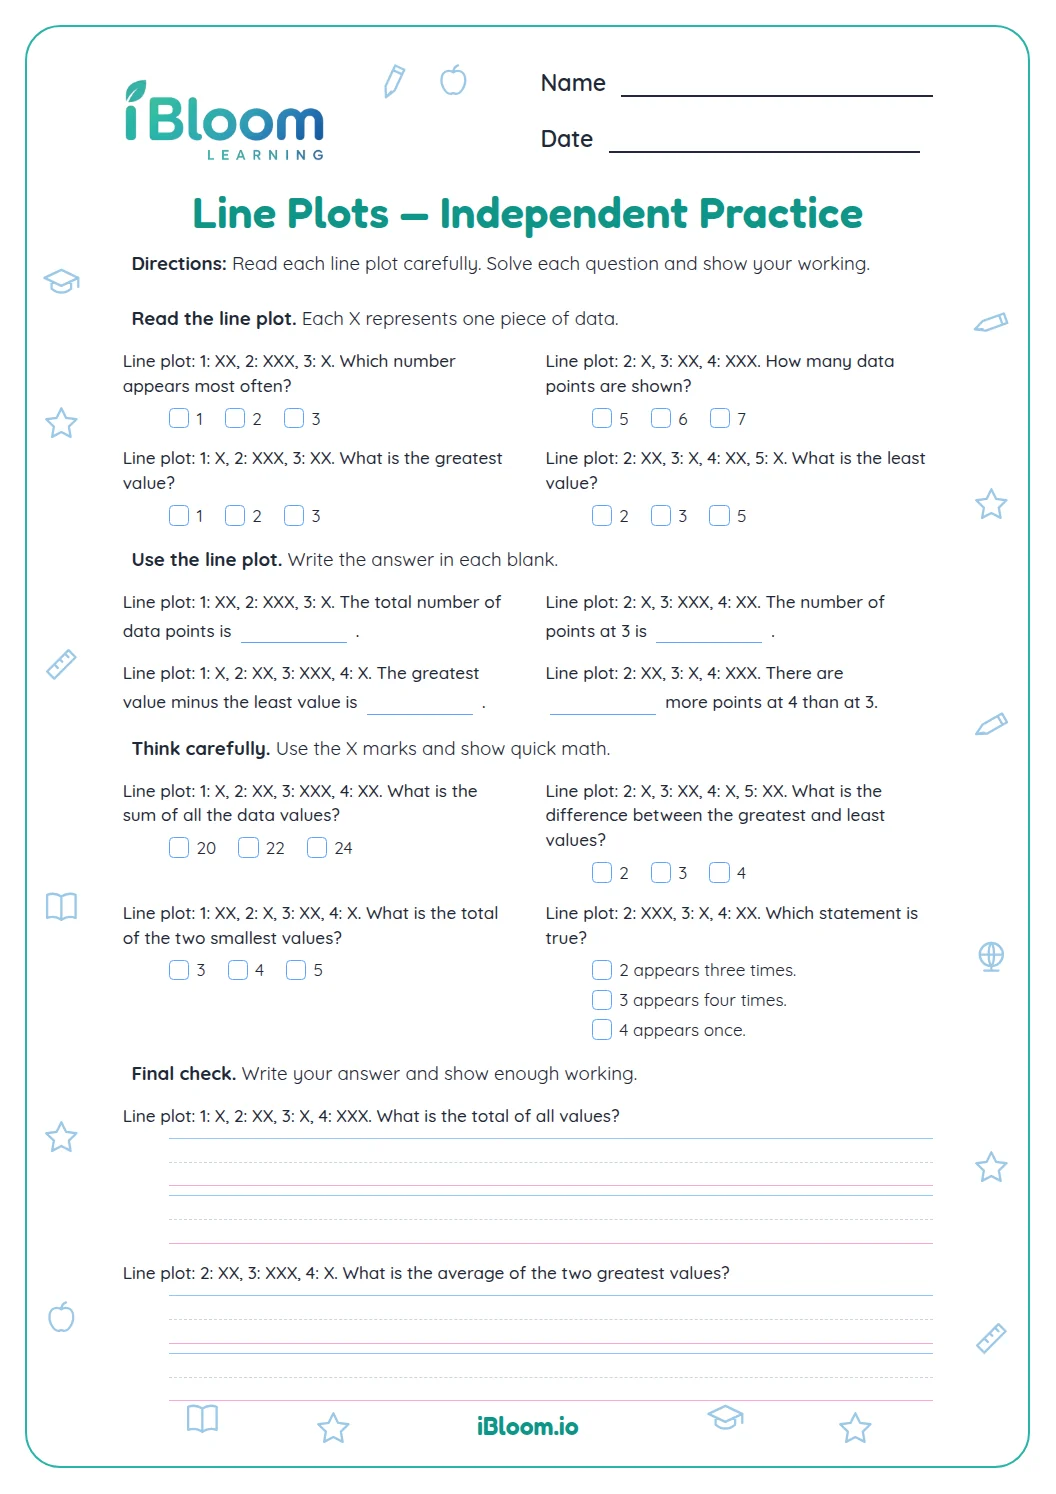
There are 14 questions in three parts: nine questions interpret line-plot data and five ask about frequency or compare values. The data includes whole-number and fractional inch lengths.
How to use this worksheet
- 1Read the scale before counting any X marks.
- 2For a “how many” question, count only the column named.
- 3For totals, add the X marks across the columns asked about.
- 4For “most,” compare column heights.
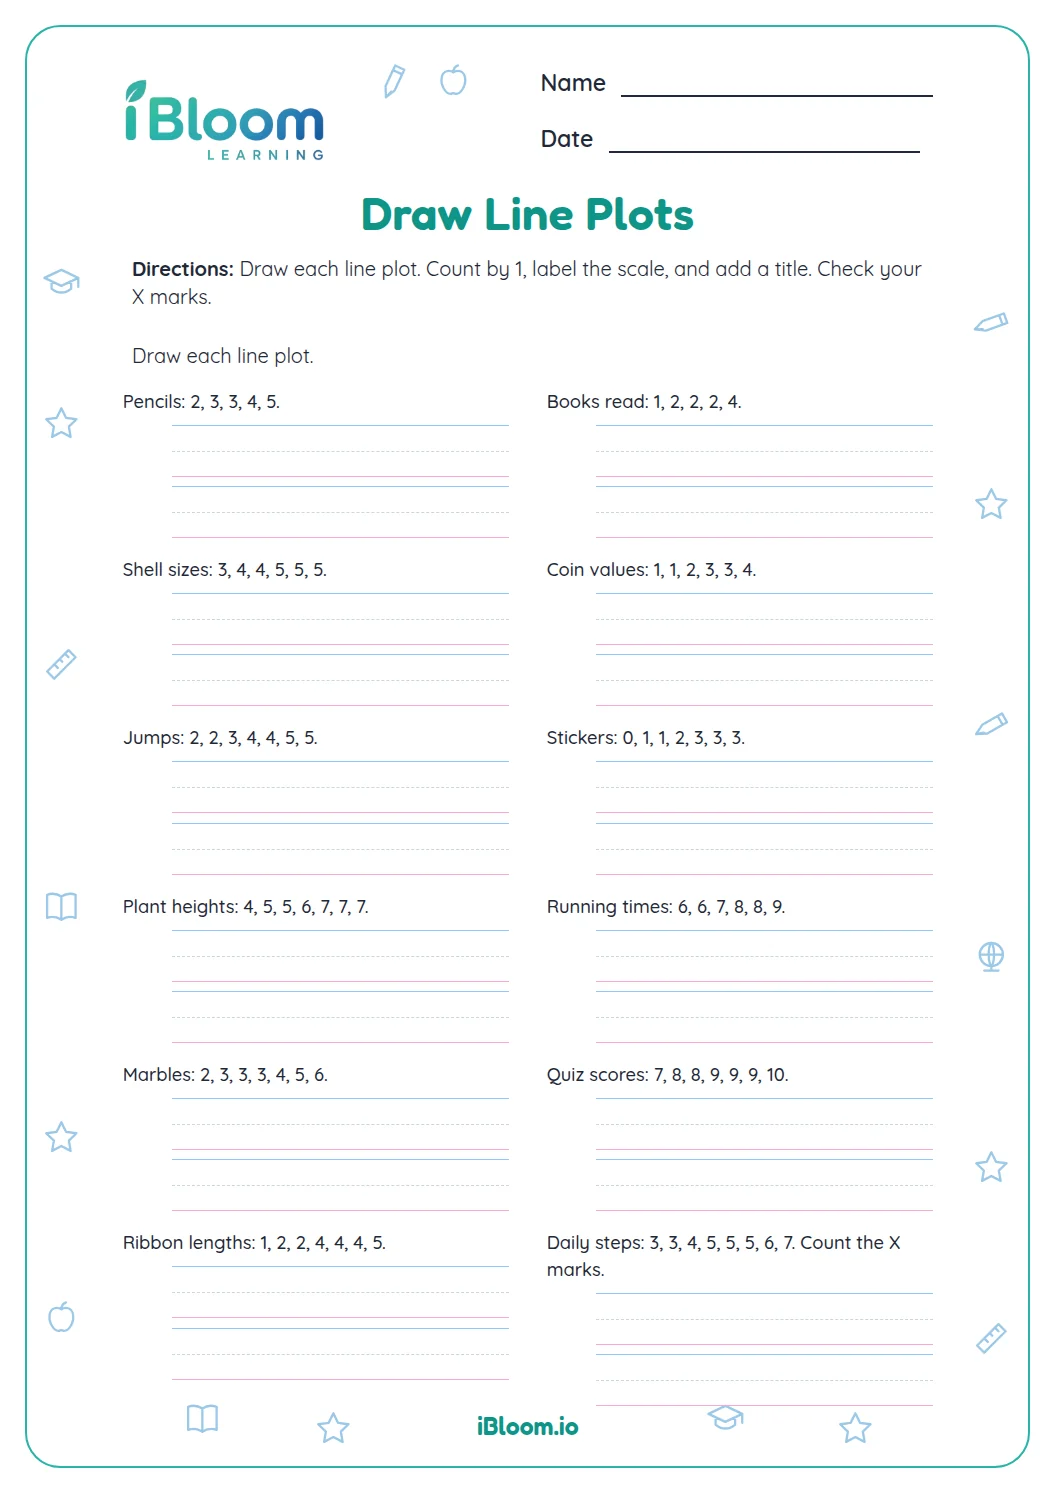
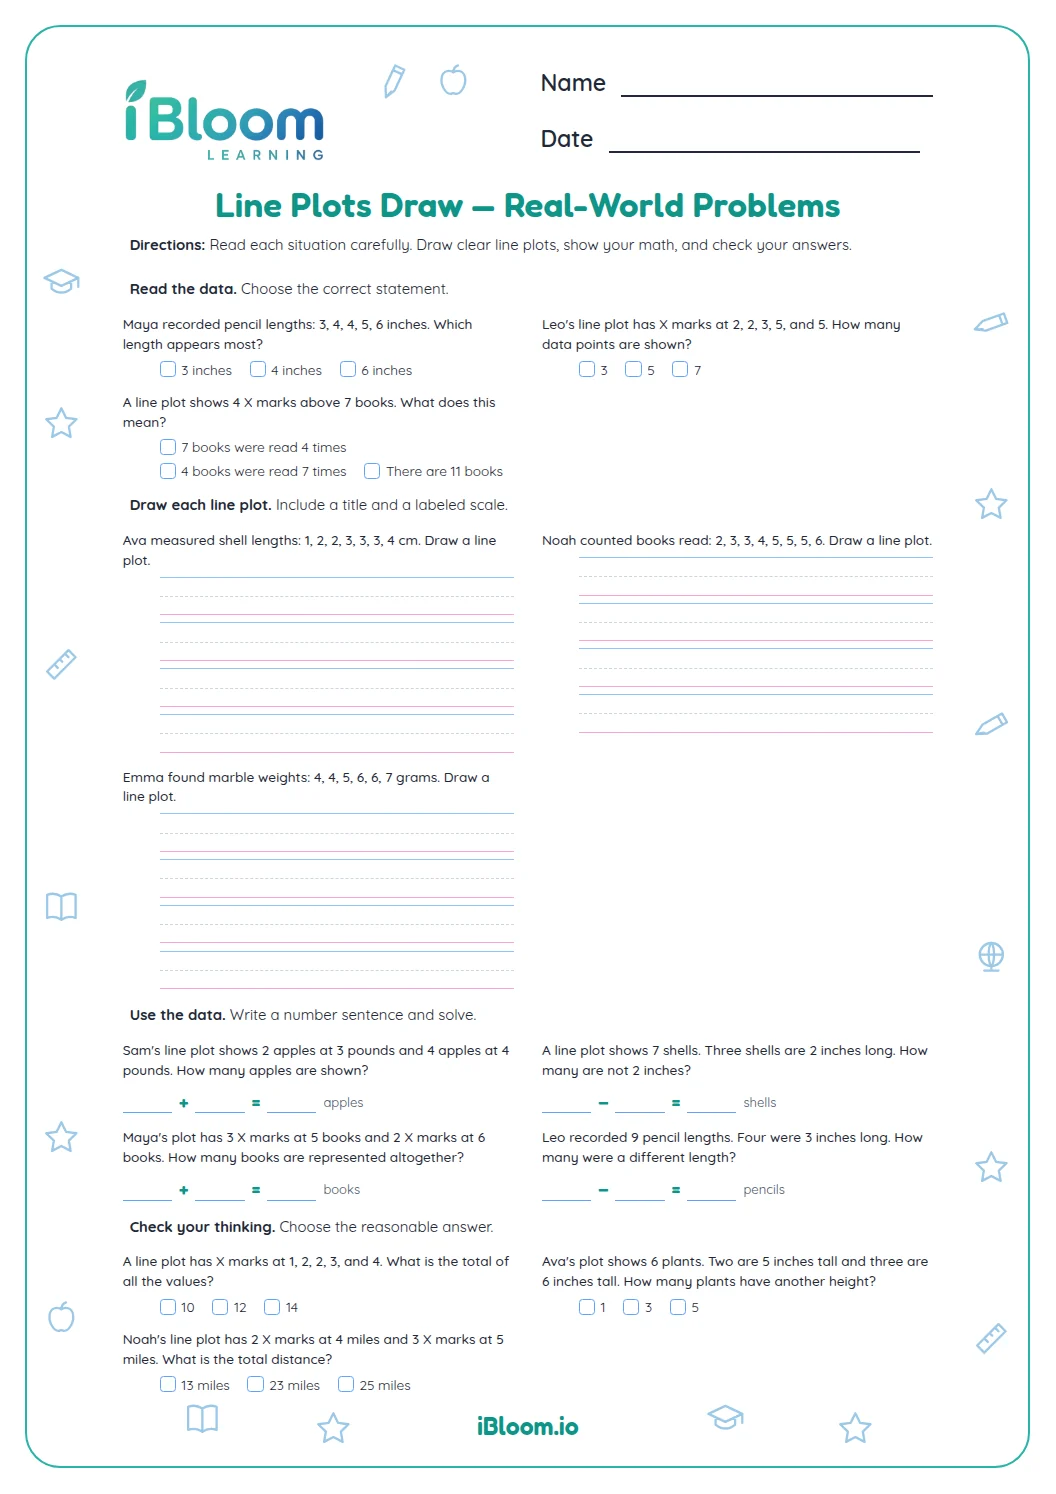
- 5When building a plot, add one X for each repeated data value.
Common mistakes and quick fixes
The mistake
Counting tick marks instead of X marks
The fix
Count the symbols in the column; the tick only labels a value.
The mistake
Mixing up adjacent fractions on the scale
The fix
Read the labels from left to right before counting the columns.
The mistake
Putting only one X for a repeated value
The fix
Use one X for every measurement, stacking repeats above the same tick.
Common Core alignment
This sheet practices the standard below through focused examples and independent practice.
Read and organize whole-inch, half-inch and quarter-inch measurement data on line plots.
On this sheet:
Show the official wordingHide the official wording
Generate measurement data by measuring lengths using rulers marked with halves and fourths of an inch. Show the data by making a line plot, where the horizontal scale is marked off in appropriate units— whole numbers, halves, or quarters.
What to practice next
Make more practice
Further reading
Questions parents and teachers ask
What does one X stand for?
One X stands for one measured item or object. If a value has four X marks above it, four measurements had that length. Count every X once, then compare the total with the values listed in the data set or shown on the line plot.
Which units appear on the worksheet?
The scales use whole inches, half inches and quarter inches. These are the units named in Grade 3 line plot work for measurement data. Count every X once, then compare the total with the values listed in the data set or shown on the line plot.
How do children know which length is most common?
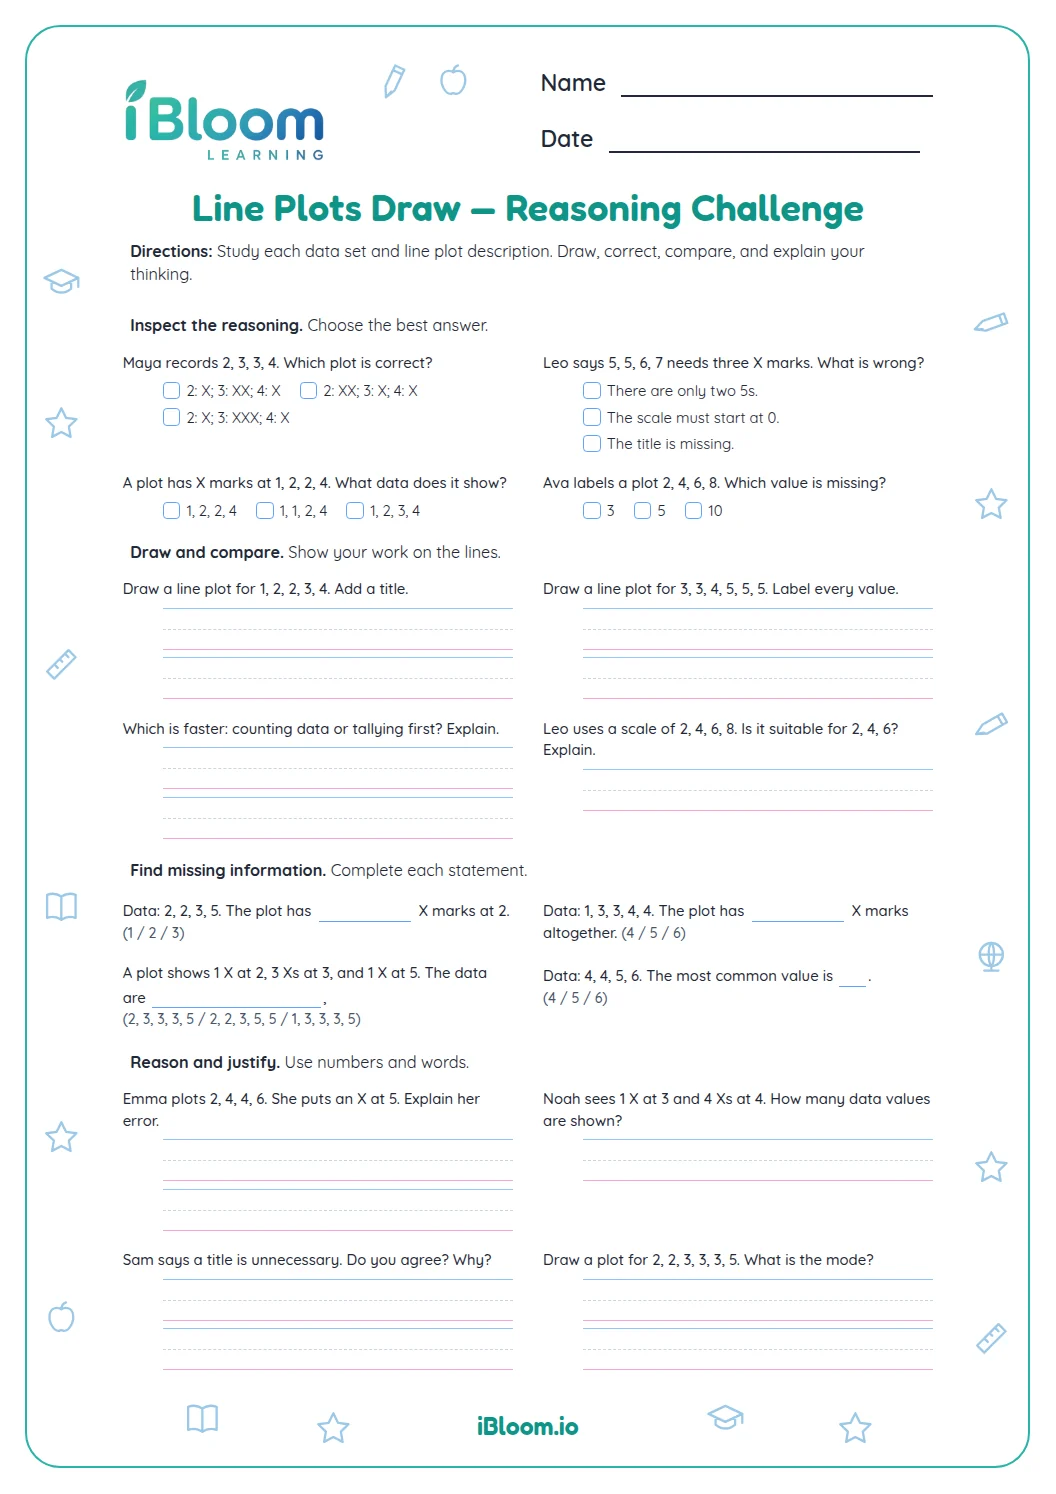
They compare the height of each X column. The length with the tallest column appears most often. Question 4 asks students to identify that value from its plot. Count every X once, then compare the total with the values listed in the data set or shown on the line plot.
How do you make a line plot from a list?
Find each measurement on the scale and place one X above that value. When a measurement repeats, stack another X in the same column. Then count the marks to answer questions. Count every X once, then compare the total with the values listed in the data set or shown on the line plot.
How many problems are included?
The printable has 14 questions in three parts. Students interpret four plots, answer four questions about the displayed data, and complete six compact questions about organizing and reading repeated values. Count every X once, then compare the total with the values listed in the data set or shown on the line plot.