
About this worksheet
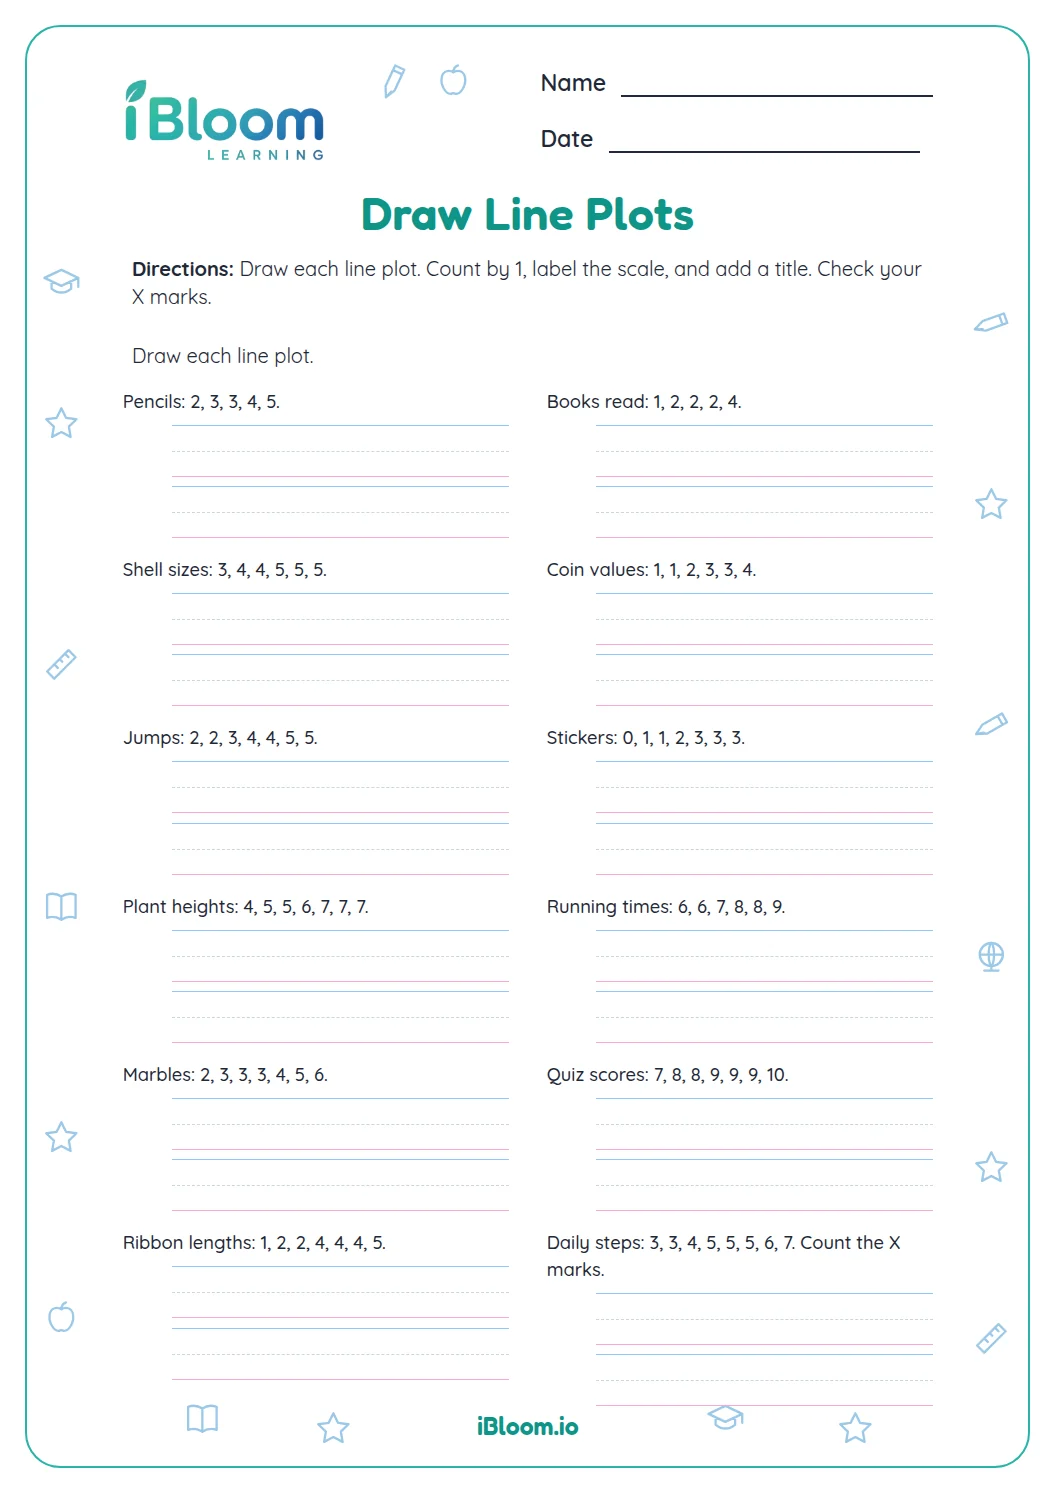
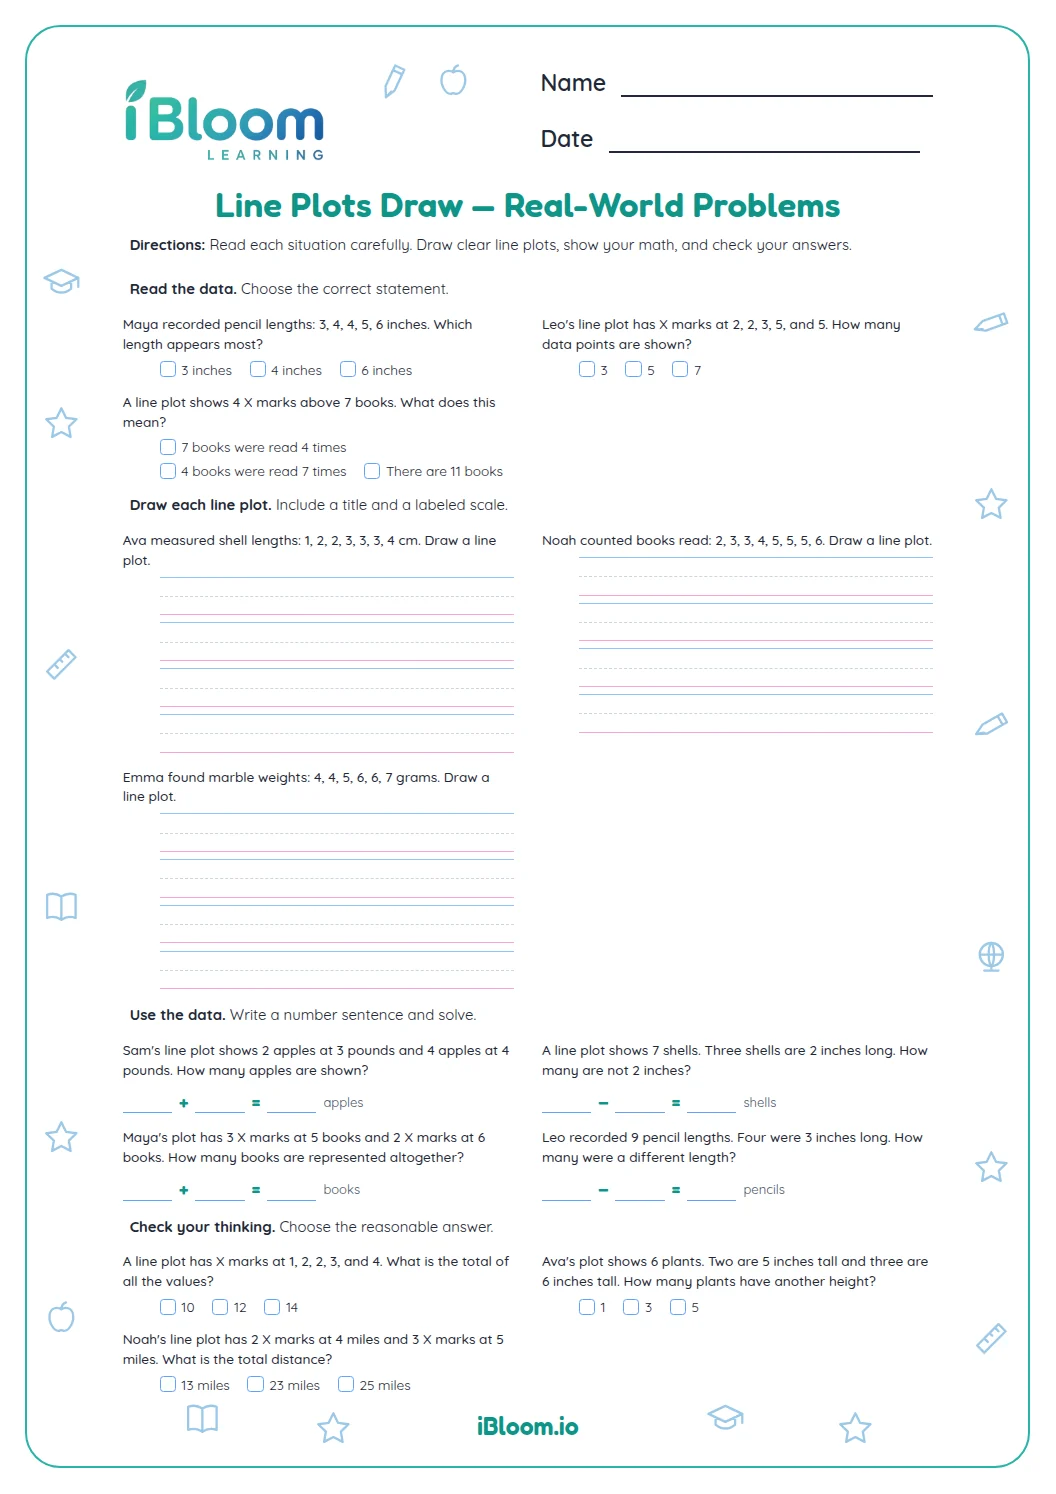
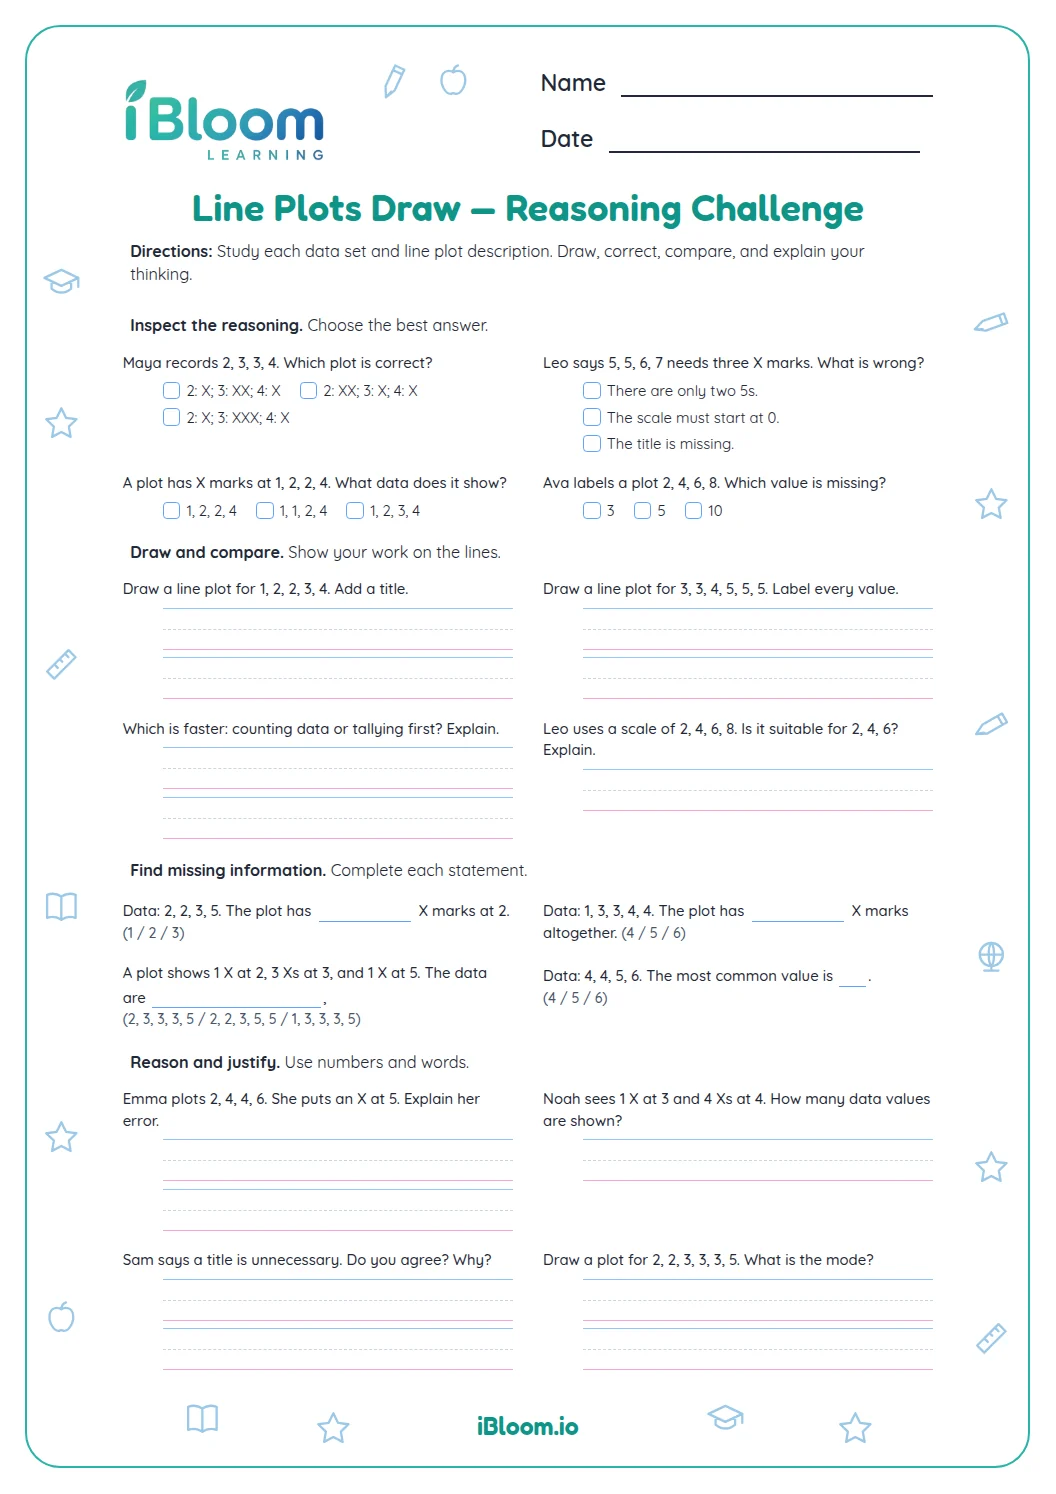
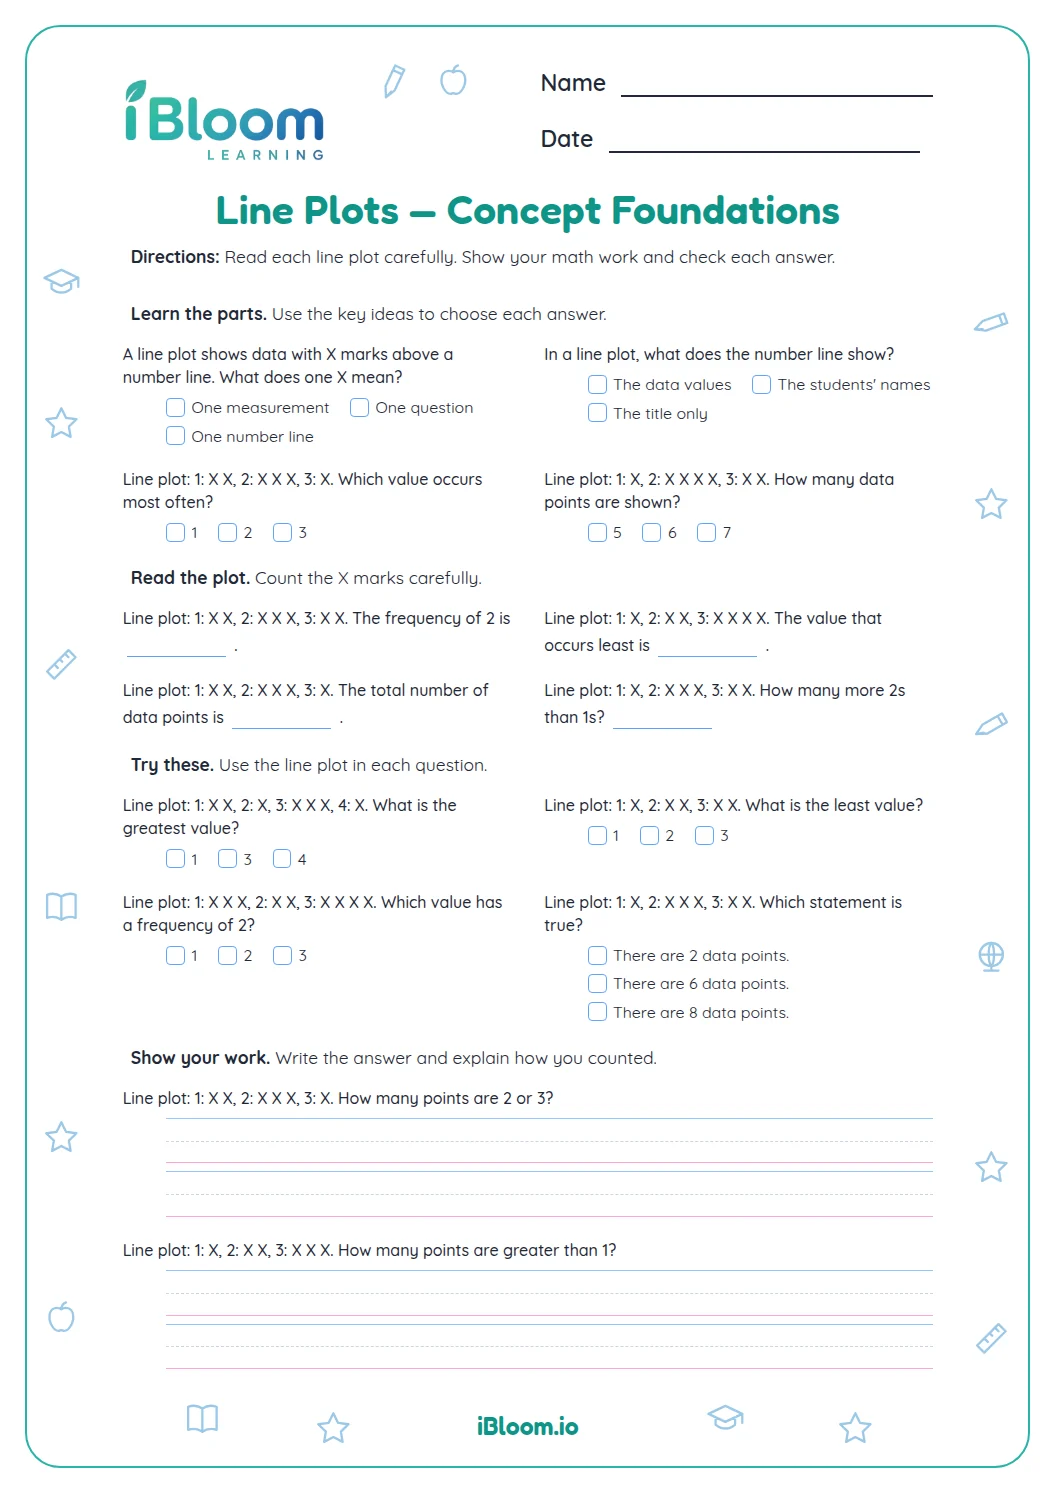
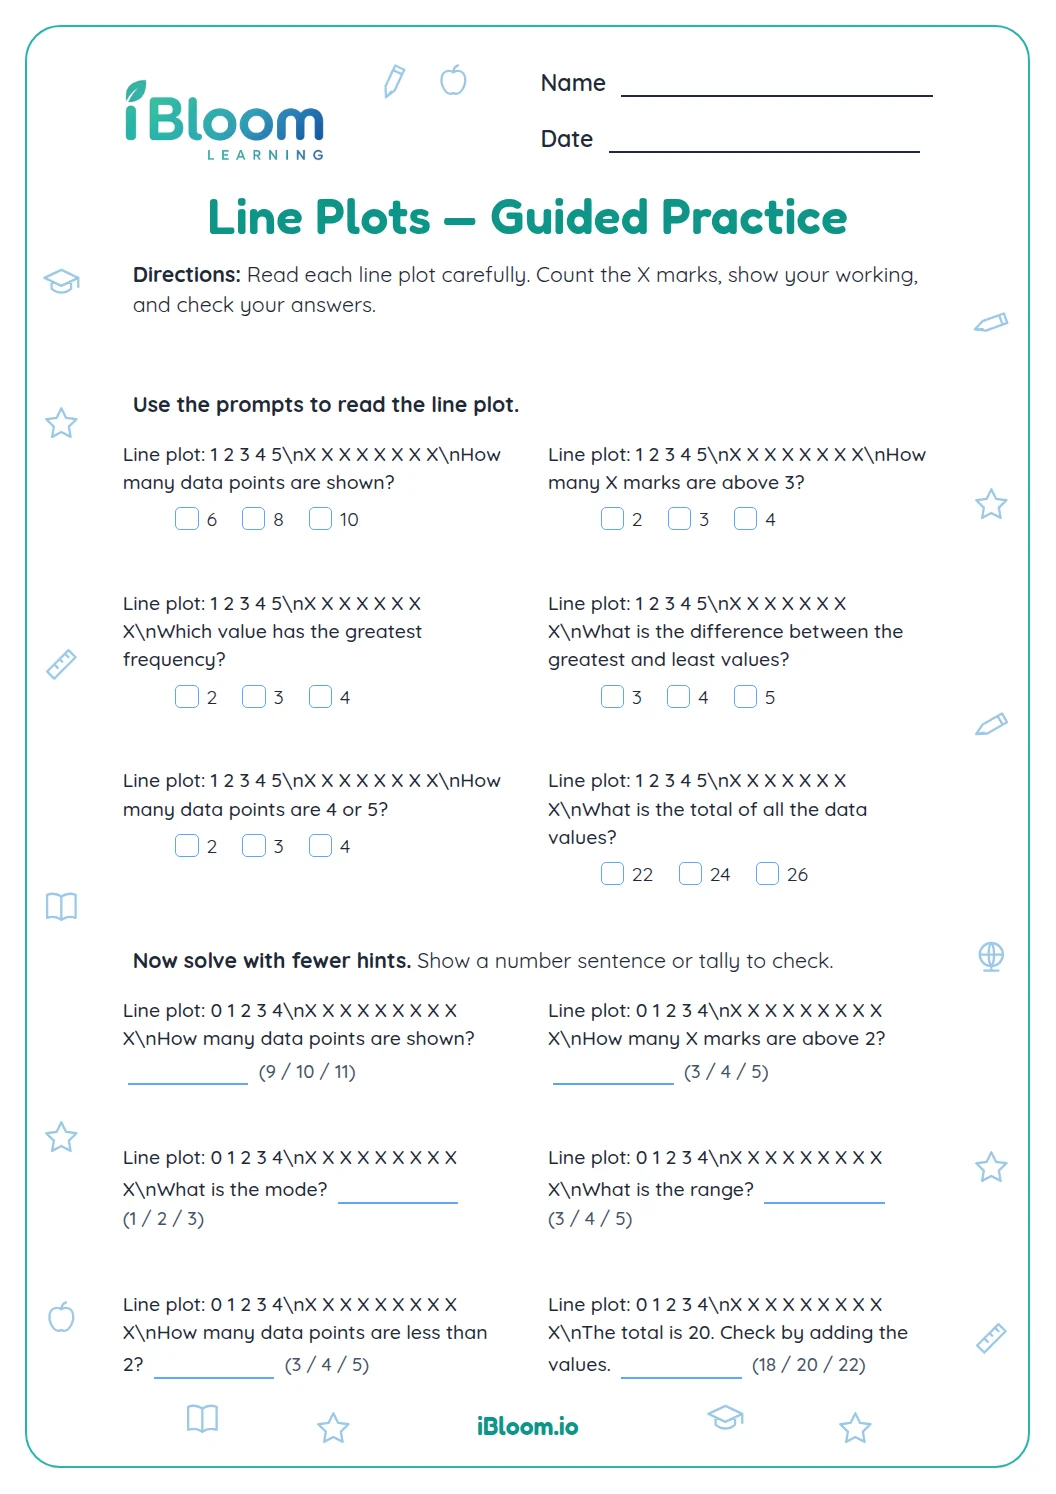
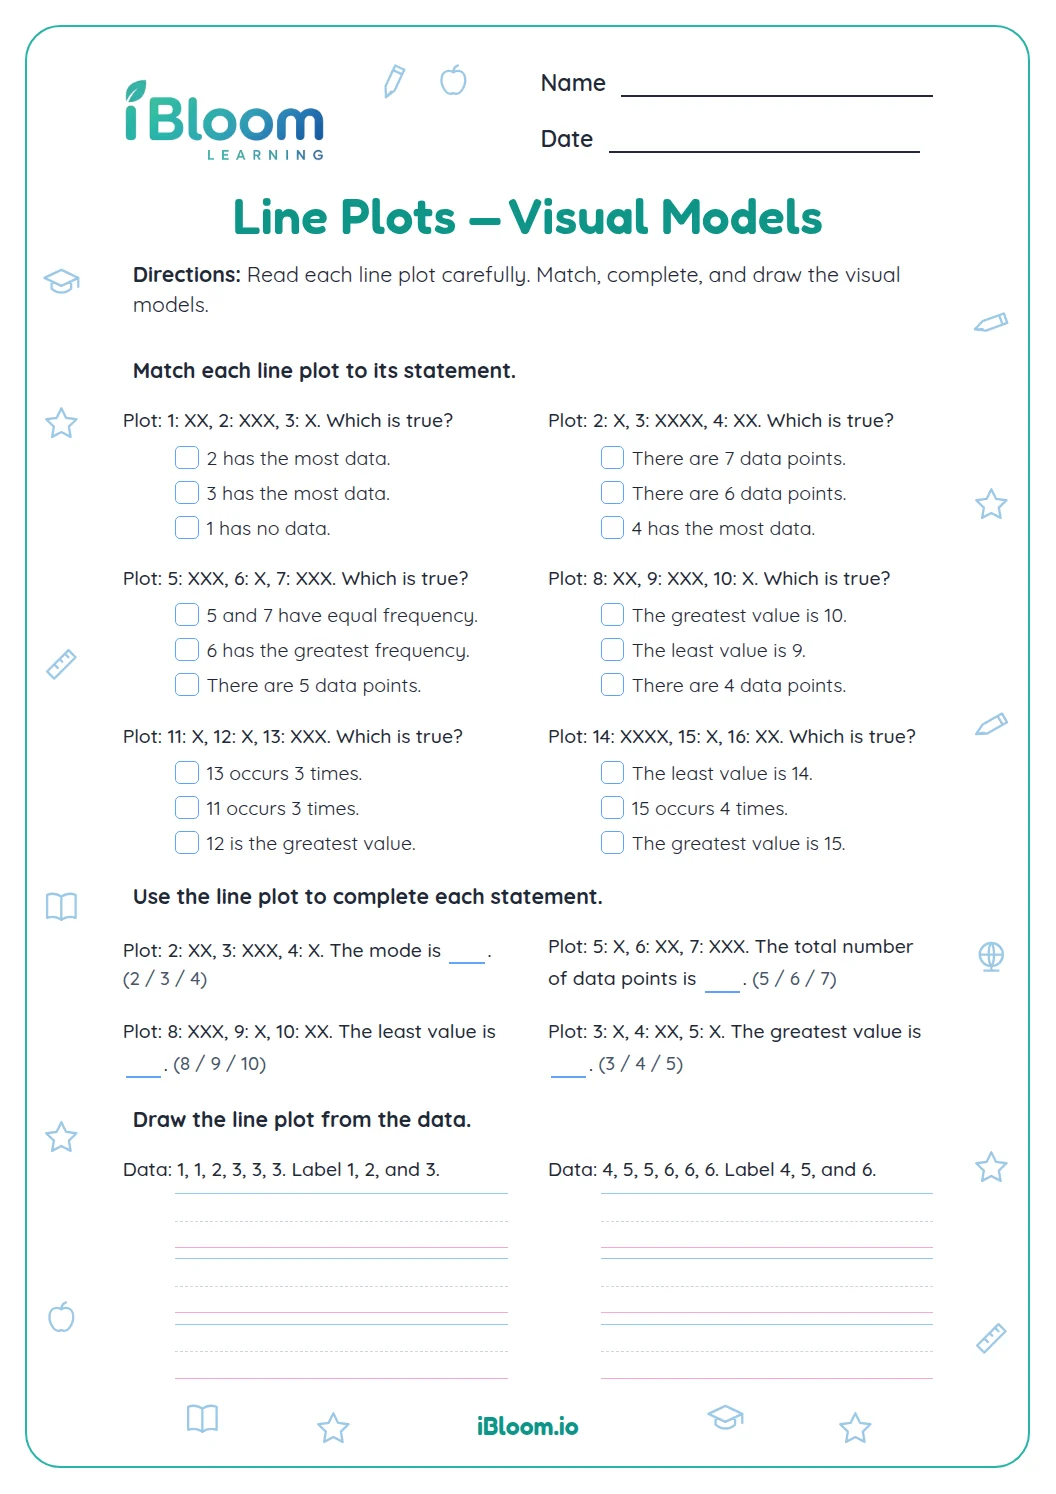
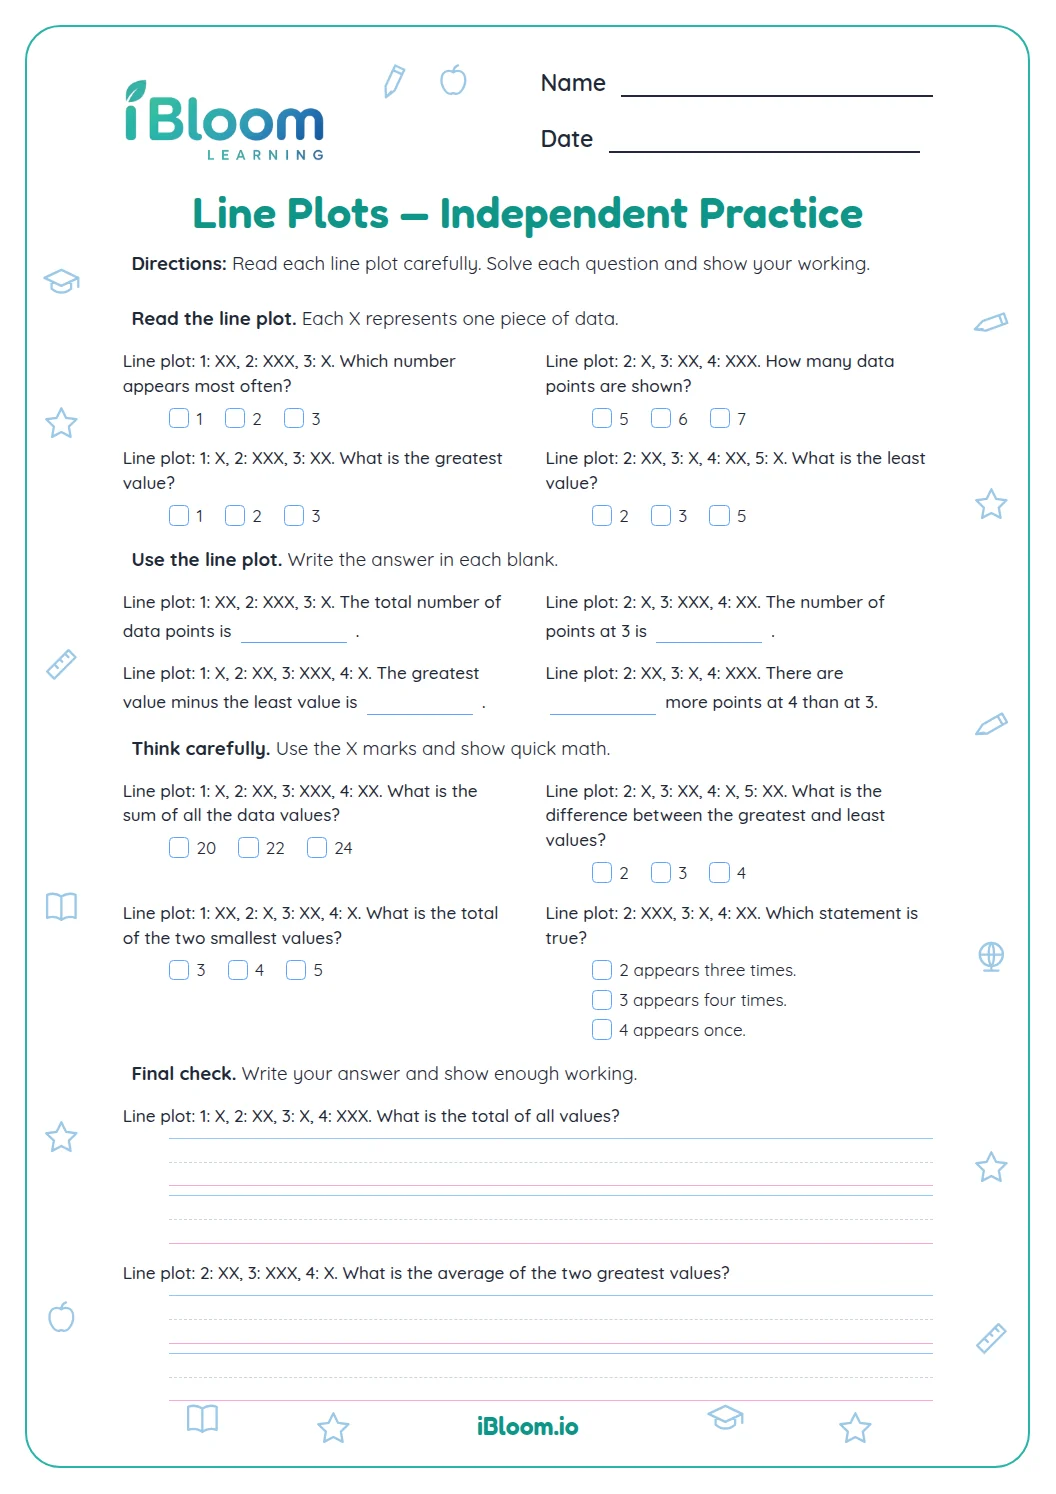
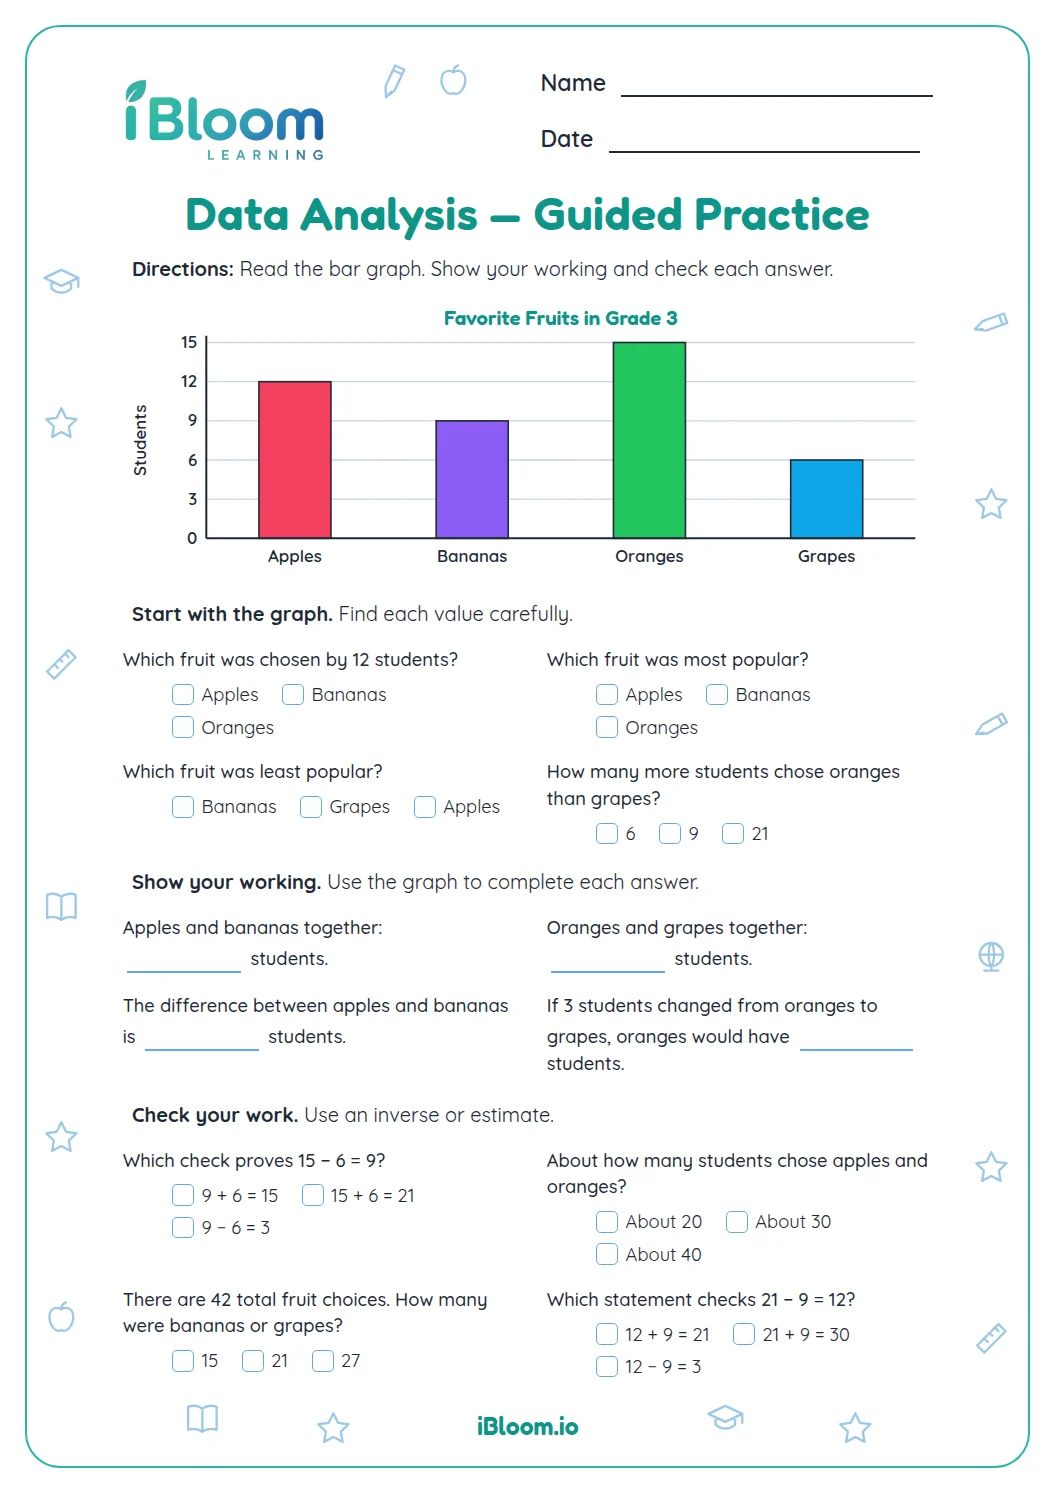
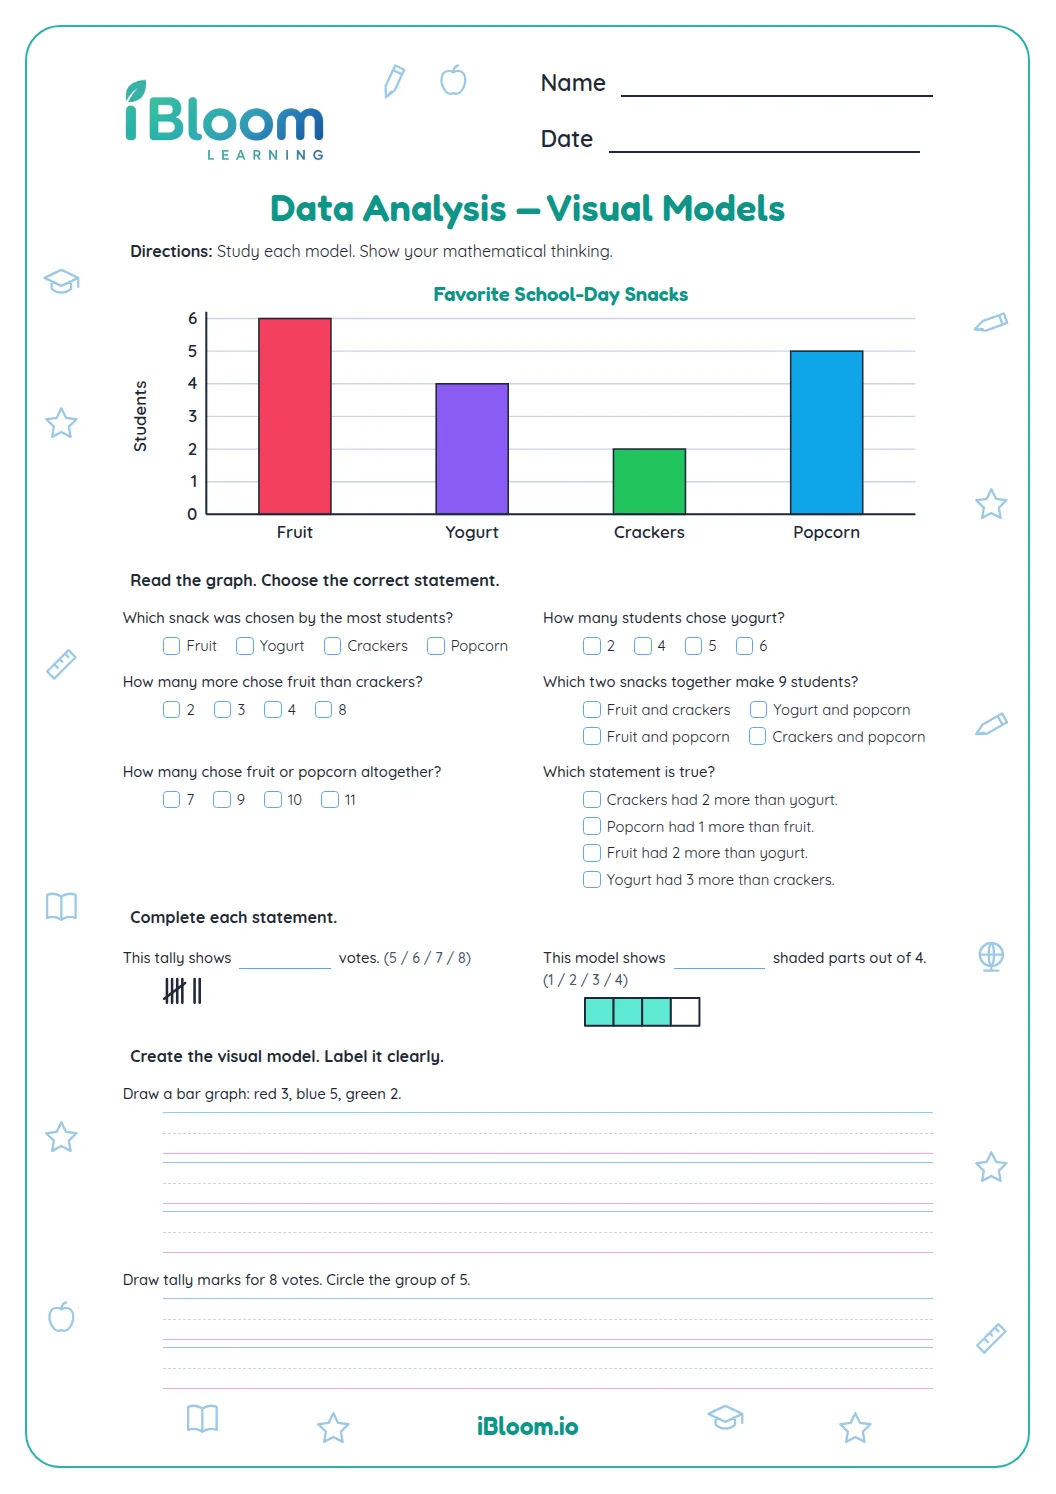
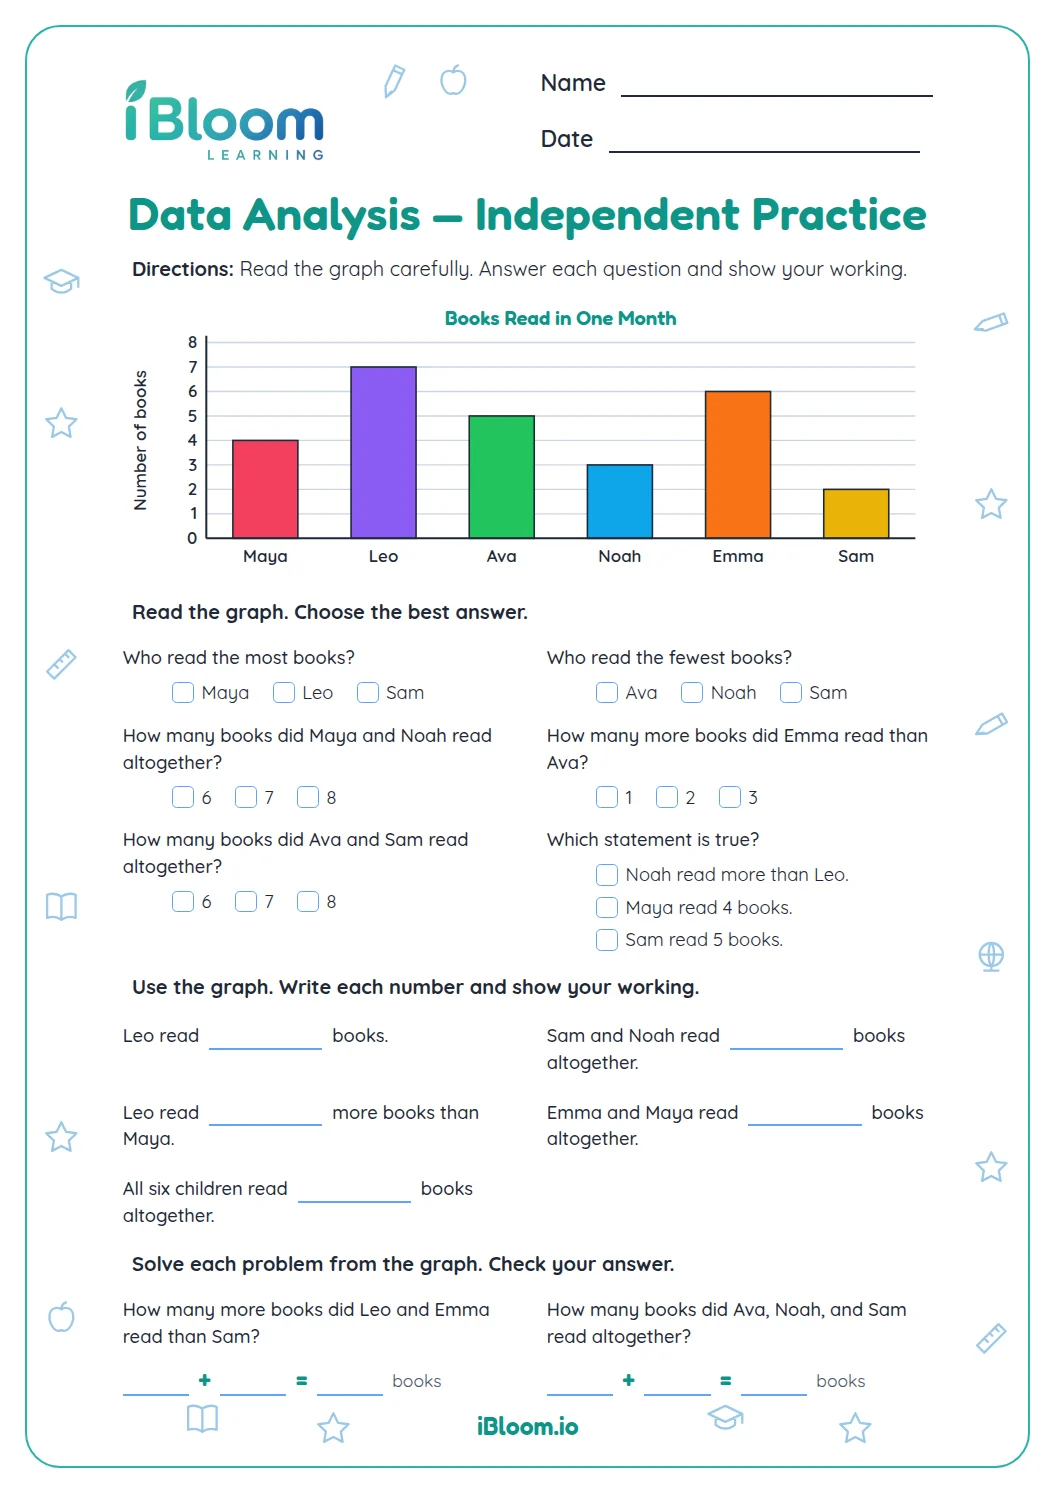
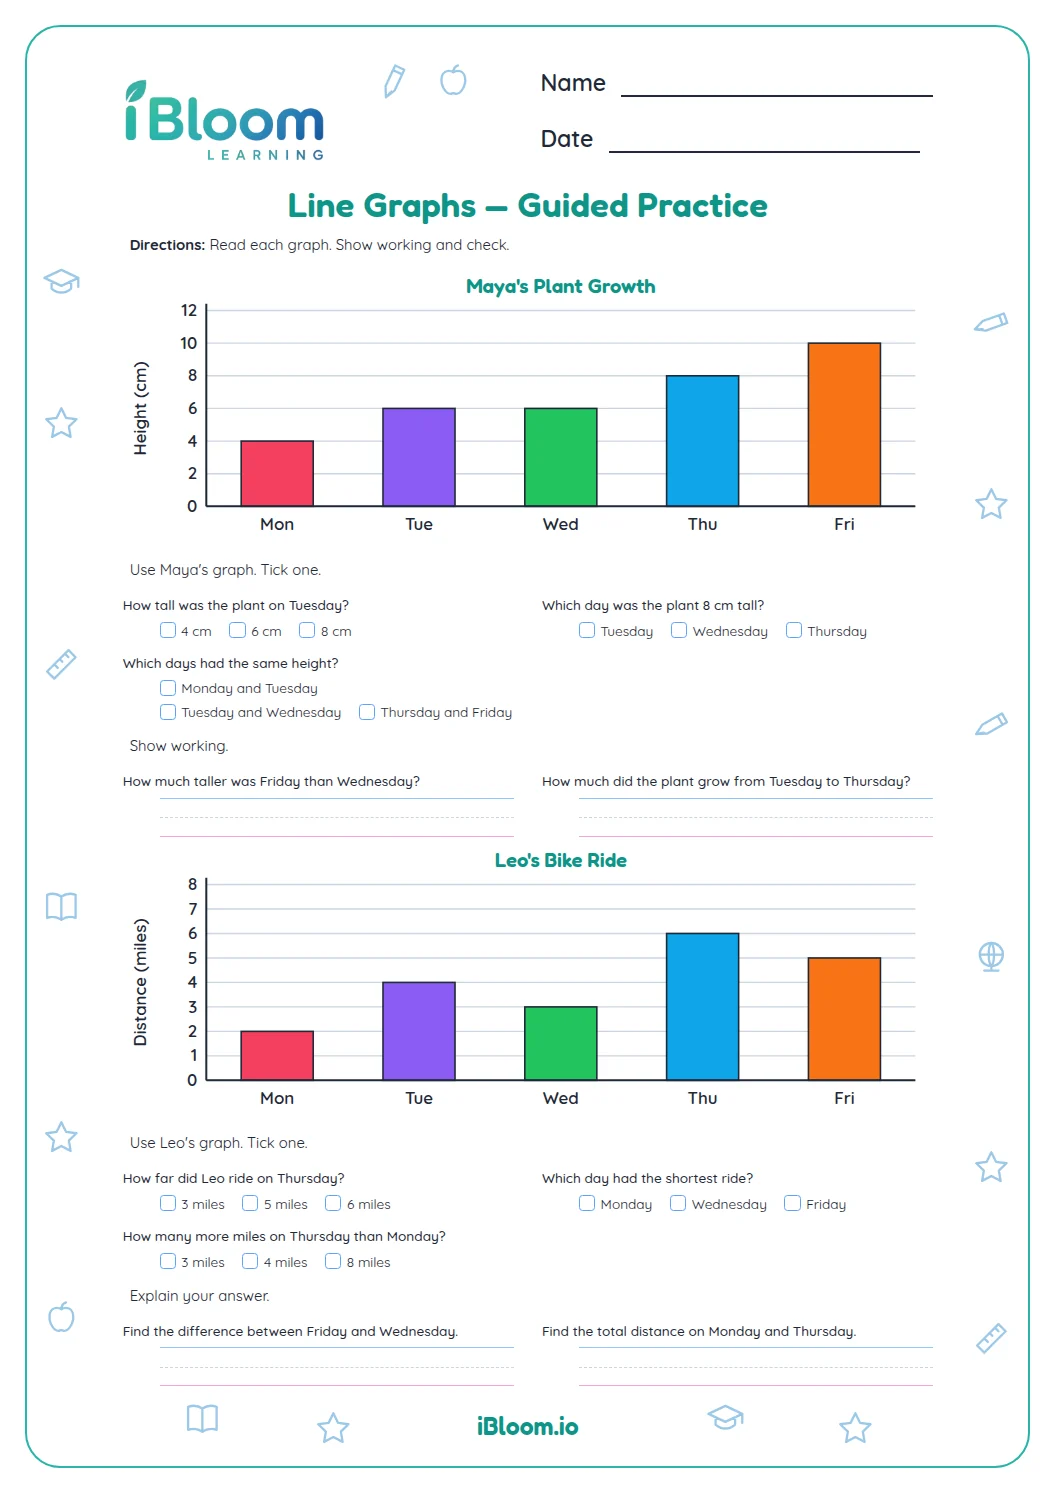
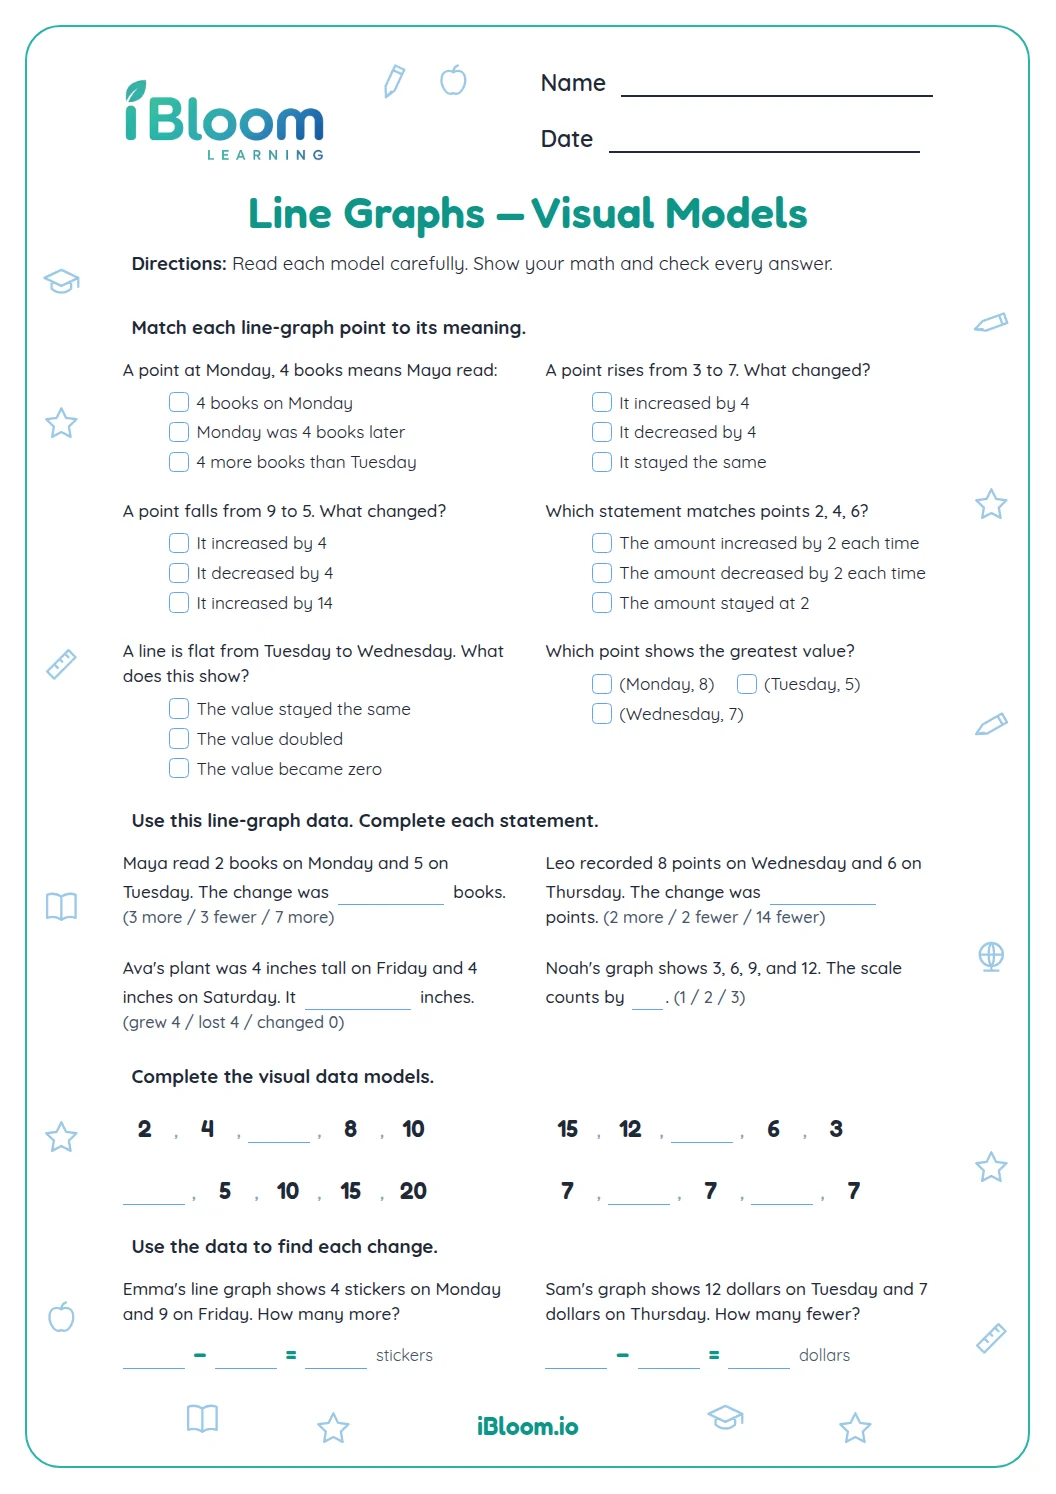
This Grade 3 printable replaces the old free-draw prompts with a clear sequence for building and reading line plots. Children read a plot of ribbon lengths in fourths of an inch, compare counts and total lengths, then draw a second plot from four values and their counts. The final questions apply the same measurement and data skills. A separate answer key gives the target counts for checking the drawing. This practices CCSS 3.MD.B.4: measuring in halves or fourths of an inch and representing measurement data on a line plot.
Aligned to 3.MD.B.4
What does this worksheet practice?
Draw, read, and use line plots. Children read a plot of ribbon lengths in fourths of an inch, compare counts and total lengths, then draw a second plot from four values and their counts
How can a learner solve one question?
Use the question as a model, then check each step against the words, numbers, or clues in the prompt.
- 1The plot has four X marks above 3/4 inch.
- 2The 1/4-inch column has two X marks.
- 34 − 2 = 2 more measurements at 3/4 inch.
How should an adult use the answer key?
Check the answer after the learner completes a part. For open responses, accept a different answer when it is clear and uses the target skill.
How to use this worksheet
- 1Read the instructions and the first part heading.
- 2Complete each question in order, showing a step when useful.
- 3Reread the prompt before choosing or writing an answer.
- 4Use the answer key after finishing a part.
- 5Review a missed answer by explaining the word, value, or clue that supports the correction.
Common mistakes and quick fixes
The mistake
Rereading only part of the prompt
The fix
Read the complete sentence or expression before responding.
The mistake
Using a familiar answer without checking the target skill
The fix
Point to the specific word, number, or clue that supports the answer.
The mistake
Leaving a question blank
The fix
Return to the question and write one clear answer before checking the key.
Common Core alignment
This worksheet practices the listed Common Core skill.
Measure to fourths of an inch and represent the data on a line plot.
On this sheet: Measure to fourths of an inch and represent the data on a line plot.
Show the official wordingHide the official wording
Generate measurement data by measuring lengths using rulers marked with halves and fourths of an inch. Show the data by making a line plot, where the horizontal scale is marked off in appropriate units: whole numbers, halves, or quarters.
What to practice next
Make more practice
Further reading
Questions parents and teachers ask
What does the line plot show?
It shows ribbon lengths measured in inches, with values from one-fourth inch to one inch. Each X represents one measured piece. Children use the columns to compare frequencies and calculate combined lengths, then make a second plot from a short list of counts.
Does this page include a drawing task?
Yes. One question asks the learner to draw a line plot for four measurements and their counts. The other questions use a printed plot so the child can practice reading, comparing, and reasoning with the same kind of data.
How should my child find the total length?
For a group of equal-length pieces, multiply the length of one piece by the number of pieces. For example, four pieces that are each three-fourths inch long have a combined length of three inches. Keep the unit in the answer.
What is included in the answer key?
The separate answer key gives the answers to the plot-reading and fraction questions, plus the expected count above each value for the drawing task. A neatly drawn plot can look different while still showing the correct number of X marks.
How long might this take?
Plan for about 25 minutes, with extra time if the learner needs to draw carefully or explain a fraction total. It can also be completed in shorter sittings: read the first plot, then return for the drawing and application questions.