
About this worksheet
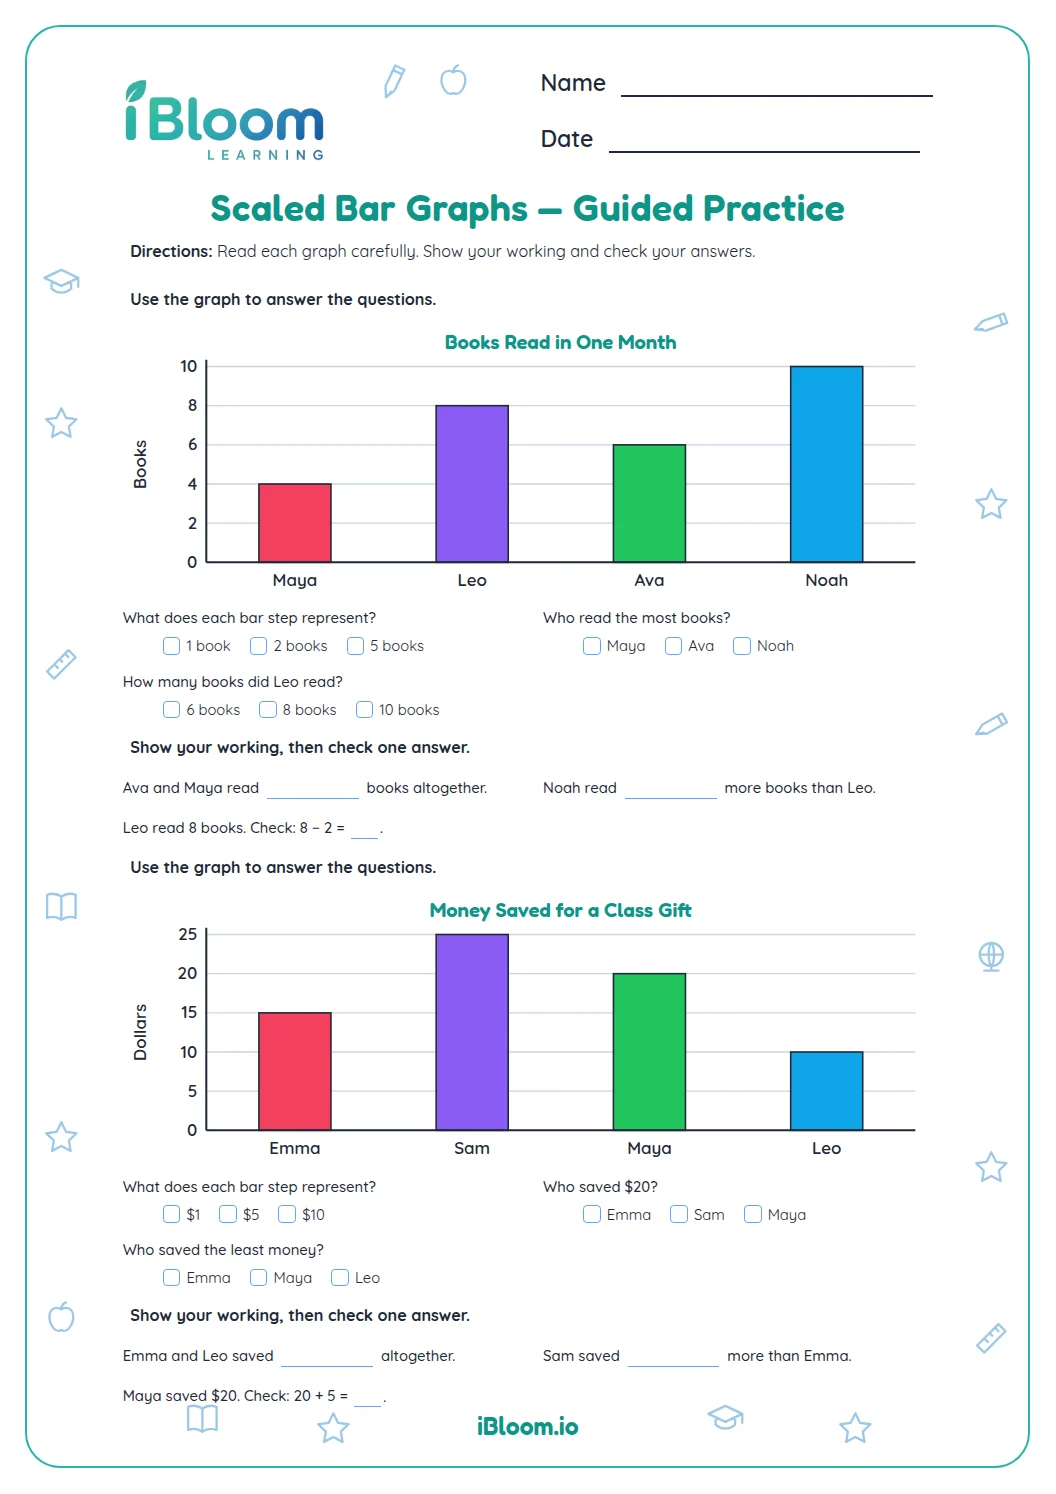
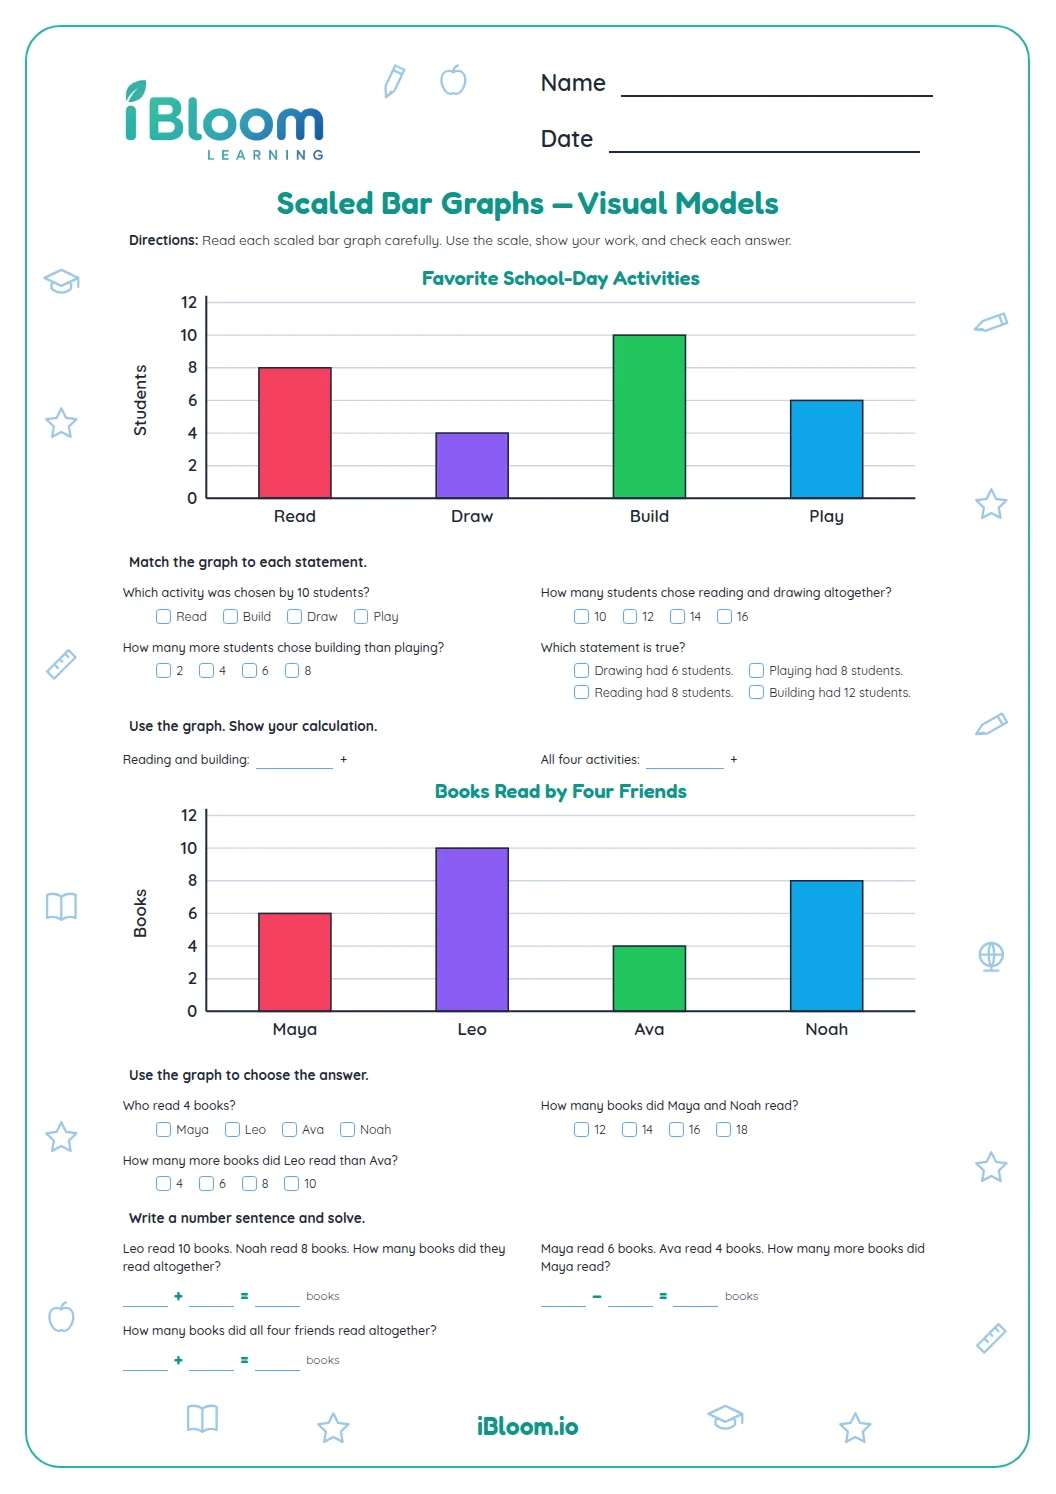
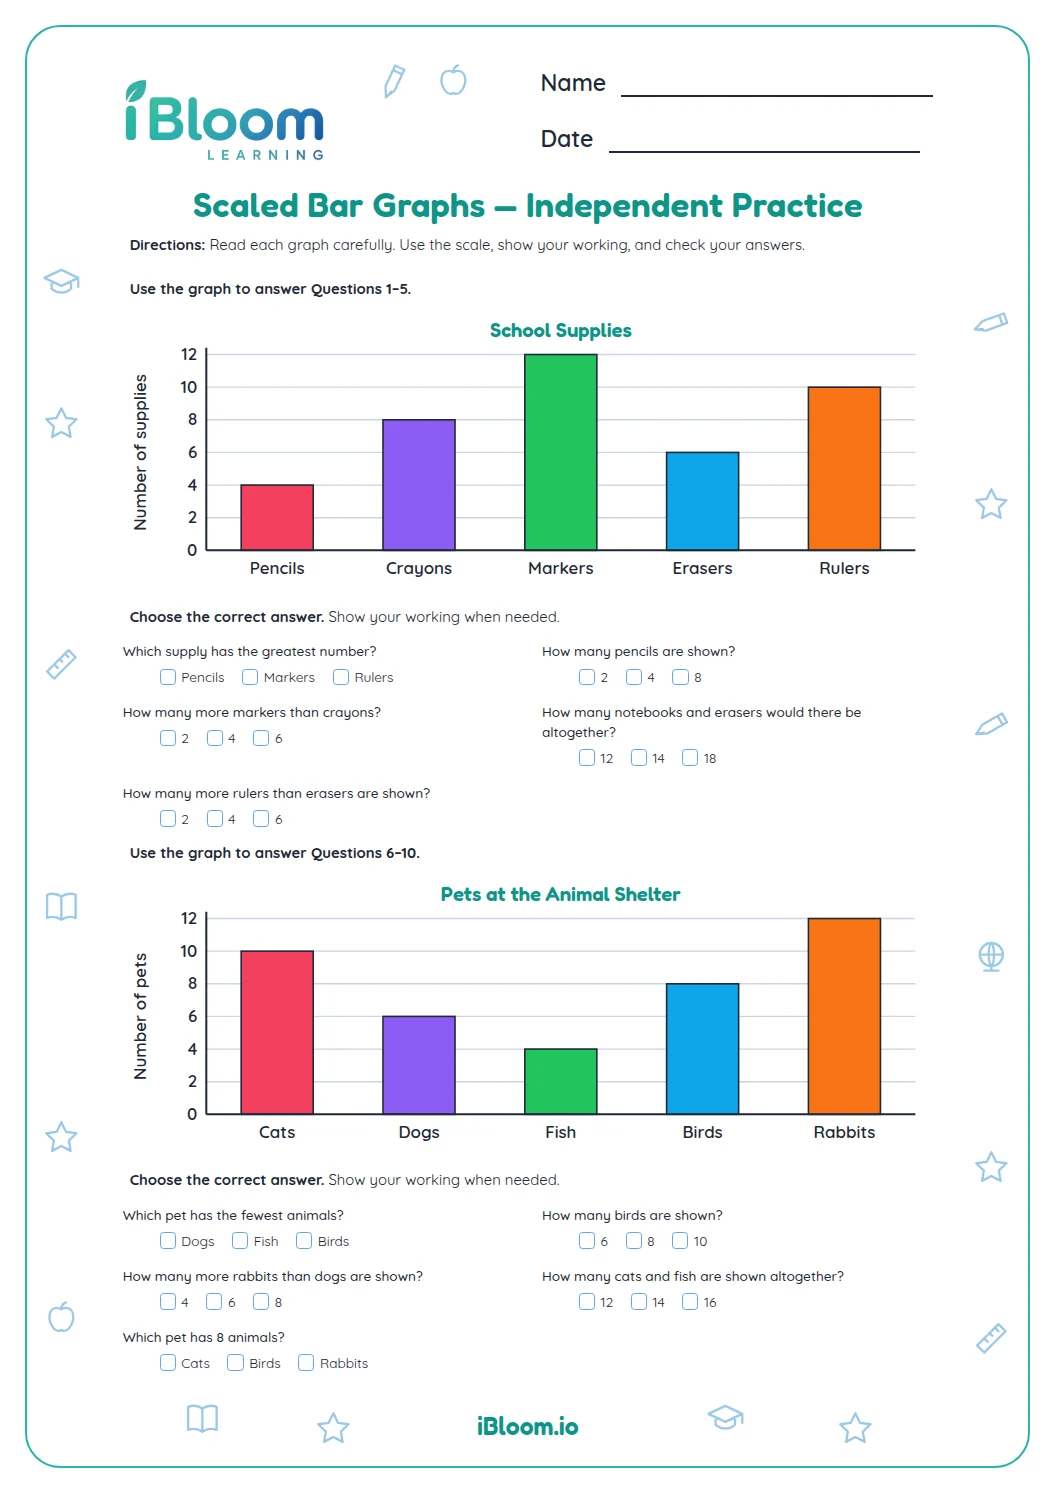
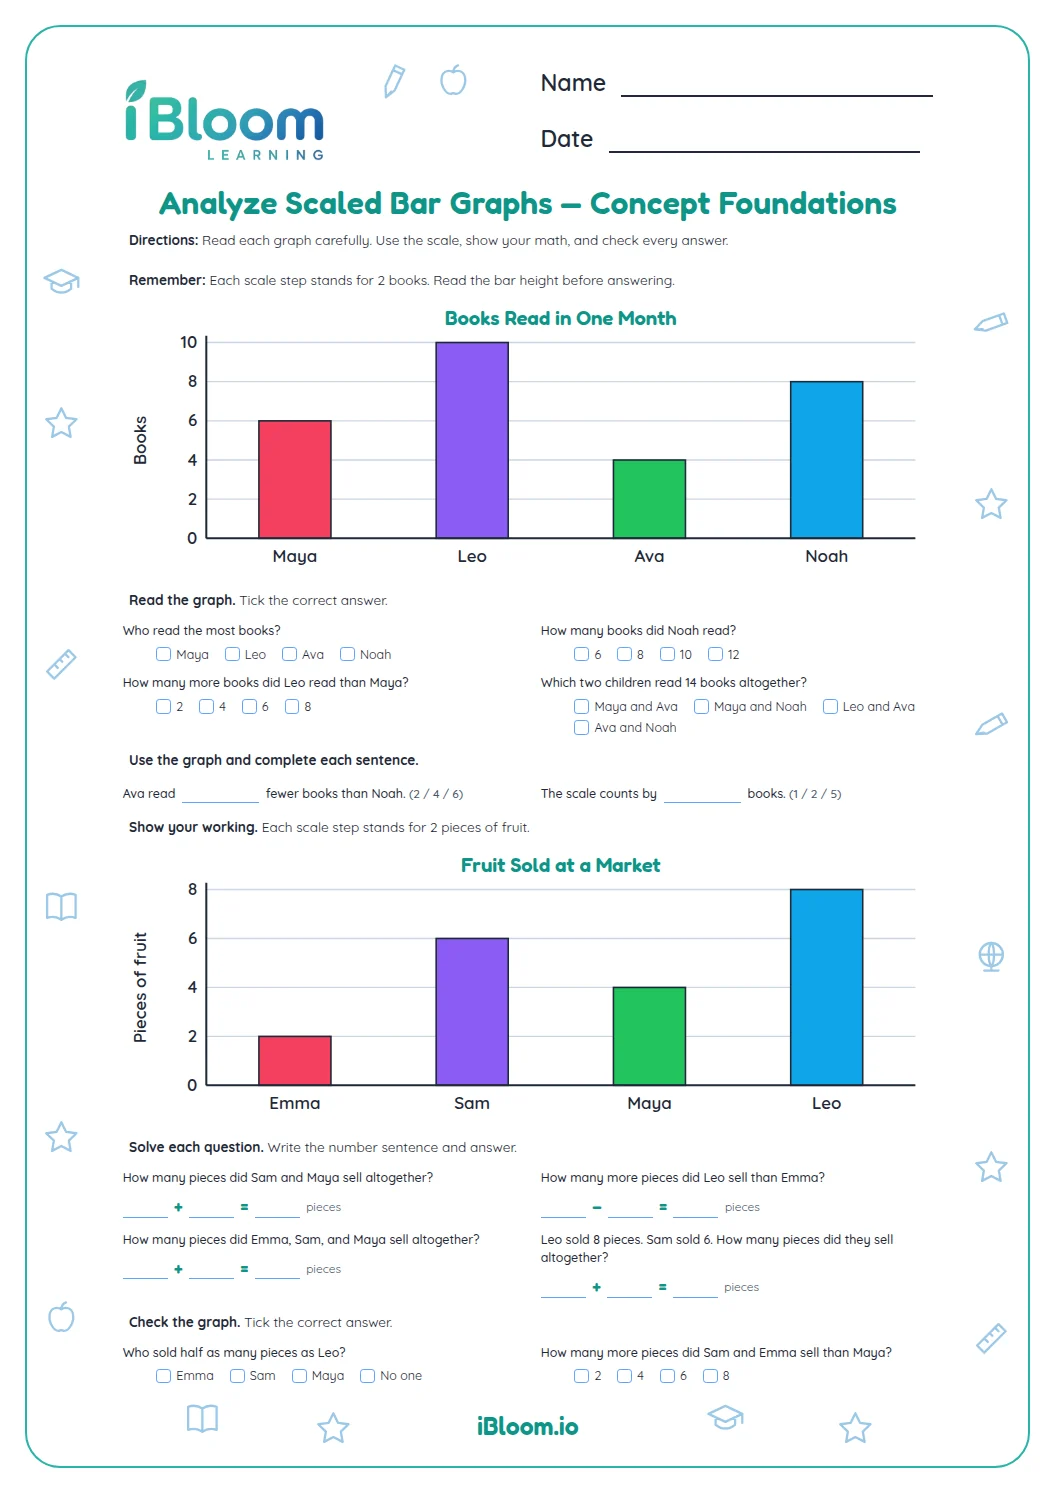
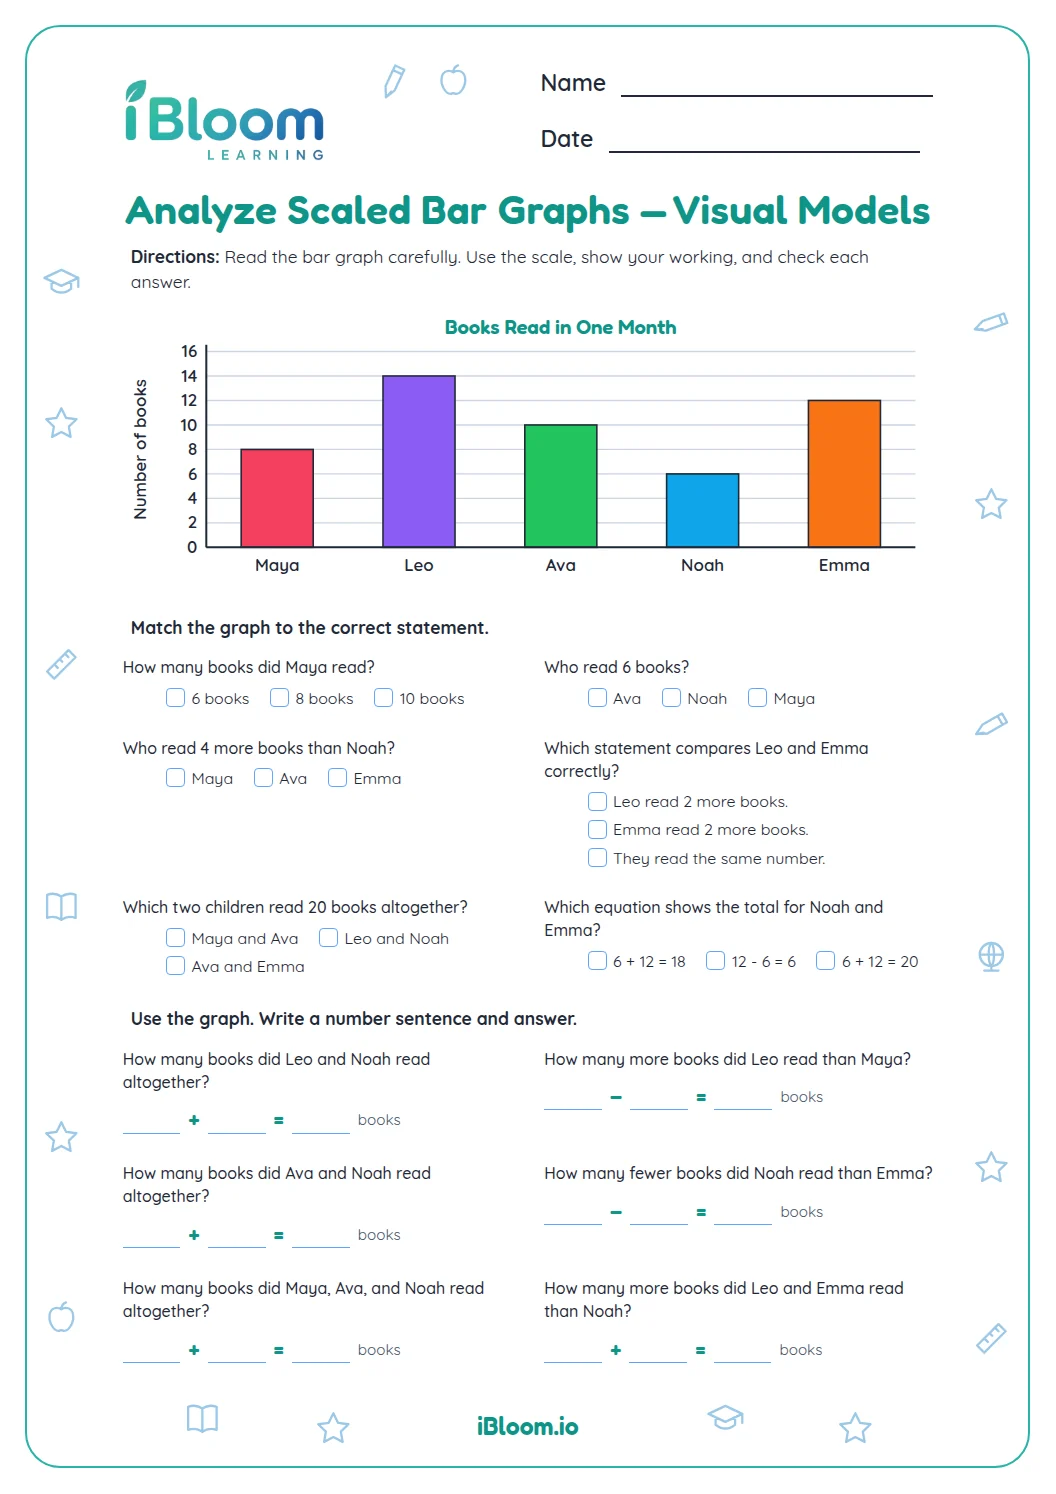
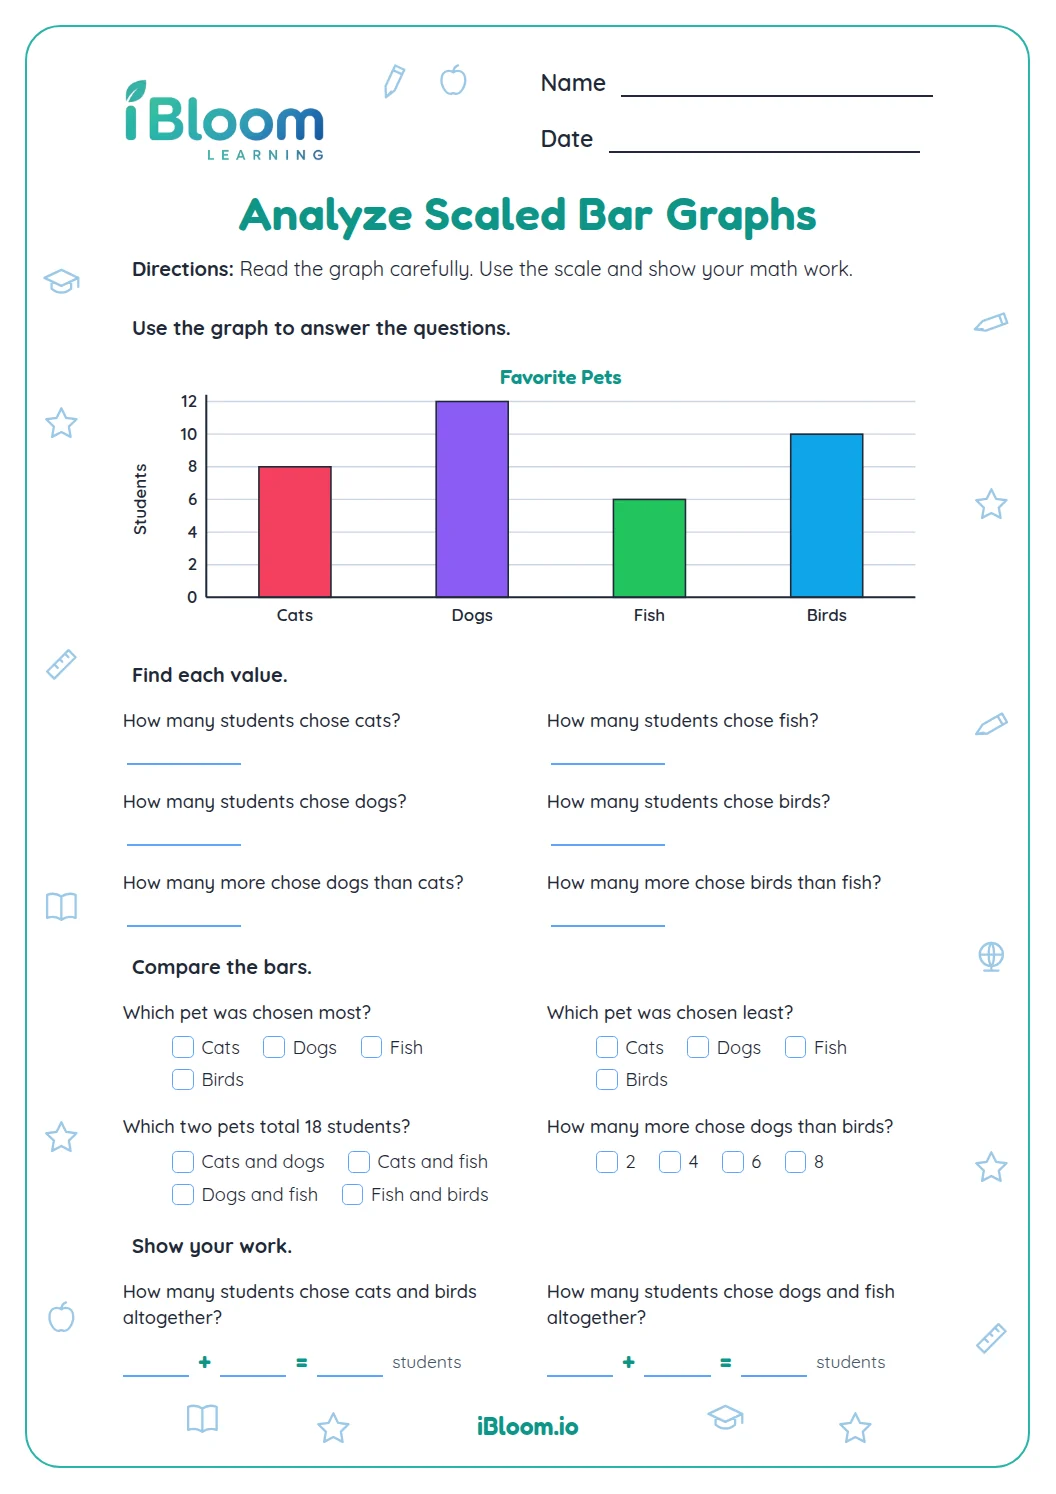
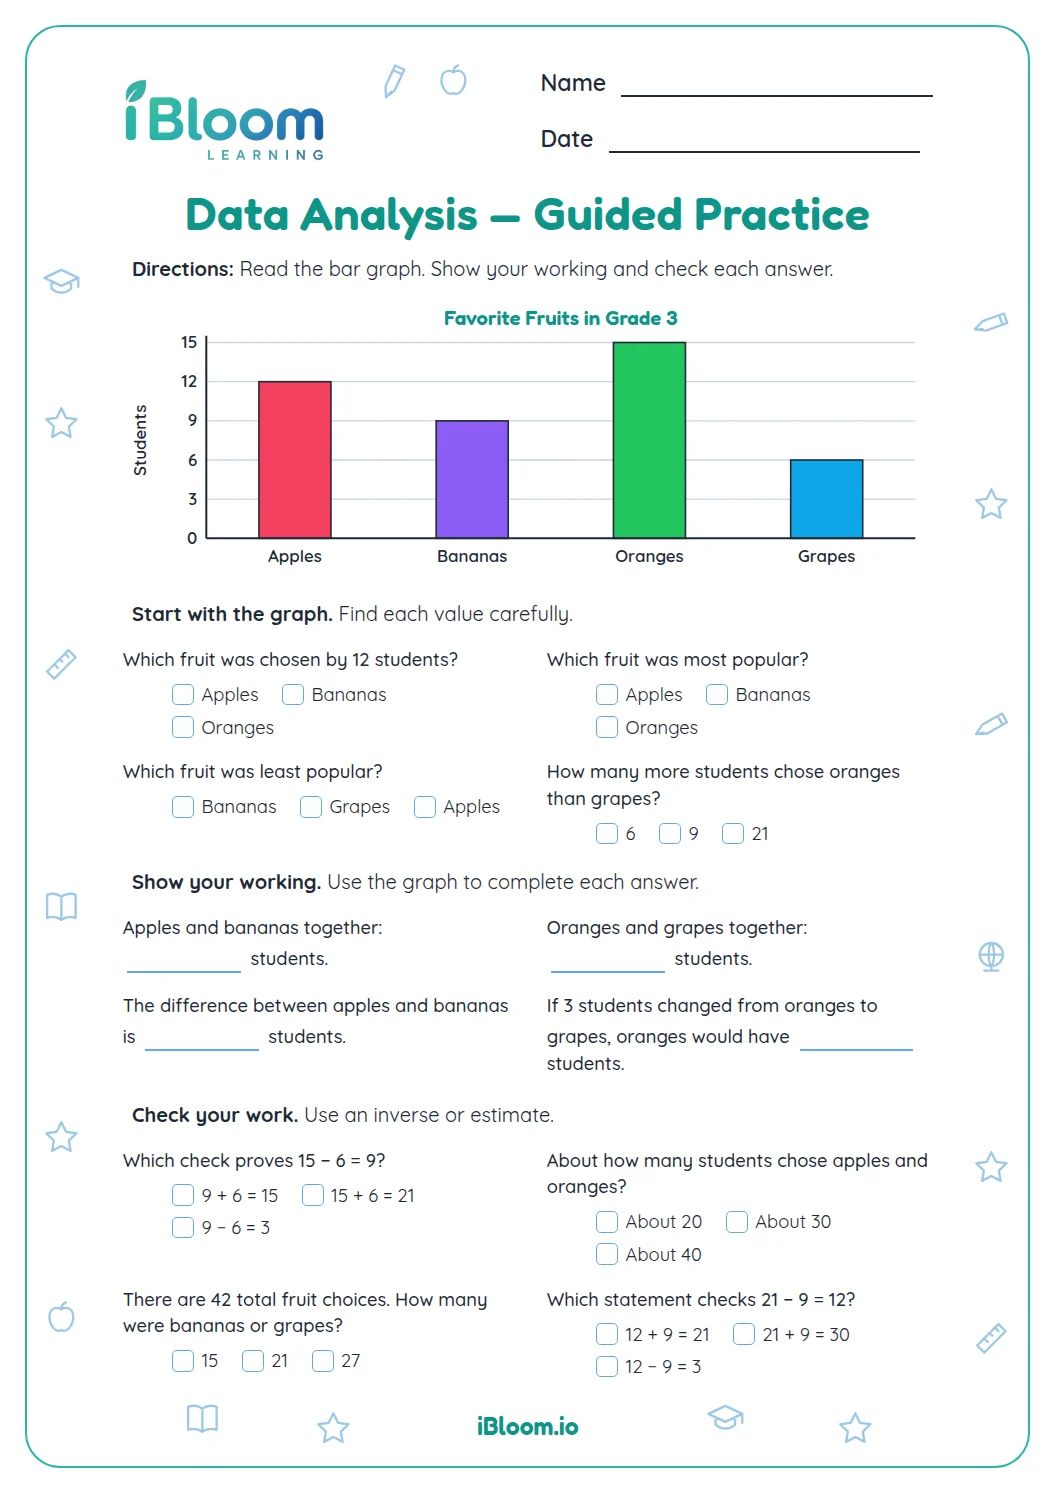
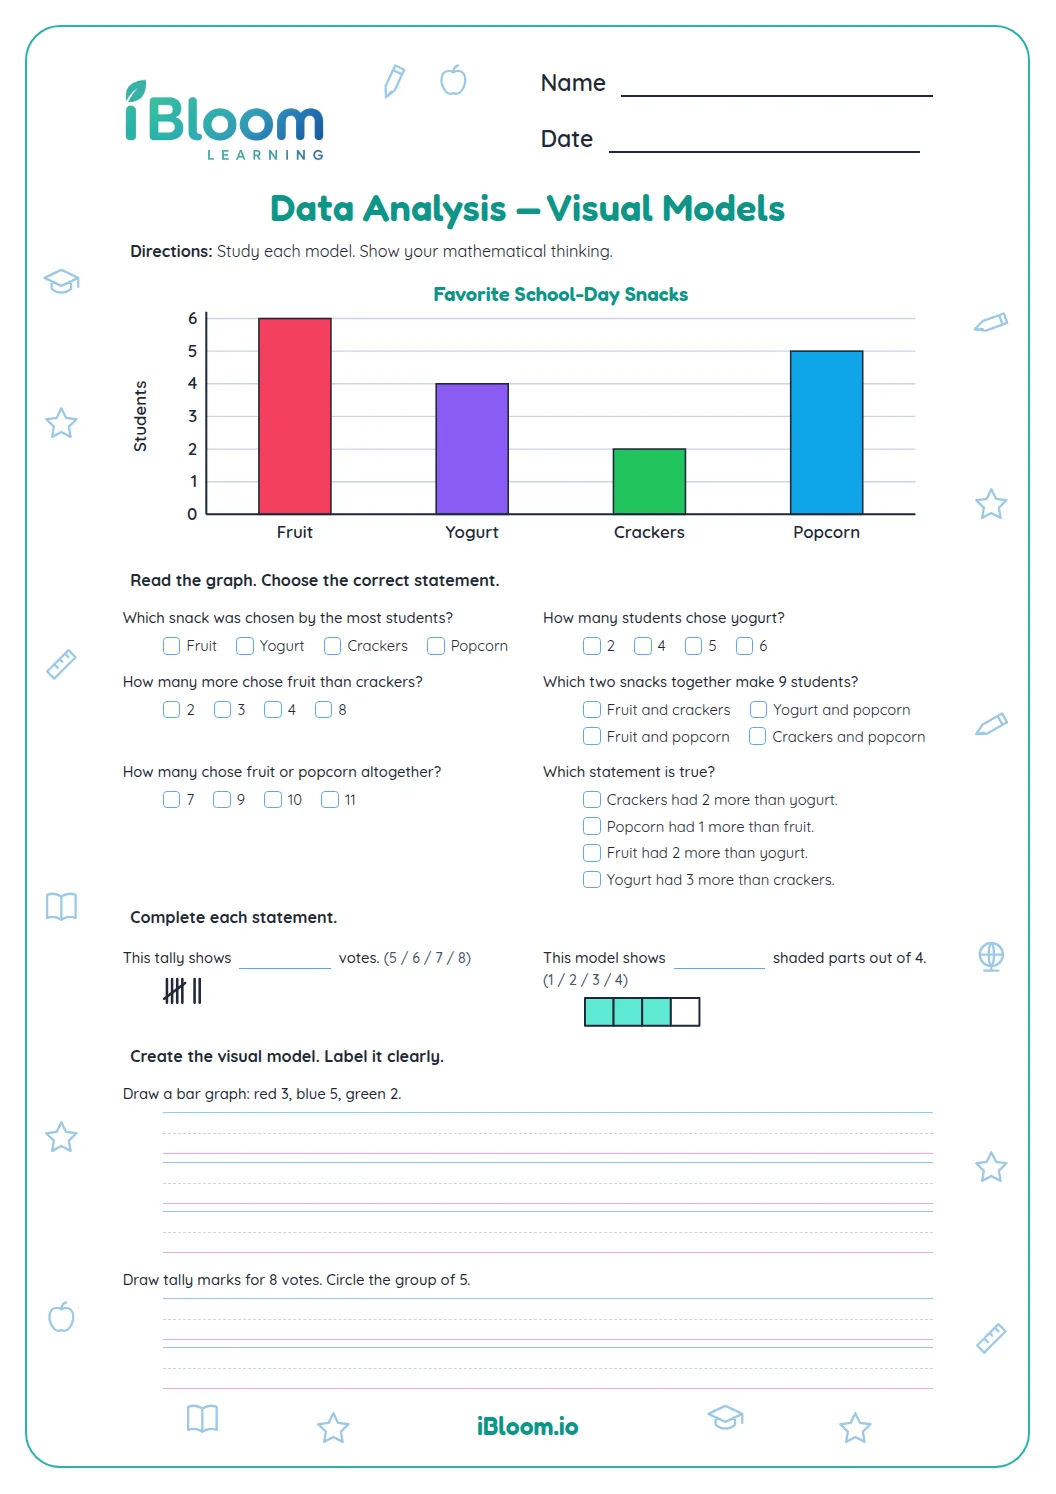
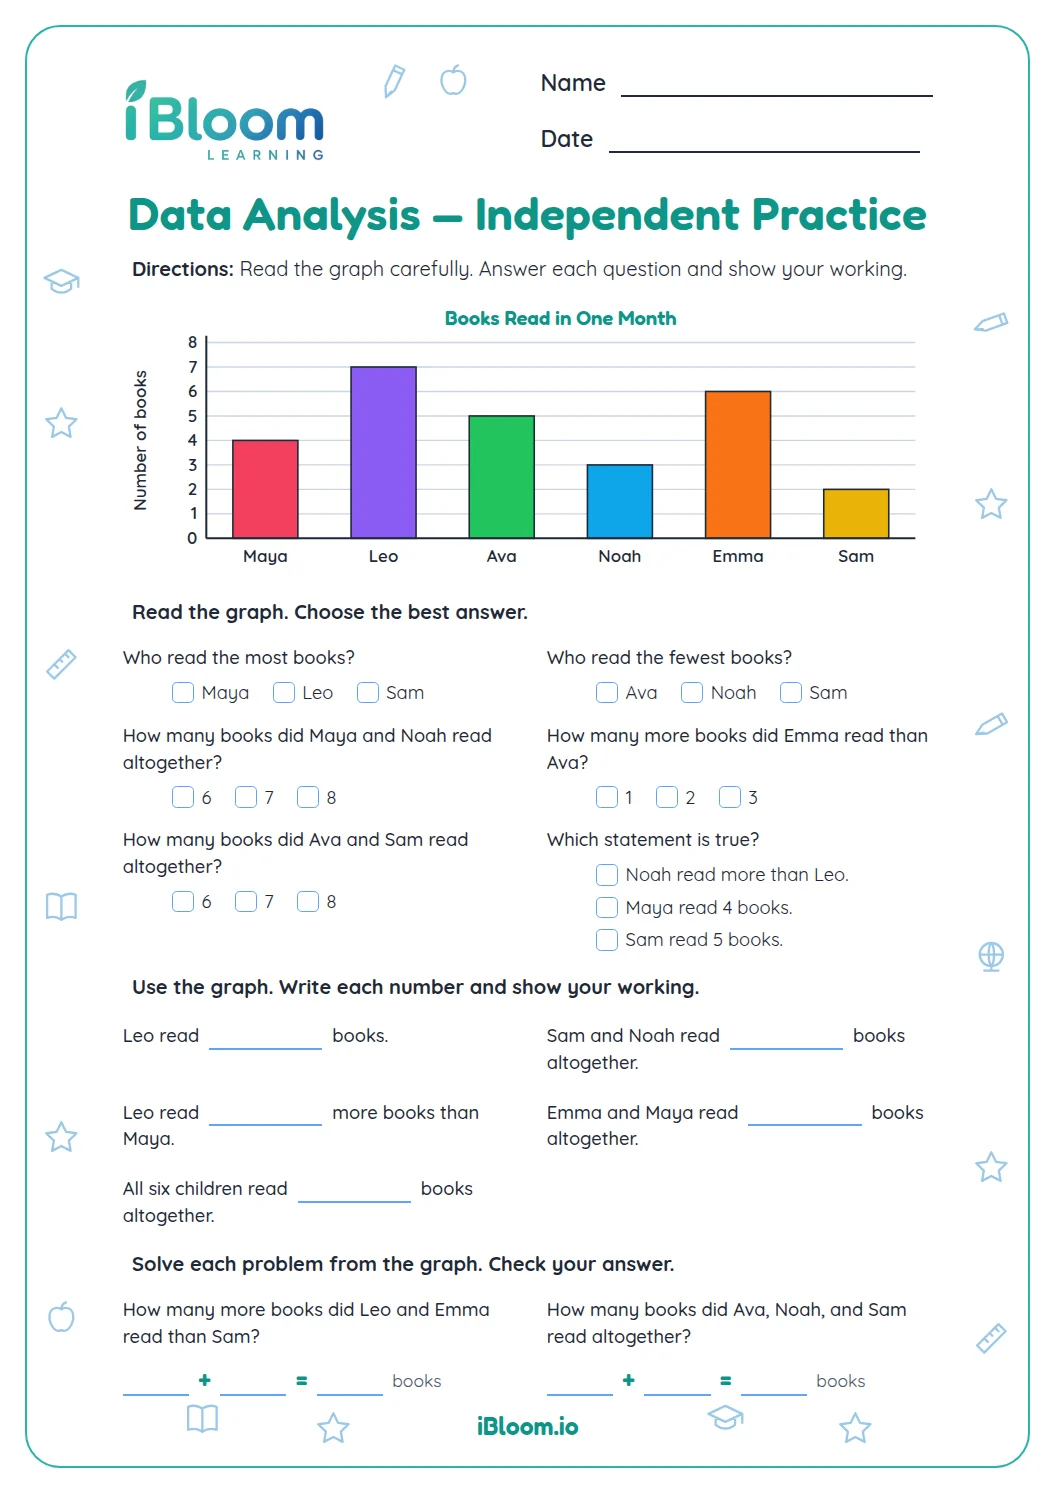
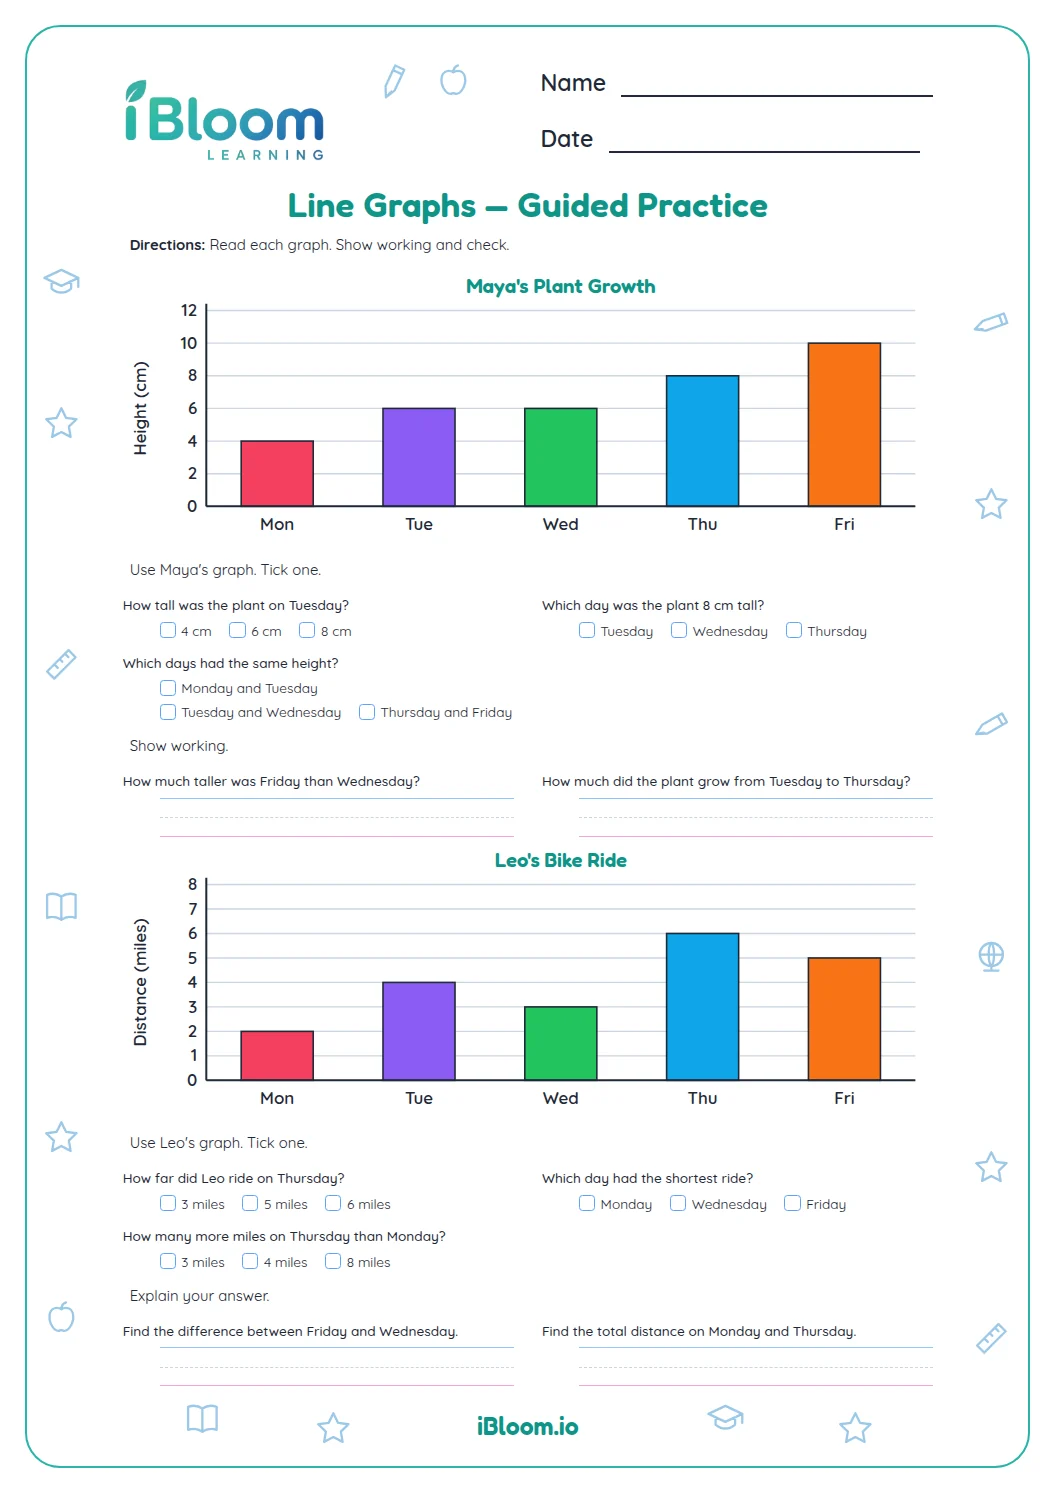
This Grade 3 printable uses one scaled bar graph of books read. Learners read values, compare categories, and find totals in 14 concise questions, then check the separate answer key.
Aligned to 3.MD.B.3
What does this worksheet ask students to do?
Read the four bars on a scale of five books, then compare categories and find totals. The 14 short questions refer to the graph on the sheet.
How can a student read one bar?
Find Ava on the horizontal axis and follow the bar to 25. The scale increases by five books at each grid step.
- 1How many books did Ava read? Answer: 25 books
How can families use the answer key?
Check each answer against the bar values. For totals, name each category before adding; for “how many more,” subtract the smaller value from the larger.
How to use this worksheet
- 1Read the part heading and its direction before starting.
- 2Answer each item using the sentence, graph, or passage details.
- 3For written responses, use a complete sentence when asked.
- 4Review the answer key after finishing a part.
Common mistakes and quick fixes
The mistake
Reading each grid step as one book.
The fix
Check the axis labels; each step represents 5 books.
The mistake
Subtracting the smaller value from the larger in the wrong order.
The fix
For “how many more,” subtract the smaller total from the larger.
The mistake
Adding only two categories when asked for all four.
The fix
Name every bar in the prompt and add all four values.
Common Core alignment
These standards describe the writing and reading work practiced on this page.
Solve comparison and total problems from a scaled bar graph.
On this sheet: Questions use the graph to compare categories and solve one- and two-step problems.
Show the official wordingHide the official wording
Draw a scaled picture graph and a scaled bar graph to represent a data set with several categories. Solve one- and two-step “how many more” and “how many less” problems using information presented in scaled bar graphs. For example, draw a bar graph in which each square in the bar graph might represent 5 pets.
What to practice next
Make more practice
Further reading
Questions parents and teachers ask
How do students read a scaled bar graph?
Use the axis scale to read each bar: each grid step represents five books. Then use the values to answer comparison, total and two-step questions. Students can work independently, then use the printed key to compare each response. Invite them to explain the clue or calculation that led to the answer.
What is included in the answer key?
The separate answer key lists the correct responses for the selected items and gives sample wording for questions with more than one acceptable response. Review it after the student completes a section, and use differences in wording as a chance to explain the same idea clearly.
How long should this worksheet take?
Plan for about 20 minutes, with extra time if the student explains written answers aloud. The questions move from direct practice to applying the same skill in a new sentence, comparison or summary. A short pause between parts can make checking easier.
Can a student complete this worksheet independently?
A student who has practiced the skill can try the questions independently. Read the instructions together first, especially the part headings. For a written response, ask the student to point to the evidence or rule used before checking the model in the key.
What should we review after finishing?
Review any answer that differs from the key and ask the student to explain the choice. Return to the relevant sentence, graph value, number or passage detail. Then invite the student to make one new example using the same skill.