
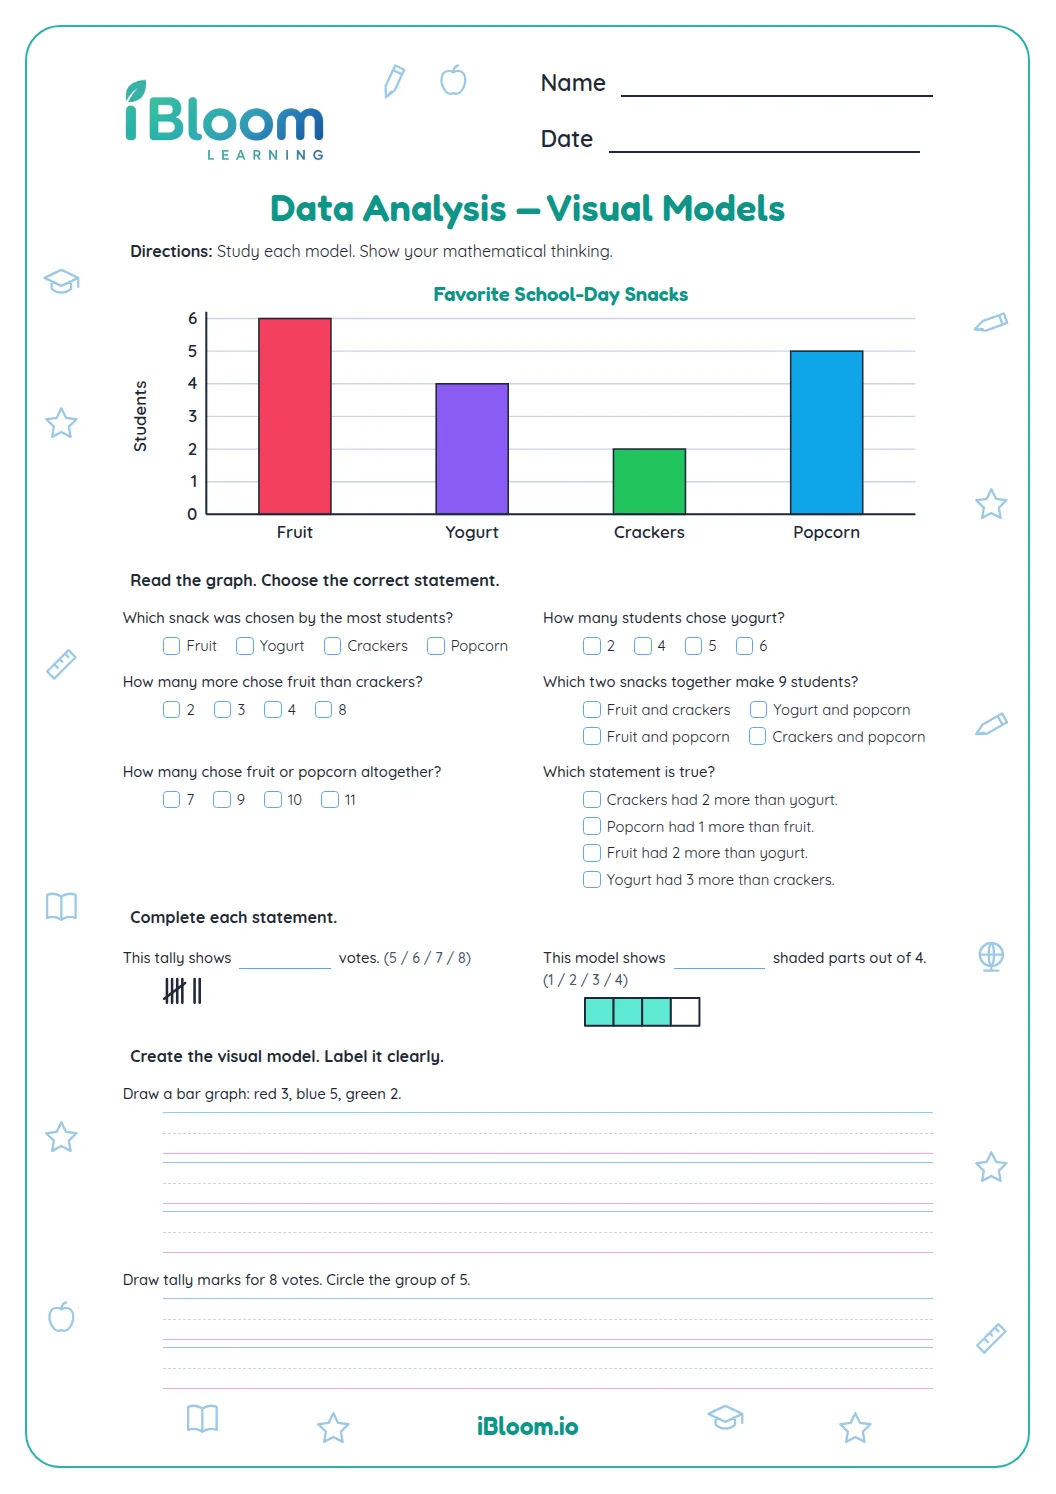
About this worksheet
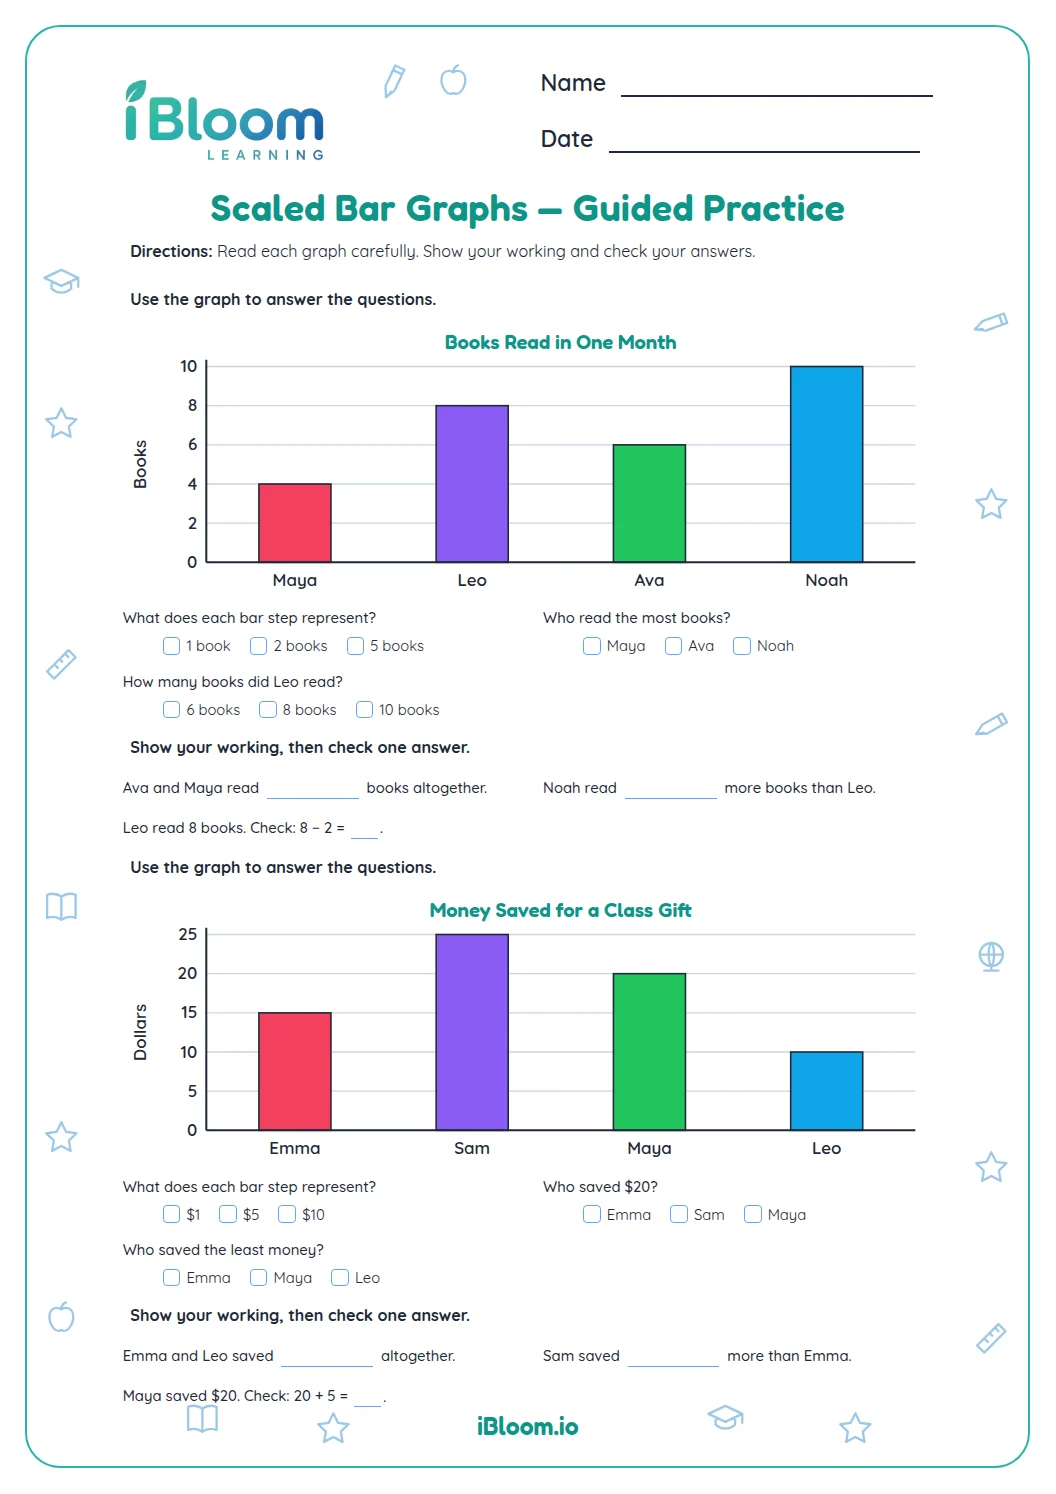
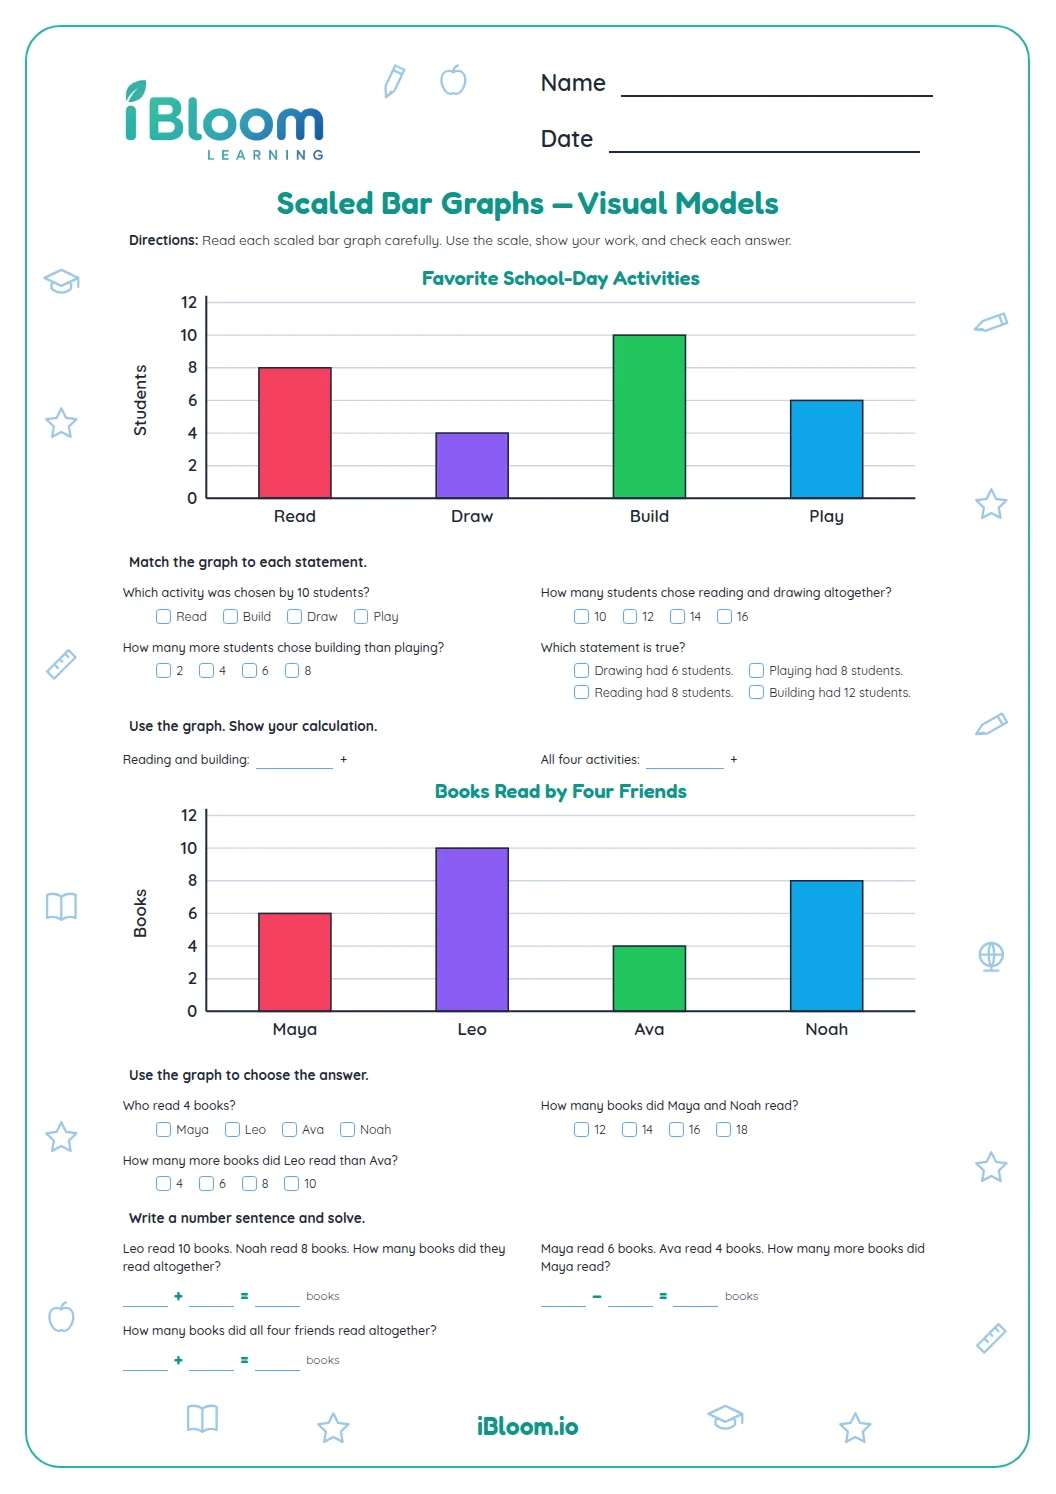
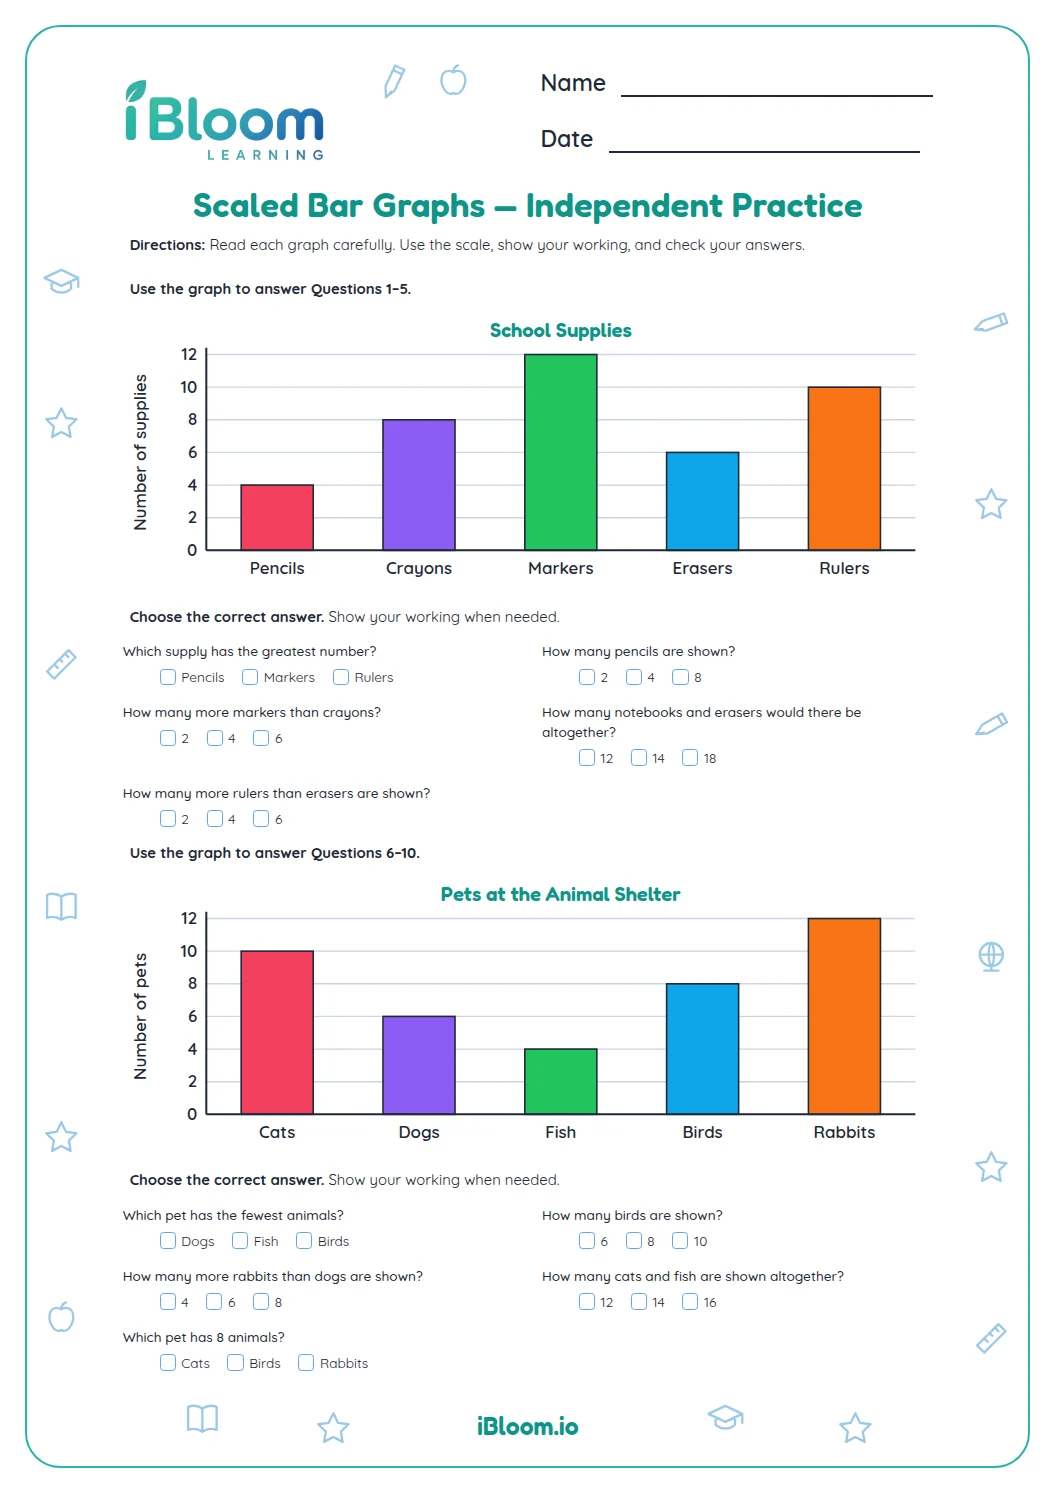
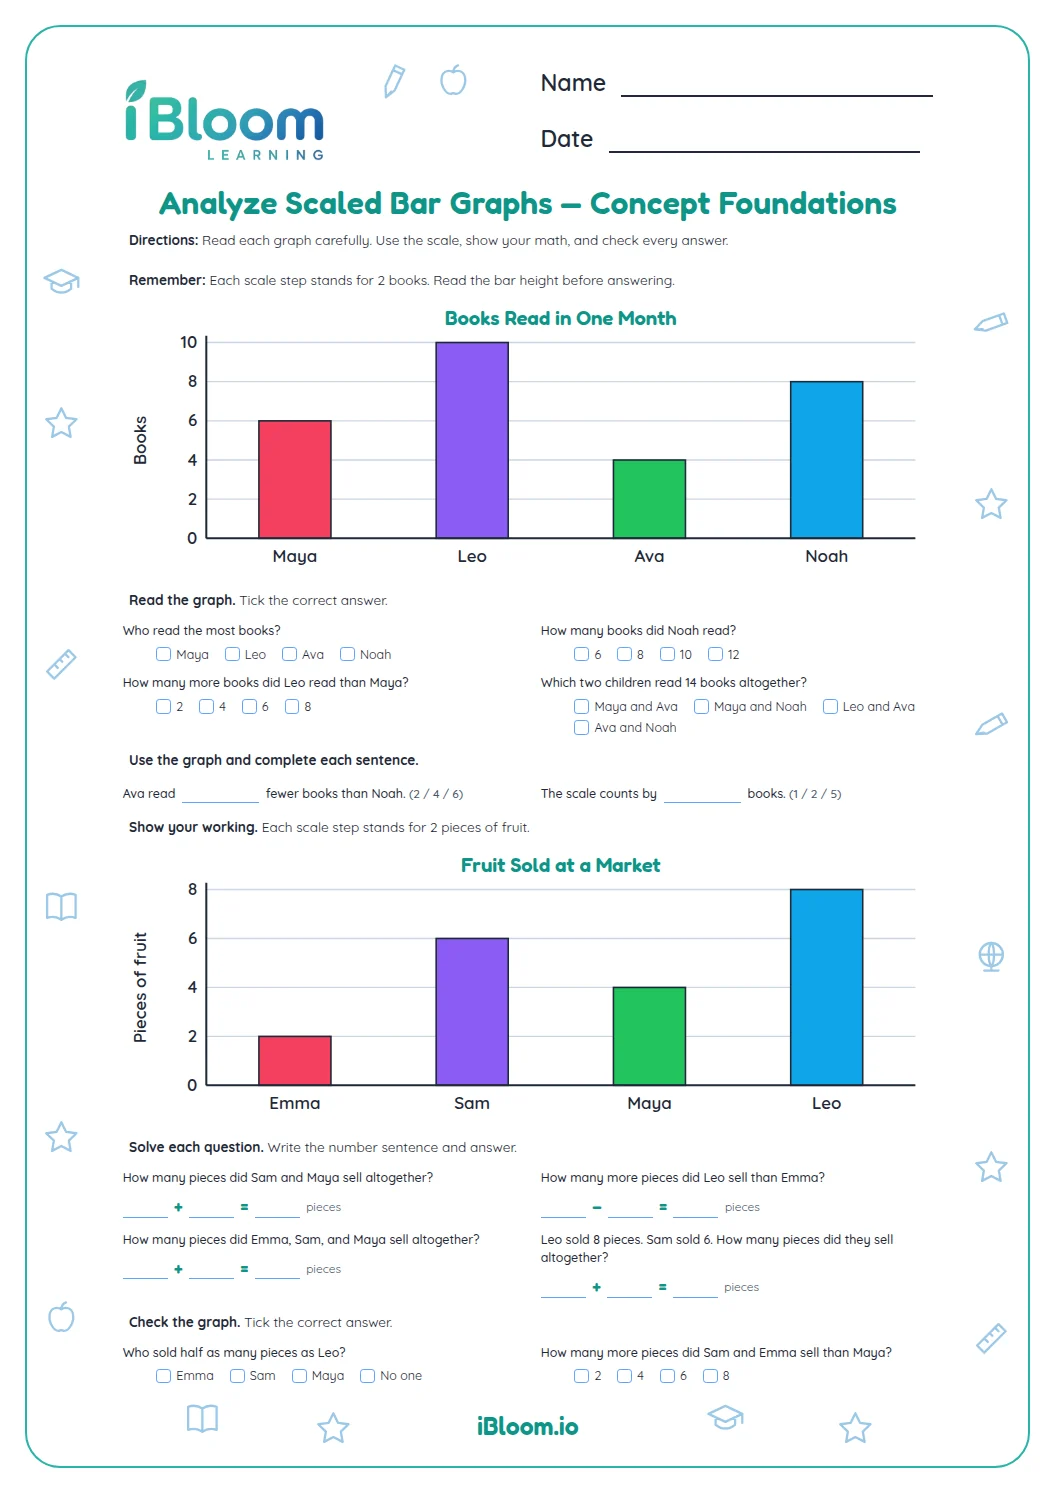
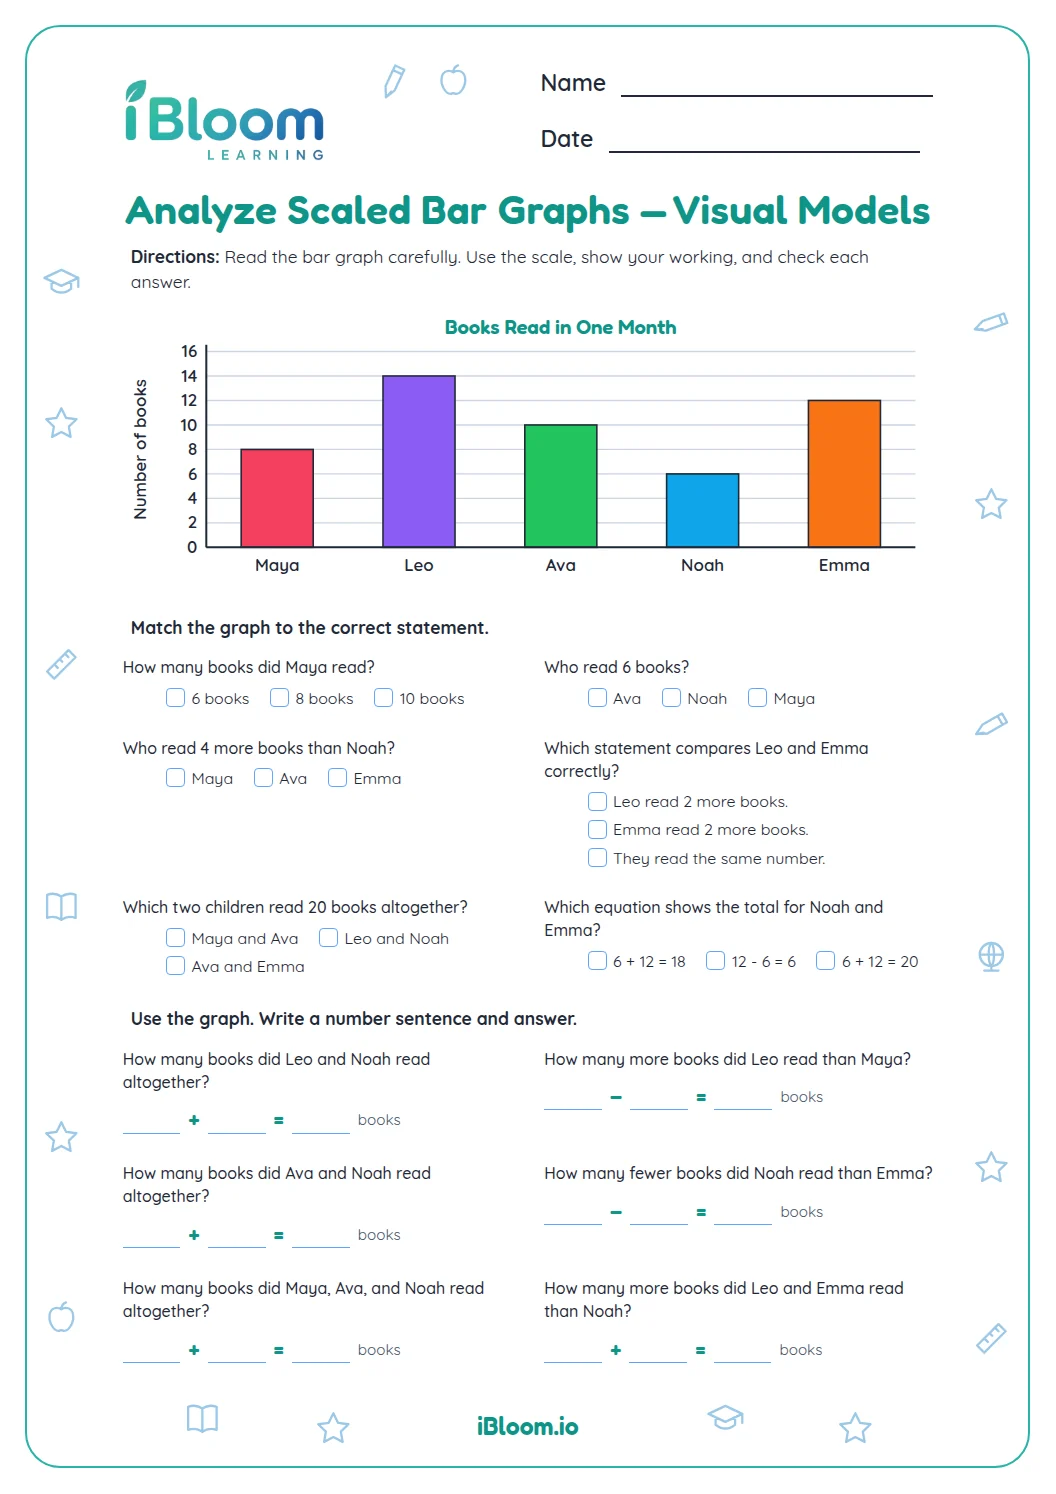
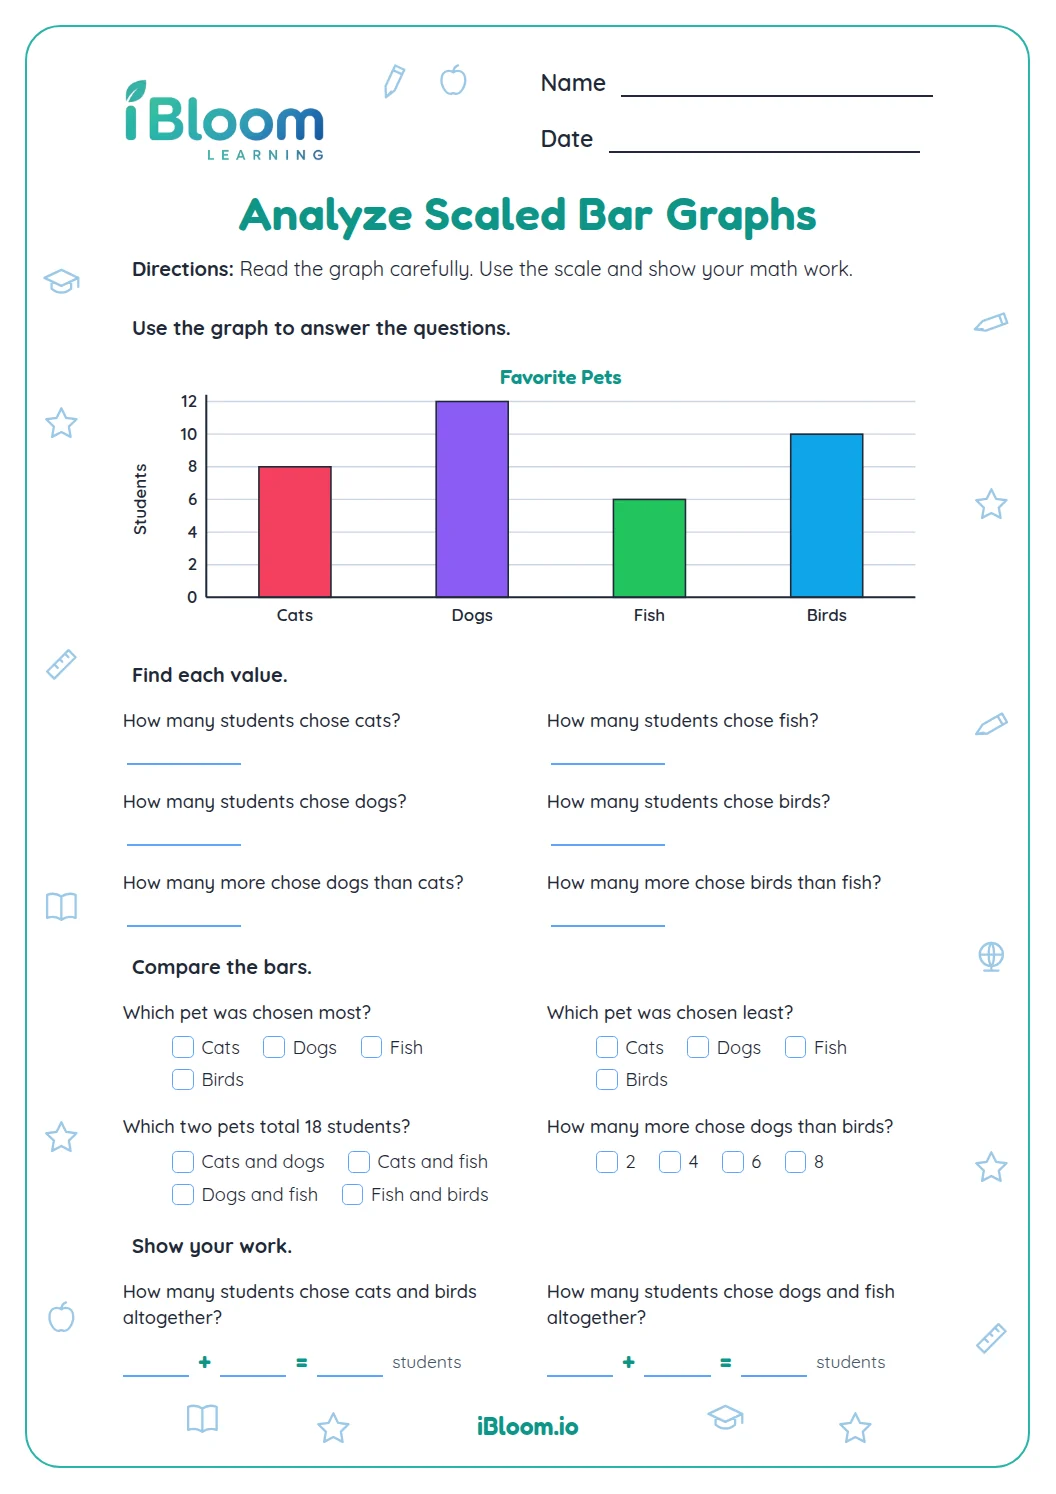
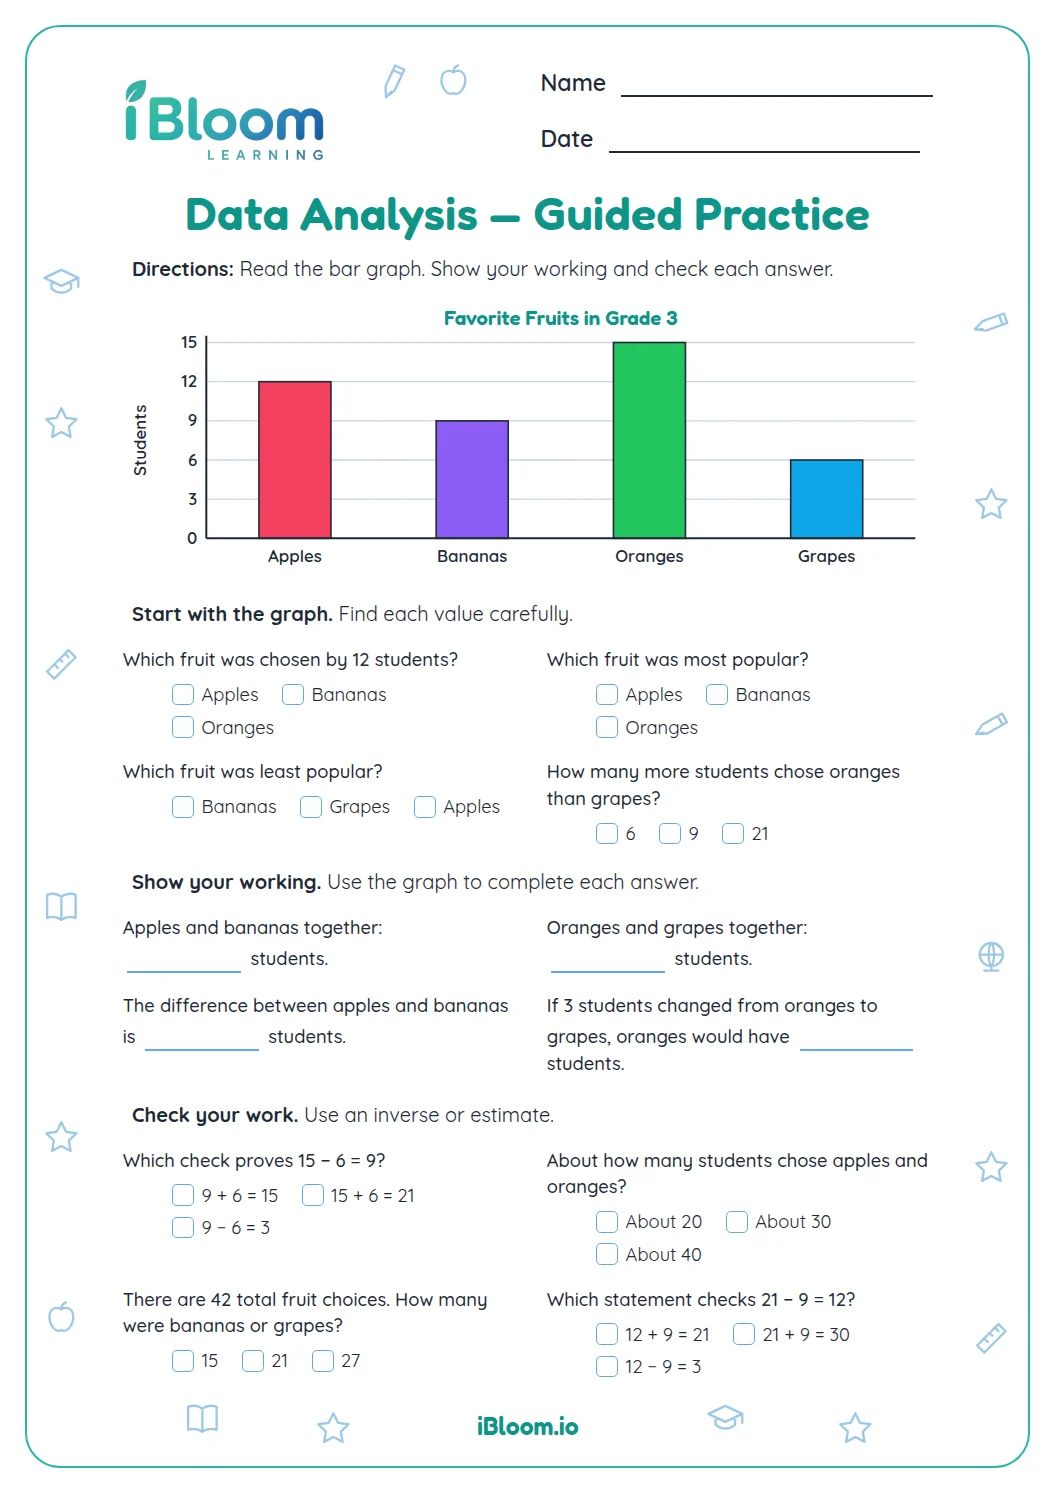
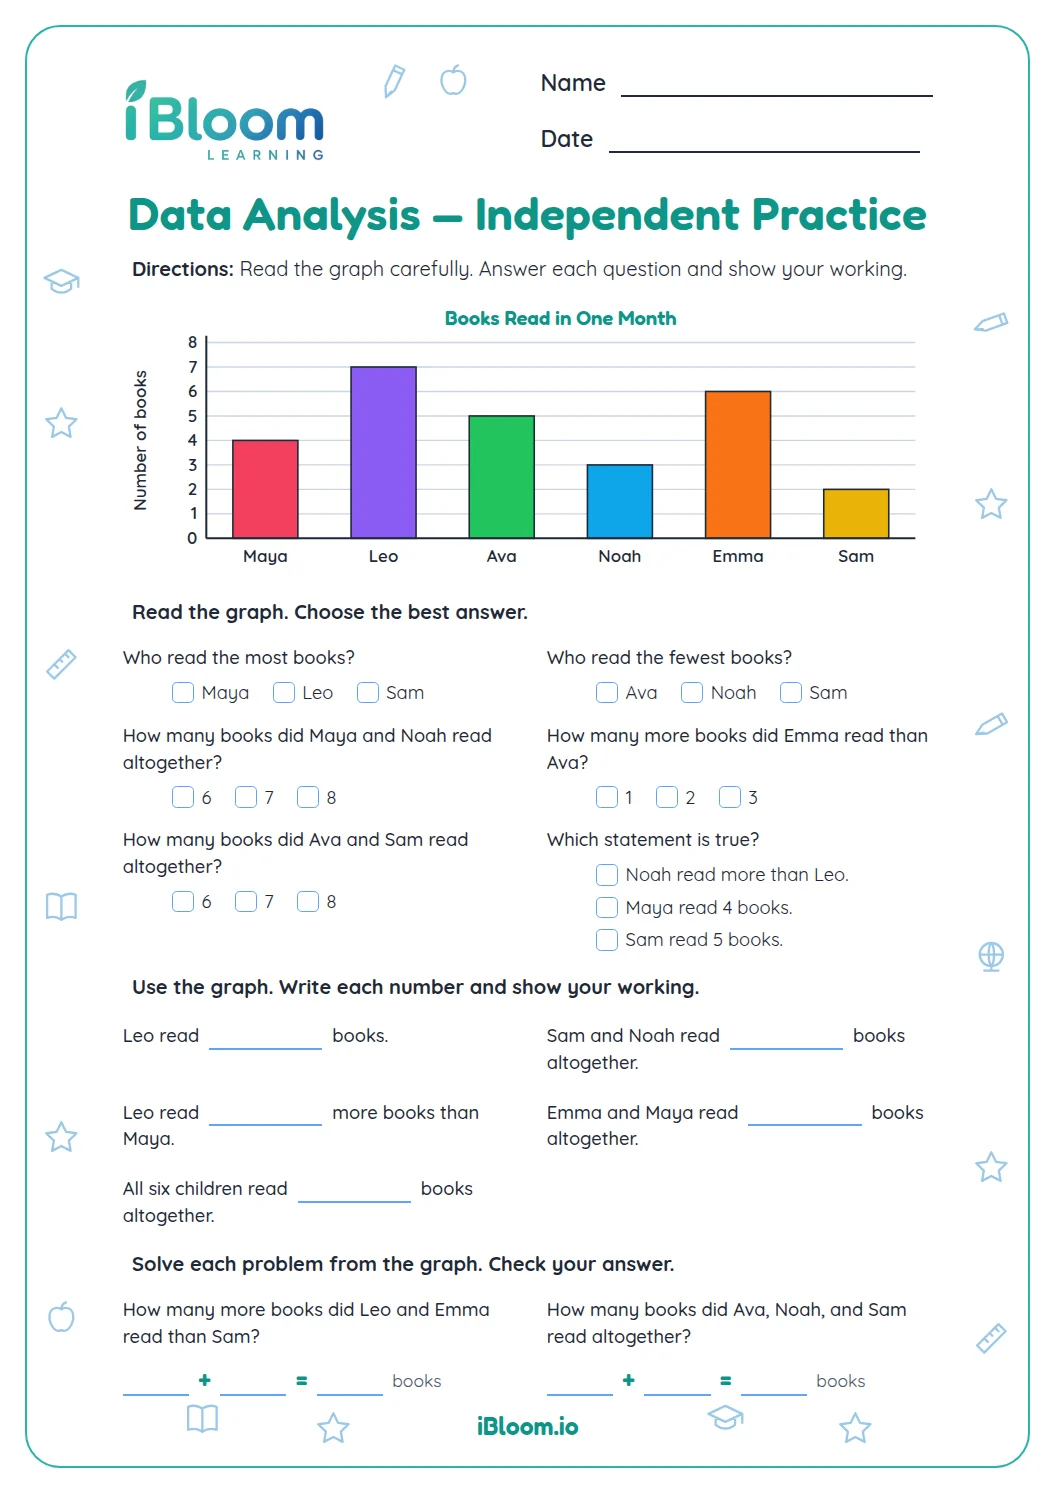
This Grade 3 printable uses a scaled bar graph of books read by four students. Learners read the scale, compare bars, combine values and reason about changes across 14 questions across the worksheet. The separate key shows answers. The work practices CCSS 3.MD.B.3 by solving one- and two-step problems with scaled bar graphs.
Aligned to 3.MD.B.3
How do you read a scaled bar graph?
Read the scale labels first. The bars rise in equal intervals, and each interval represents 2 books. Count the intervals to find each student’s total.
- 1Maya’s bar reaches 8 books.
- 2Ava’s reaches 10, so the difference is 10 − 8 = 2 books.
How do comparisons and totals use the graph?
A “how many more” question asks for a difference. An “altogether” question asks for a sum. Read both bar heights before choosing the operation.
How can learners check a graph answer?
Point to each bar and name its value from the scale. For a total, add the values; for a difference, subtract the smaller value from the larger one.
How to use this worksheet
- 1Read the graph title and scale.
- 2Count the intervals on the named bar.
- 3Write each value before comparing or combining.
- 4Use subtraction for “how many more” and addition for totals.
- 5Check each response against the answer key.
Common mistakes and quick fixes
The mistake
Reading each grid interval as 1 book.
The fix
Check the numbered scale; here the labels increase by 2.
The mistake
Adding when asked “how many more.”
The fix
Subtract the smaller bar value from the larger one.
The mistake
Using only one value in an altogether question.
The fix
Read both bars and add their values.
Curriculum alignment
Solve one- and two-step problems using scaled bar graphs.
On this sheet: Solve one- and two-step problems using scaled bar graphs.
Show the official wordingHide the official wording
Draw a scaled picture graph and a scaled bar graph to represent a data set with several categories. Solve one- and two-step “how many more” and “how many less” problems using information presented in scaled bar graphs.
What to practice next
Make more practice
Further reading
Questions parents and teachers ask
How many questions are included?
There are 14 questions across three worksheet pages, followed by a separate answer key. Learners read values from the books-read graph, compare students’ totals, combine values and reason about small changes using the scale. The graph uses a two-book interval throughout.
What does each grid interval mean?
Each grid interval represents 2 books. For example, Maya’s bar reaches four intervals above zero, so it represents 8 books. Read the numbered scale before interpreting a bar to avoid treating each interval as one book. The scale is labeled in twos from zero to ten.
How do you answer “how many more” questions?
Read both bar values, then subtract the smaller from the larger. For Ava and Leo, 10 − 6 = 4, so Ava read 4 more books. The key provides checked answers for all the graph questions. Use the graph’s labels to check the subtraction.
How do you find a total from two bars?
Read each bar’s value and add them. Maya and Noah read 8 and 4 books, so together they read 12 books. Writing the values before adding helps avoid mixing up the scale or leaving one student out. Add the two values after reading each bar.
Is the answer key included?
Yes. A separate key gives the correct graph readings and answers. Learners can first explain how they read each bar, then use the key to check comparisons and totals. The teacher can also use it to review the scale.