

About this worksheet
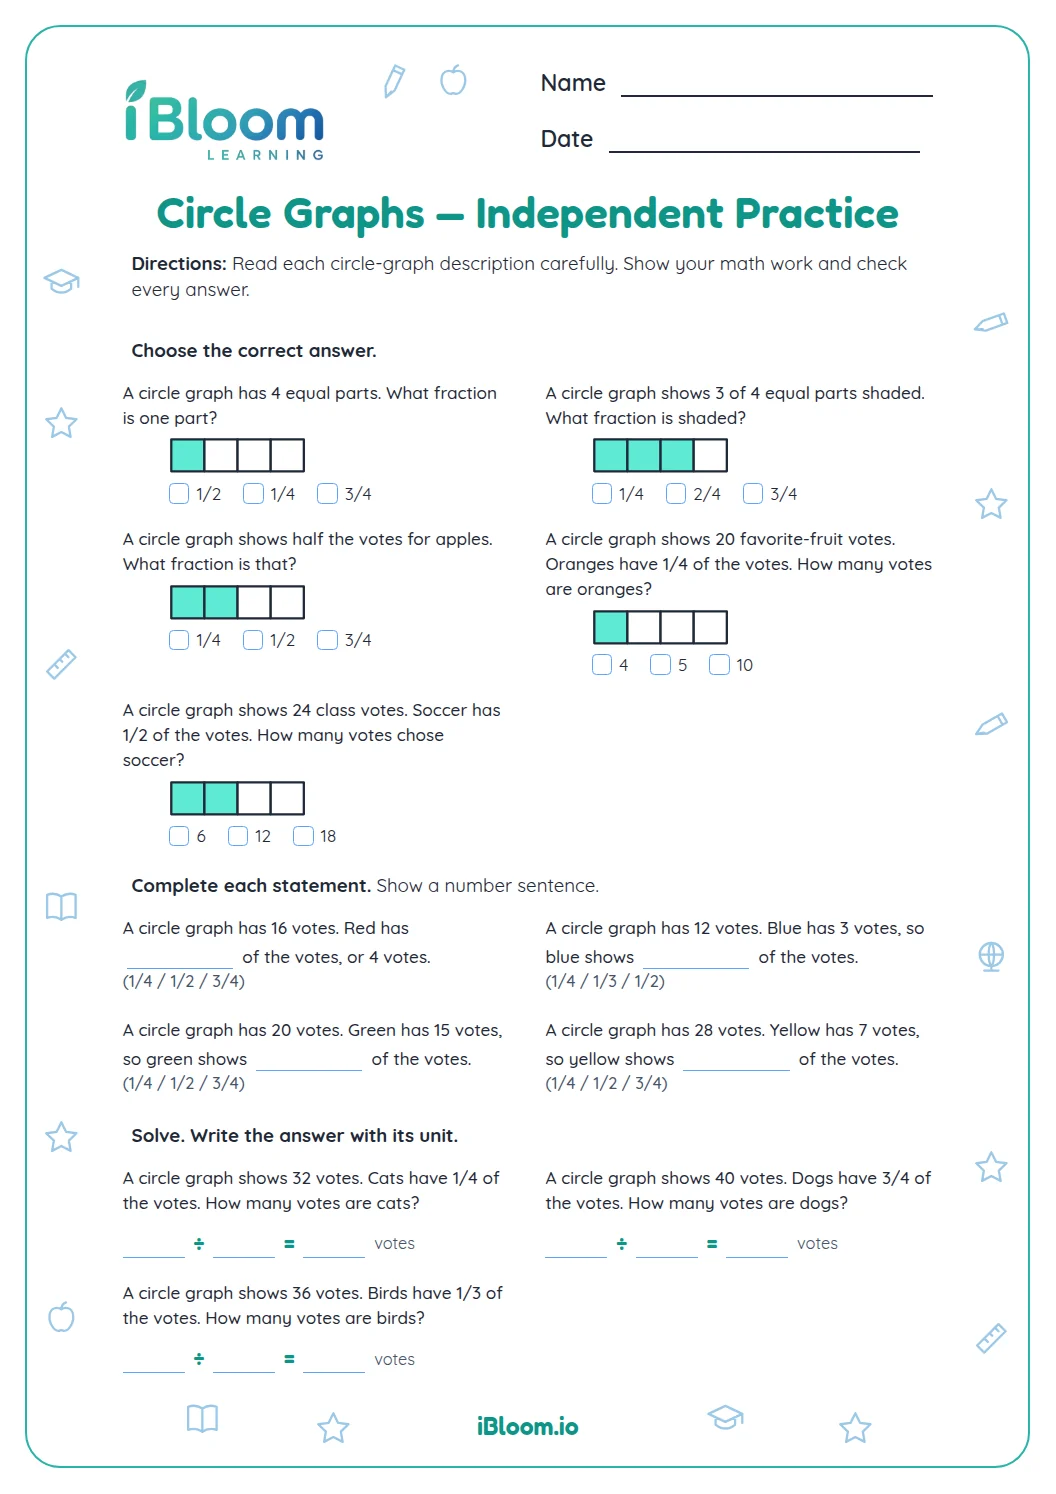
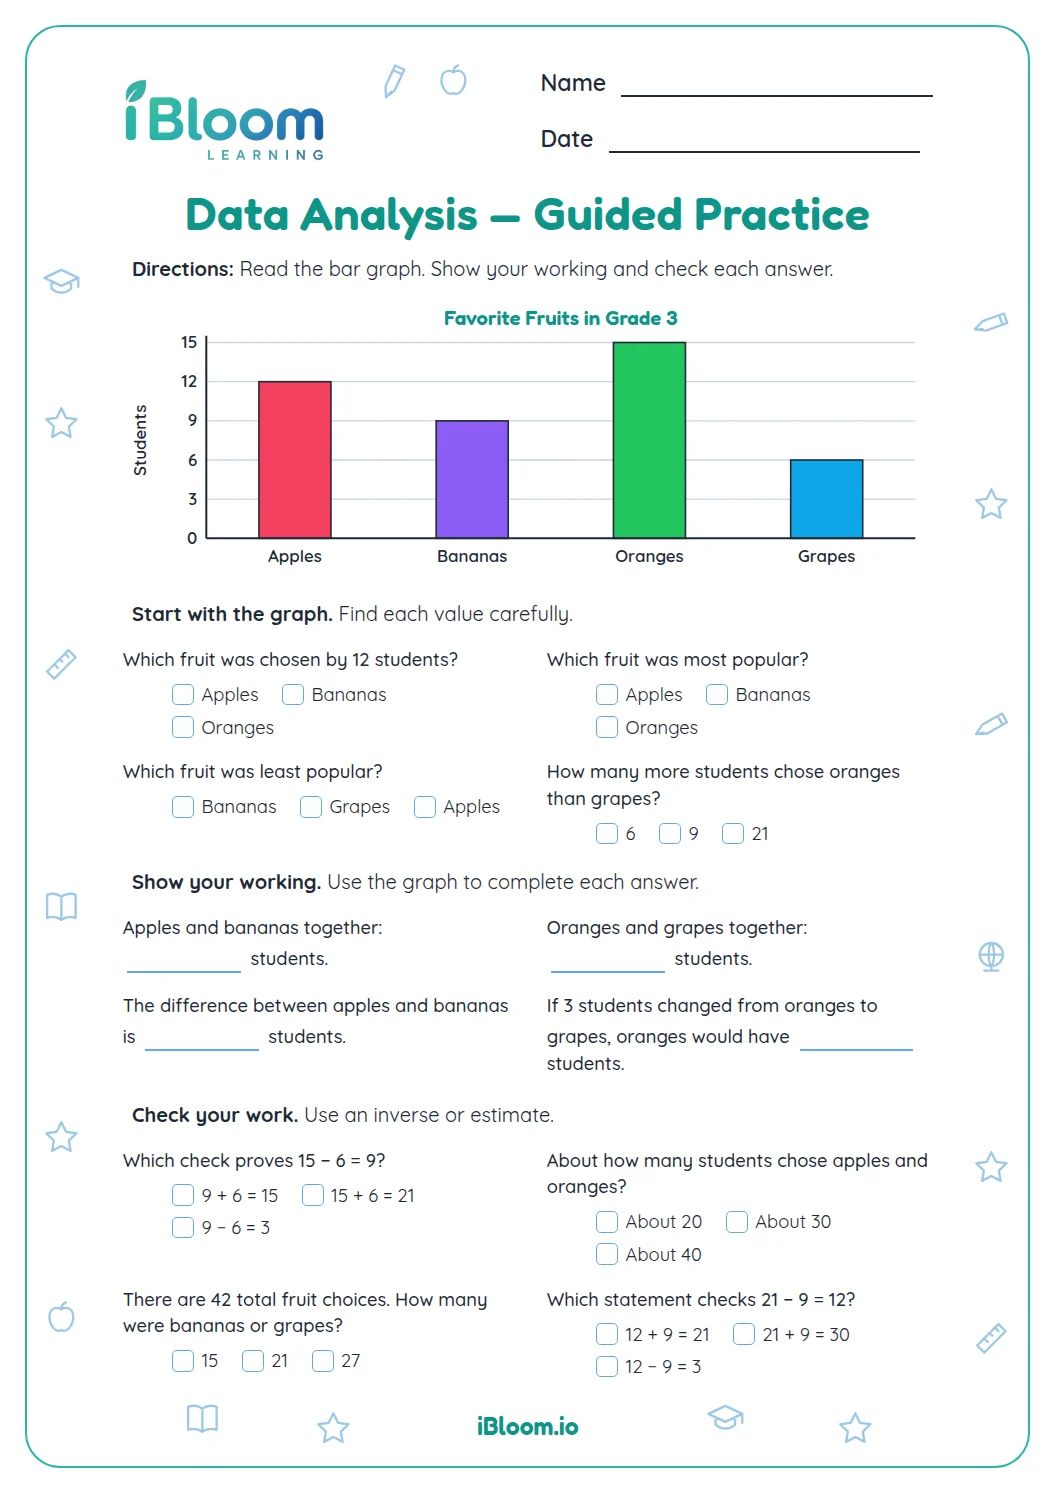
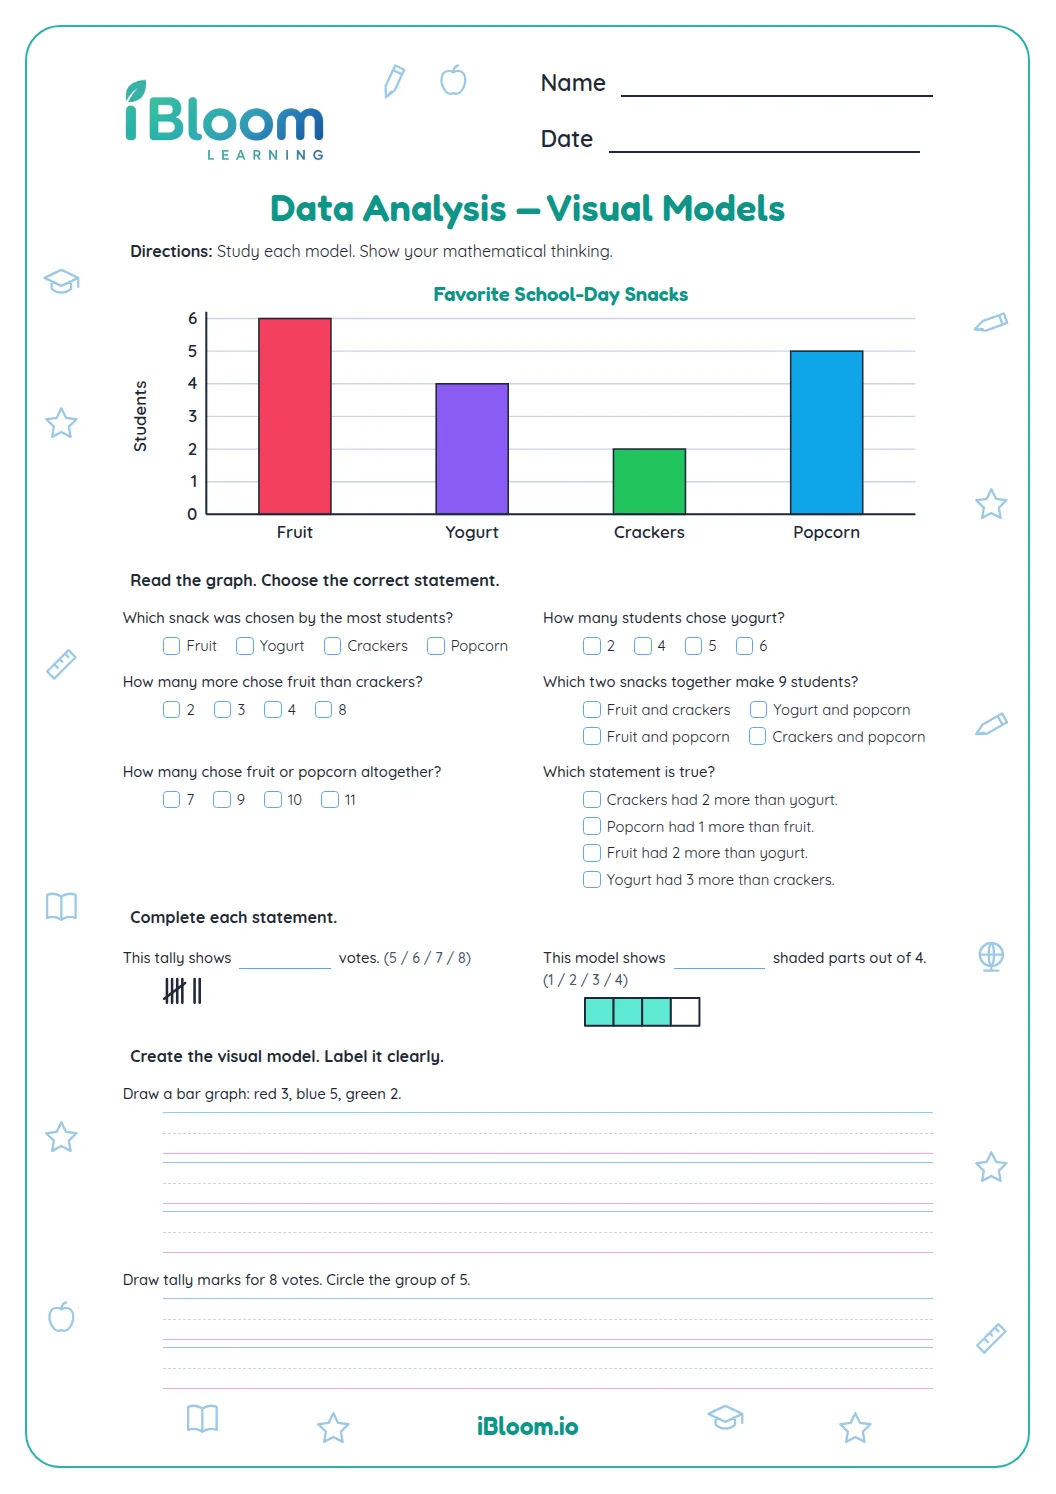
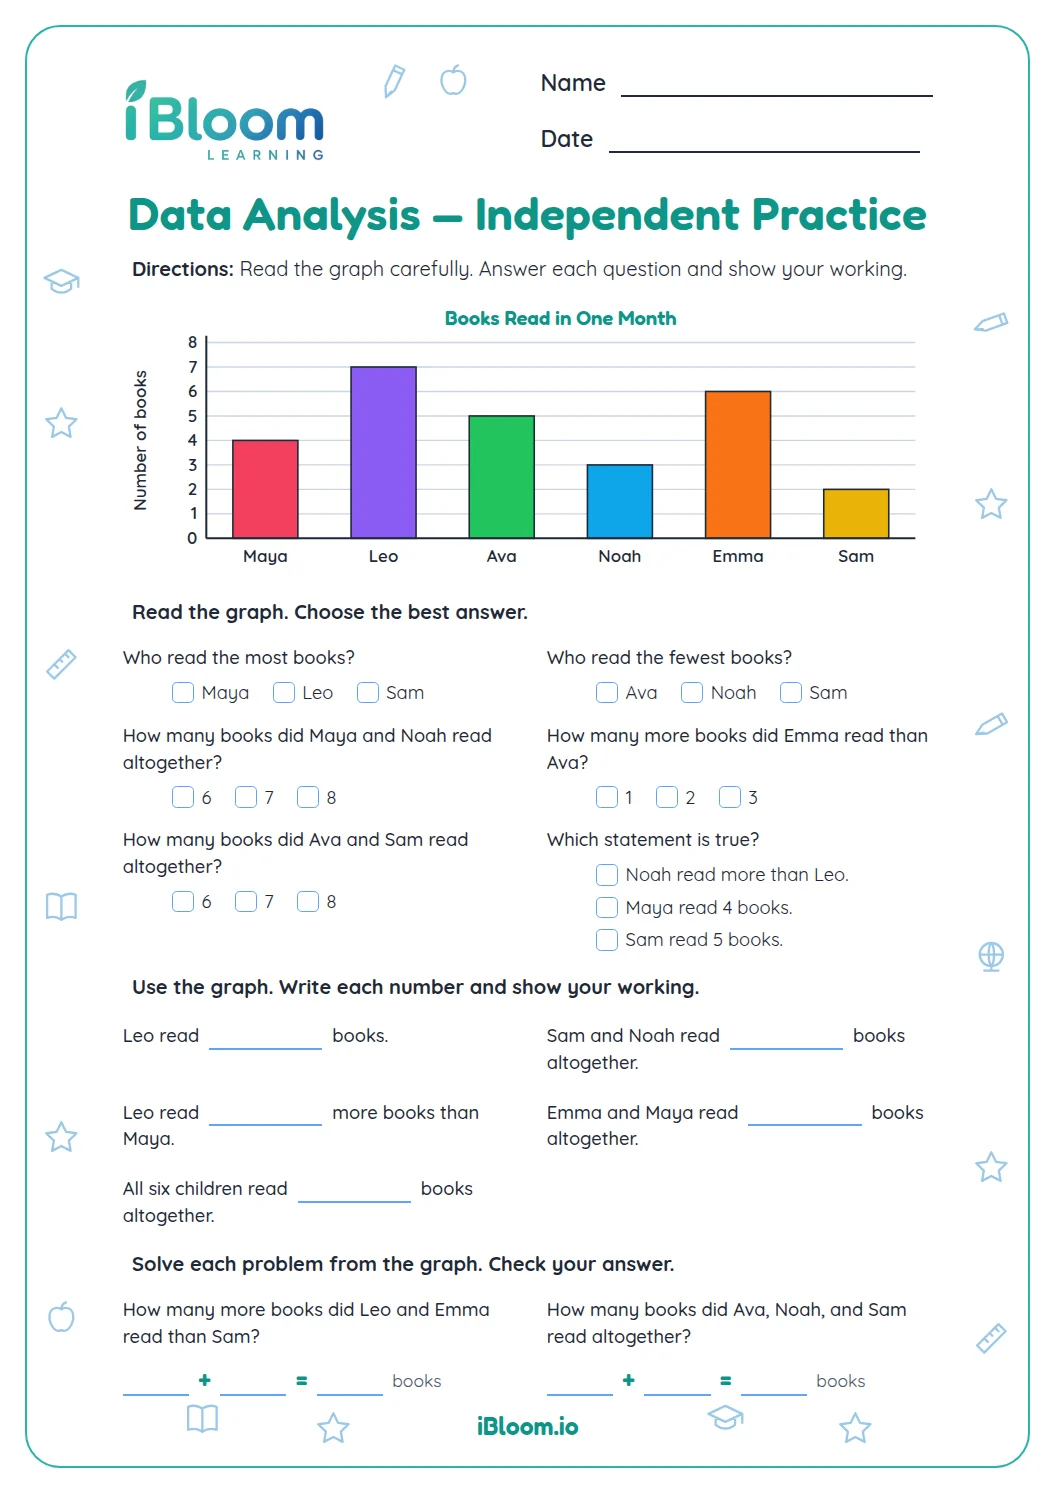
This Grade 3 guided practice page introduces circle graphs through equal-part circle models. Students count category slices, name the fraction of the whole, connect equal slices with vote totals, and compare categories. Ten of the 14 questions show a circle model; the other questions connect equal parts with totals or compare category shares. A separate answer key lists each result. The fraction work practices equal parts of a whole under CCSS 3.NF.A.1.
Aligned to CCSS.Math.Content.3.NF.A.1
How does a circle graph represent a whole?
A circle graph divides one whole group into equal parts. Count all the slices for the denominator and the category slices for the numerator.
Question 3 shows three of four equal slices for soccer. Three slices are each one fourth, so soccer is 3/4 of the votes.
- 1The circle has 4 equal slices.
- 23 slices show soccer.
- 3Each slice is 1/4 of the whole.
- 4Soccer is 3/4 of the votes.
How can parts connect to a vote total?
If a whole group has 8 votes and one fourth of the circle is shaded, divide 8 into 4 equal groups. Each part represents 2 votes. The vote-total questions use this connection to find category counts.
What does this circle-graph practice include?
The 14 questions include ten circle models, two vote-total questions, and two category comparisons. The models show the circle divided into equal slices, with one category shaded.
How to use this worksheet
- 1Count the total equal slices in the circle.
- 2Count the shaded slices for the category.
- 3Write shaded slices over total slices.
- 4For a vote total, divide the total votes evenly among the slices.
- 5Compare categories by comparing their shares of the whole.
Common mistakes and quick fixes
The mistake
Using shaded parts as the denominator.
The fix
Use all equal slices for the denominator and only category slices for the numerator.
The mistake
Assuming one slice is one vote when the total is larger.
The fix
Divide the total votes evenly among the slices before counting a category.
The mistake
Comparing fractions with different total parts by looking only at numerators.
The fix
Compare the category shares as portions of their own whole, using the model.
Common Core alignment
This worksheet practices the standard below by naming and comparing equal parts of a whole.
Name a unit fraction and count equal parts of a whole.
On this sheet: Circle fraction models show equal parts as categories of a whole, then ask readers to name or compare those parts.
Show the official wordingHide the official wording
Understand a fraction 1/b as the quantity formed by 1 part when a whole is partitioned into b equal parts; understand a fraction a/b as the quantity formed by a parts of size 1/b.
What to practice next
Make more practice
Further reading
Questions parents and teachers ask
What does a circle graph show?
A circle graph divides one whole group into slices for its categories. This sheet uses shaded equal-part circles to show a category share. Children count all slices for the whole and the marked slices for the category, then name the fraction.
How do you read a category fraction?
Count the shaded slices for the numerator and all equal slices for the denominator. In question 3, three of four slices are shaded, so the soccer share is 3/4. The circle shows the category as part of the complete group.
How many questions are included?
There are 14 questions: ten with circle models, two about votes represented by each equal slice, and two comparisons between categories. The separate key lists the answer to each item. Four printable practice pages and four key pages are included.
How can a circle slice represent more than one vote?
Divide the total votes evenly among the equal slices. For example, if 16 votes are split into 8 equal parts, each part represents 2 votes. Count the marked slices to find the number of votes in that category.
What does the answer key show?
The separate answer key gives the category fraction, vote total, or comparison for every question. For model questions, check that the numerator matches the shaded slices and the denominator matches all slices. It shows each correct multiple-choice response.