
About this worksheet
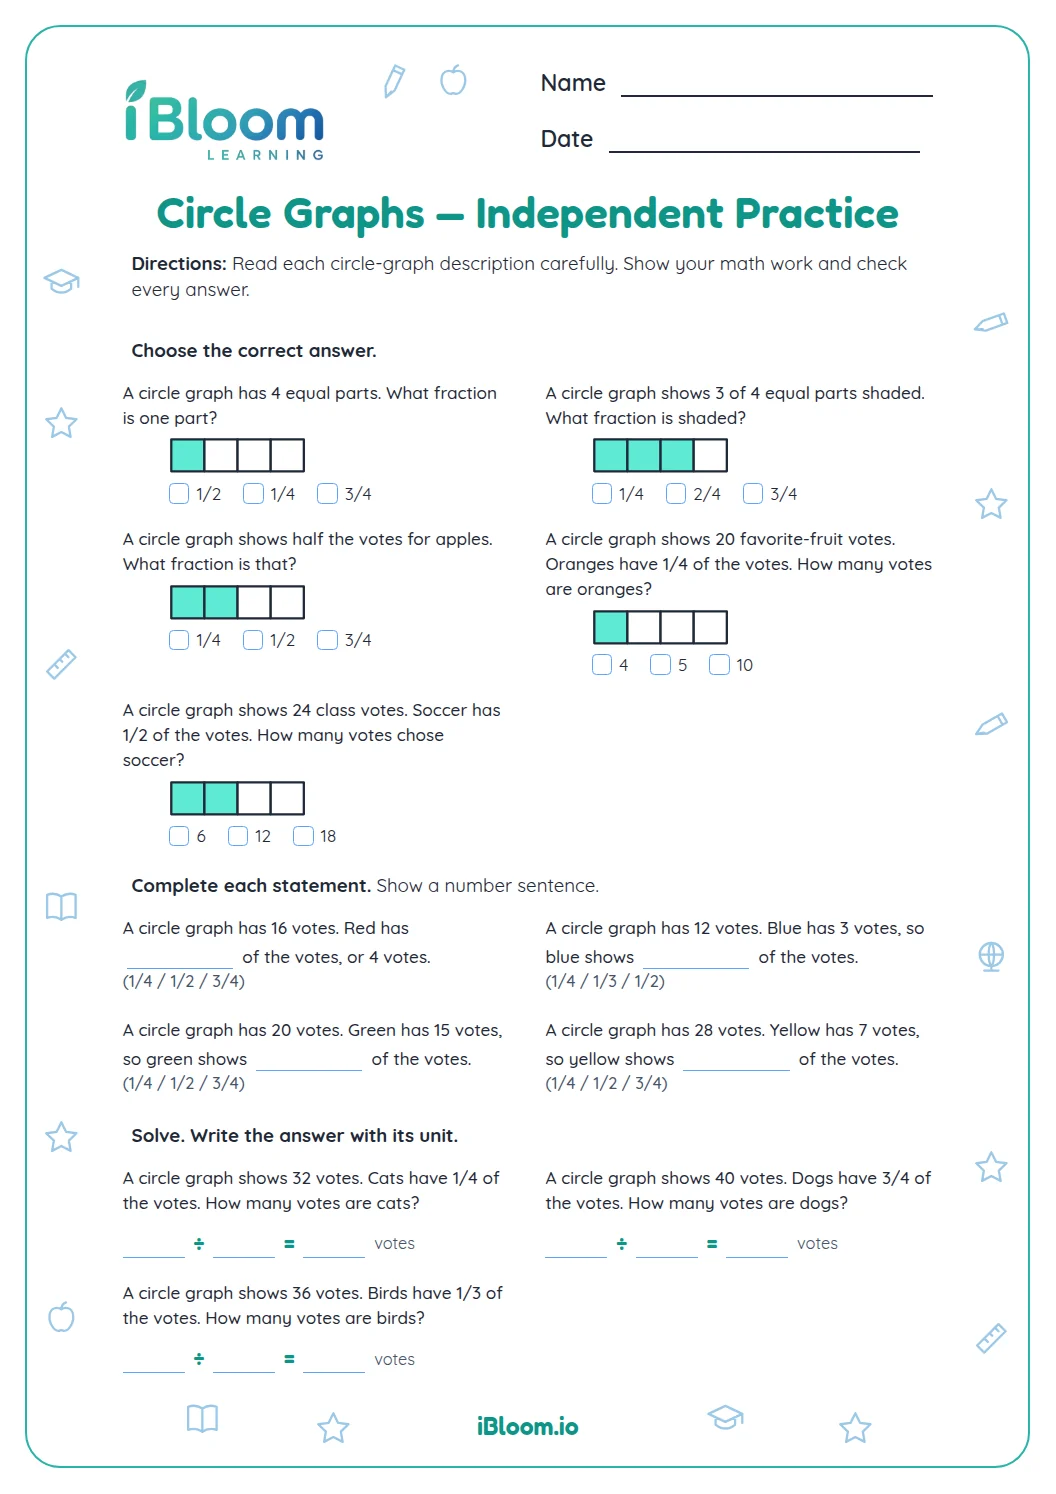
A circle graph shows each category as a share of the total. This sheet starts with counts in a table, then uses equal circle parts and simple fractions to interpret category shares.
Start with category counts
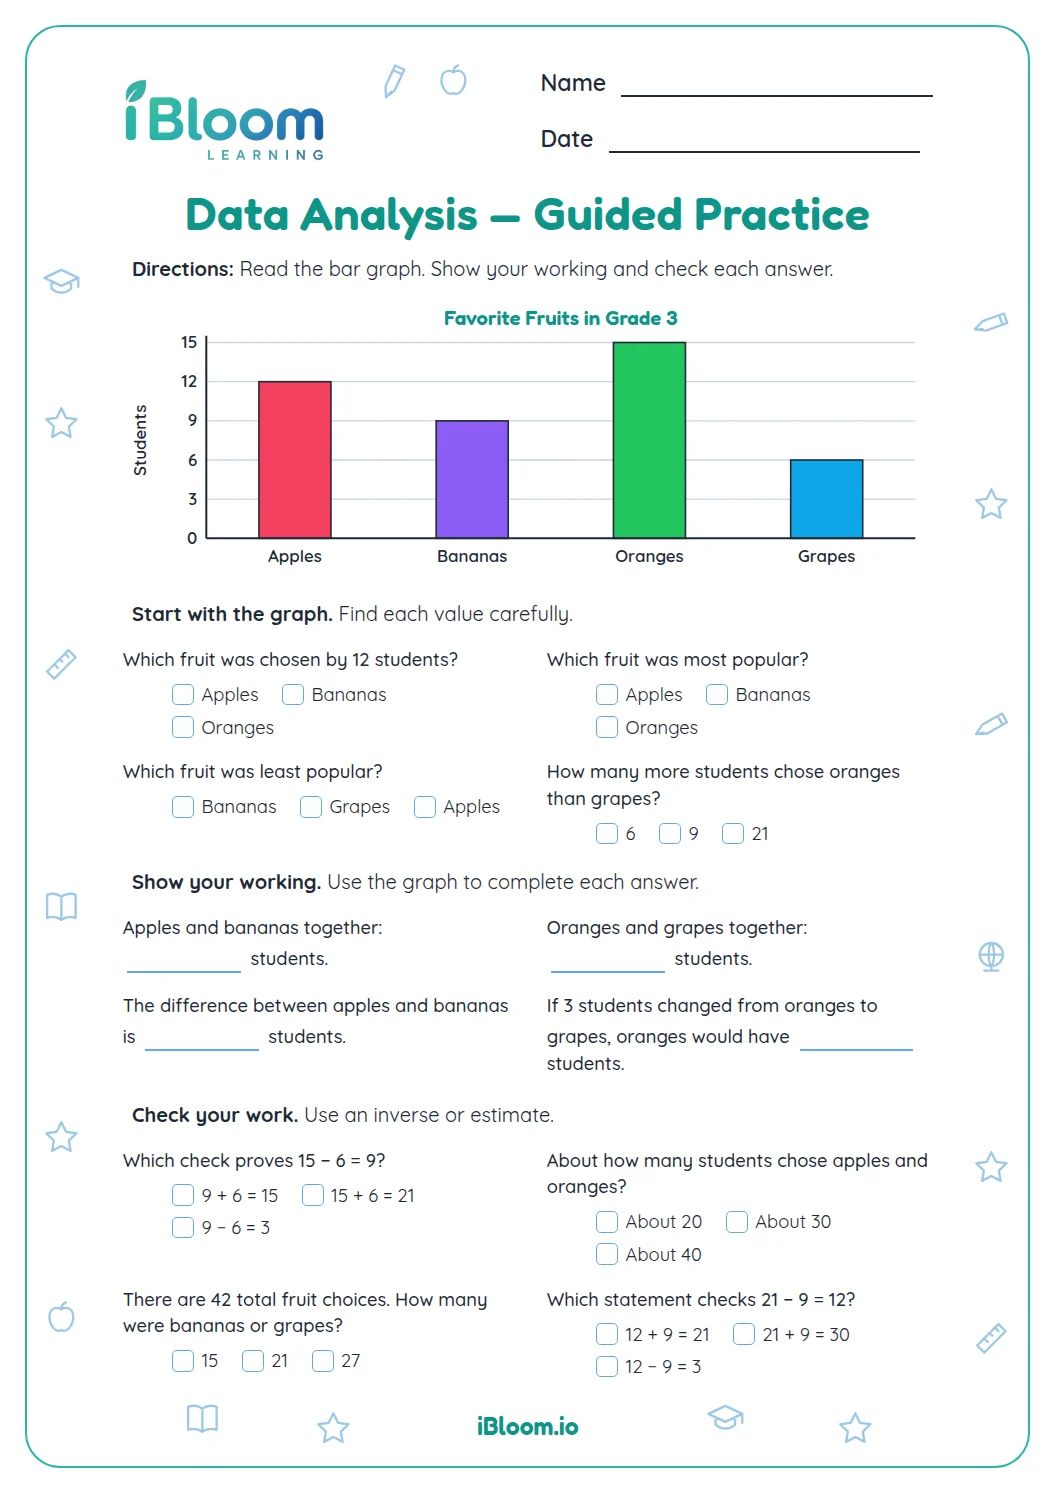
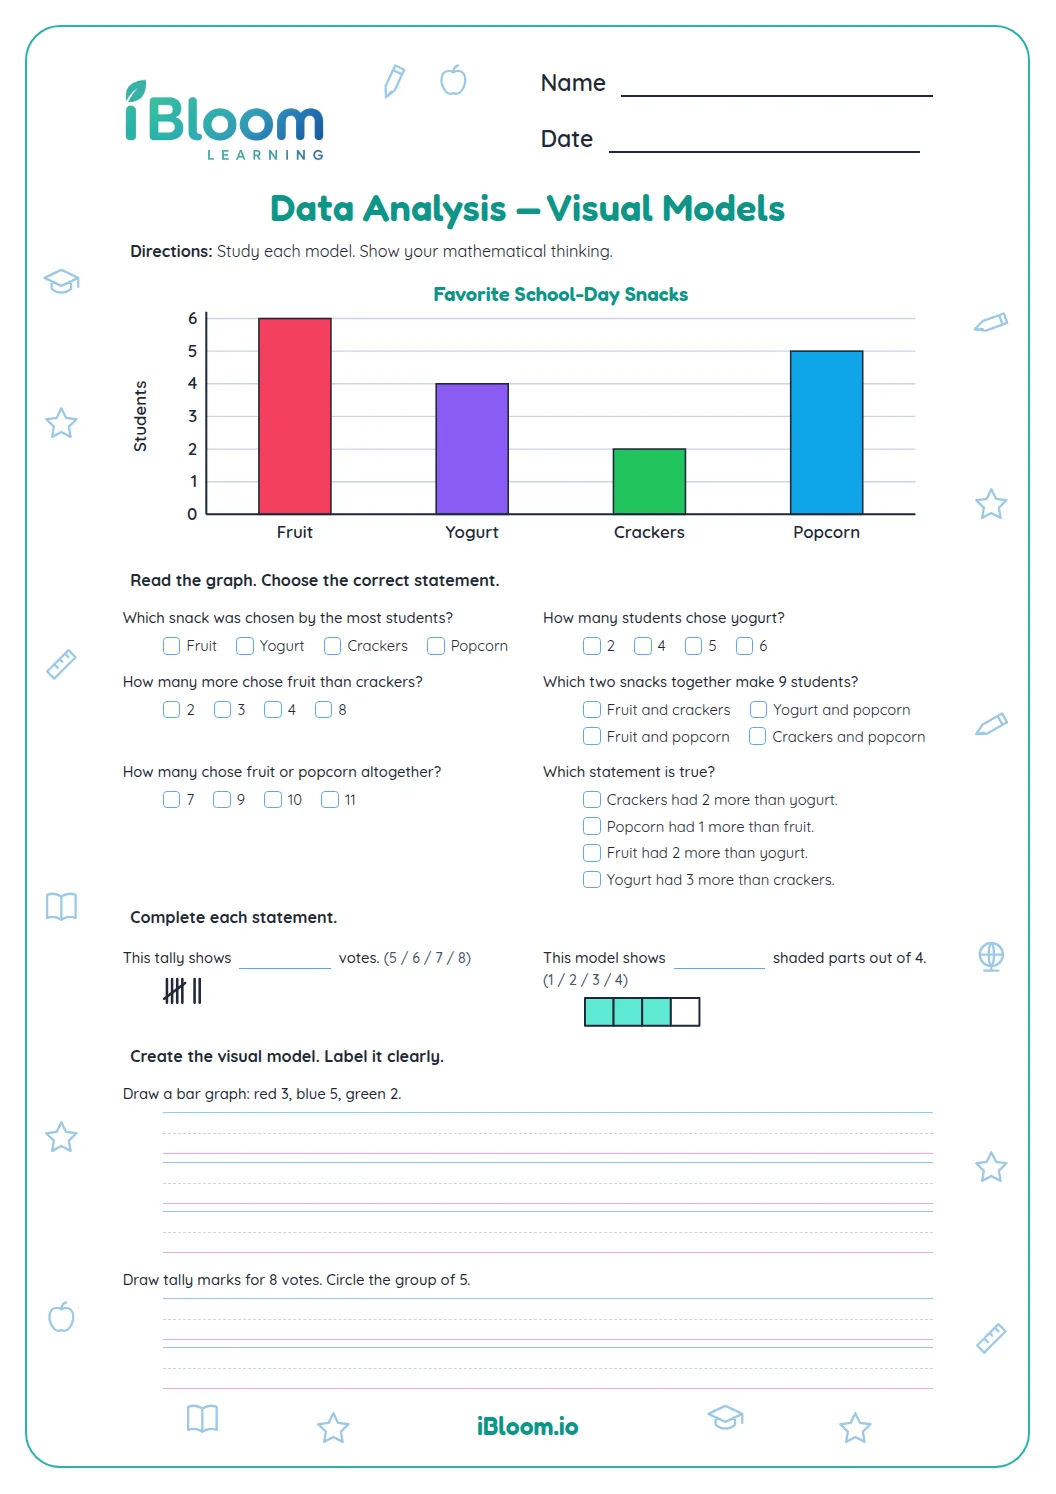
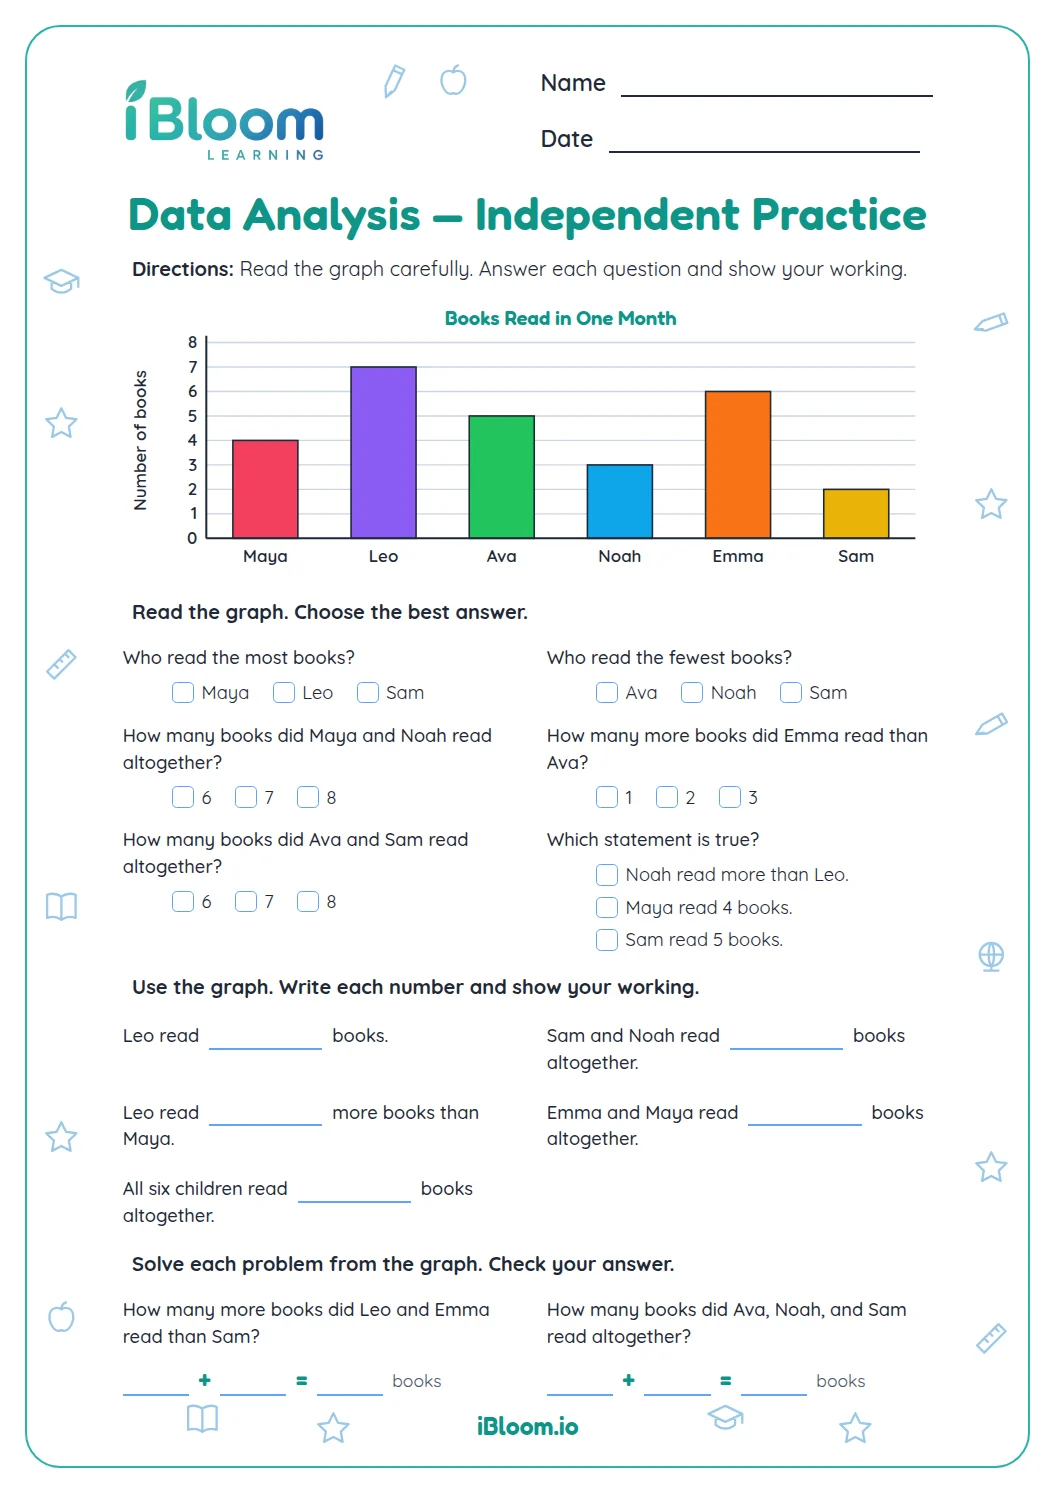
Part A uses small survey tables. Find the total responses, compare categories, and connect each category count to a share of the full group. Question 3 uses the fruit counts: two of eight votes are bananas, or 1/4.
Use a fraction to find a count
Part B connects a fraction of the whole group to a count. For example, one third of 12 students is 4 students.
Explain the whole data set
Part C asks why all category shares together represent the full data set.
Build the circle graph idea
- 1Add the category counts to find the total.
- 2Treat the total as one whole circle.
- 3Write a category count over the total.
- 4Simplify the fraction when possible.
- 5Check that all category shares together make one whole.
Circle graph mix-ups
The mistake
Treating a category count as its fraction without checking the total.
The fix
Divide the category count by the total number in the group.
The mistake
Thinking the circle graph shows more than the whole group.
The fix
All slices together represent one whole; category fractions add to 1.
What to practice next
Make more practice
Questions parents and teachers ask
What does the whole circle stand for?
The full circle stands for every response or item in the data set. Each slice represents one category’s share of that total. The worksheet connects this idea to equal-part circle drawings and simple tables so children can relate counts to fractions.
How do I find a category fraction?
Put the category count over the total count, then simplify. Four votes out of eight make 4/8, which simplifies to 1/2. Questions 3, 8, and 9 ask children to connect a category in a small survey with its fraction of the total.
How can a fraction help find a number of votes?
Multiply the total by the fraction. If 12 students are the whole group and one third chose art, divide 12 into three equal groups; each group has 4 students. Question 15 practices this relationship between a category fraction and its count.
Why do all category shares make one whole?
The categories together include every response in the data set. Their counts add to the total, so their fractions add to 1 whole. Question 16 asks learners to explain this idea in a sentence using the meaning of the full data set.
How should I use the answer key?
Let the learner finish a part before checking answers. For a missed fraction, return to the category counts and total, then write the count over the total and simplify. The key lists a model explanation for the final question.