

About this worksheet
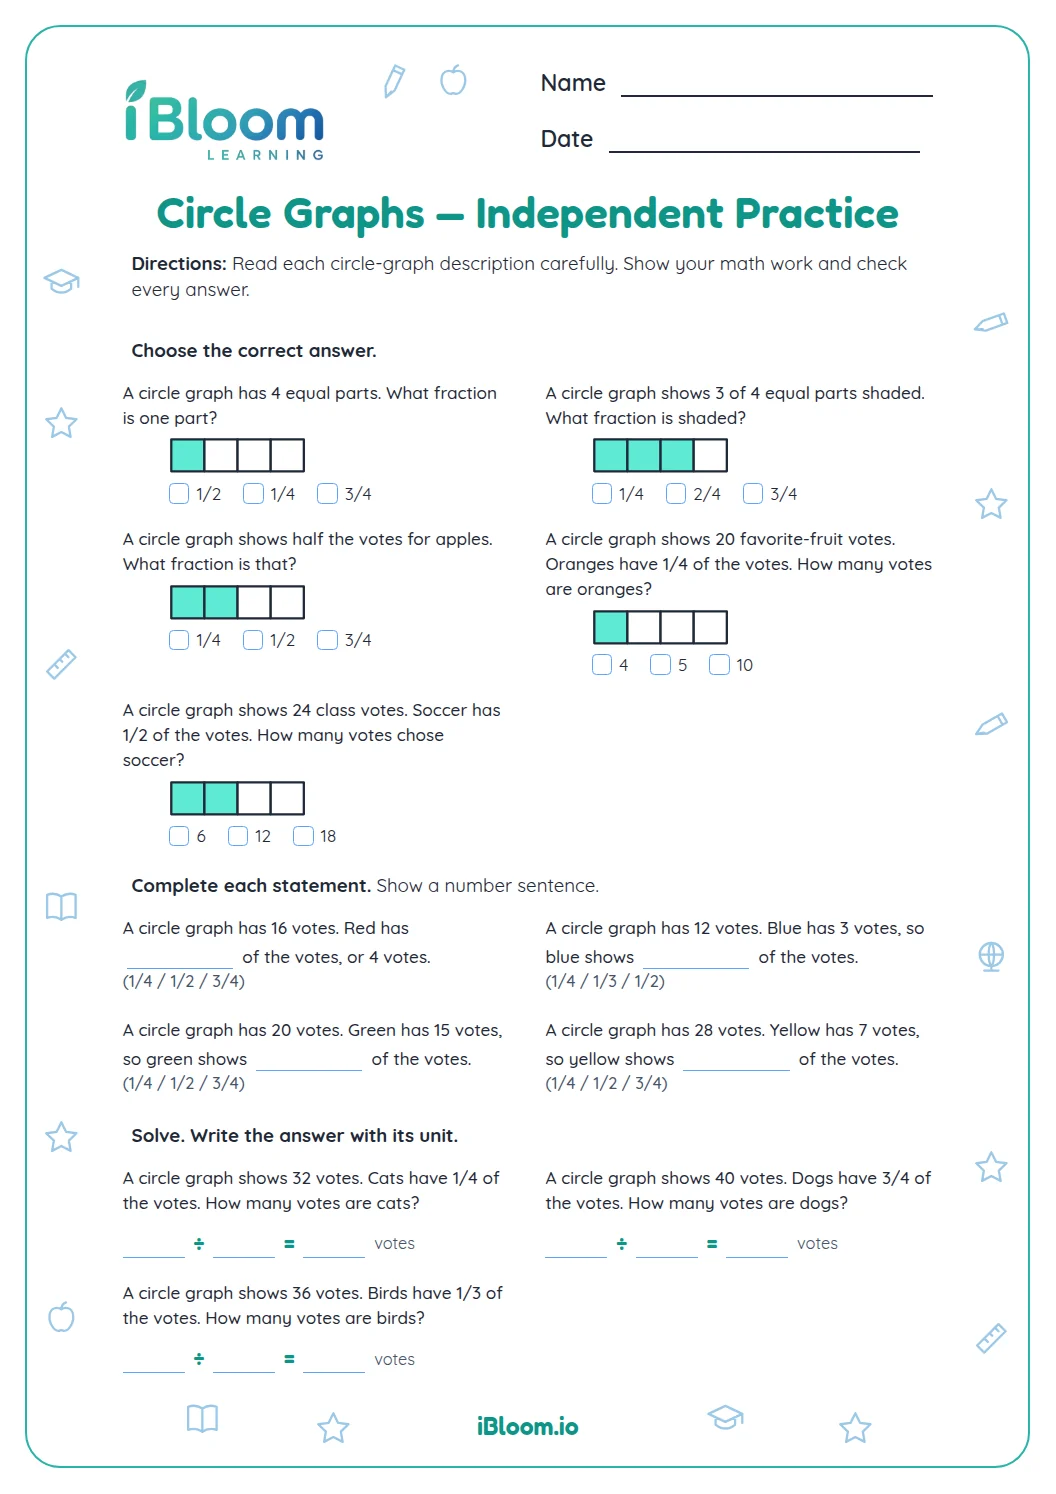
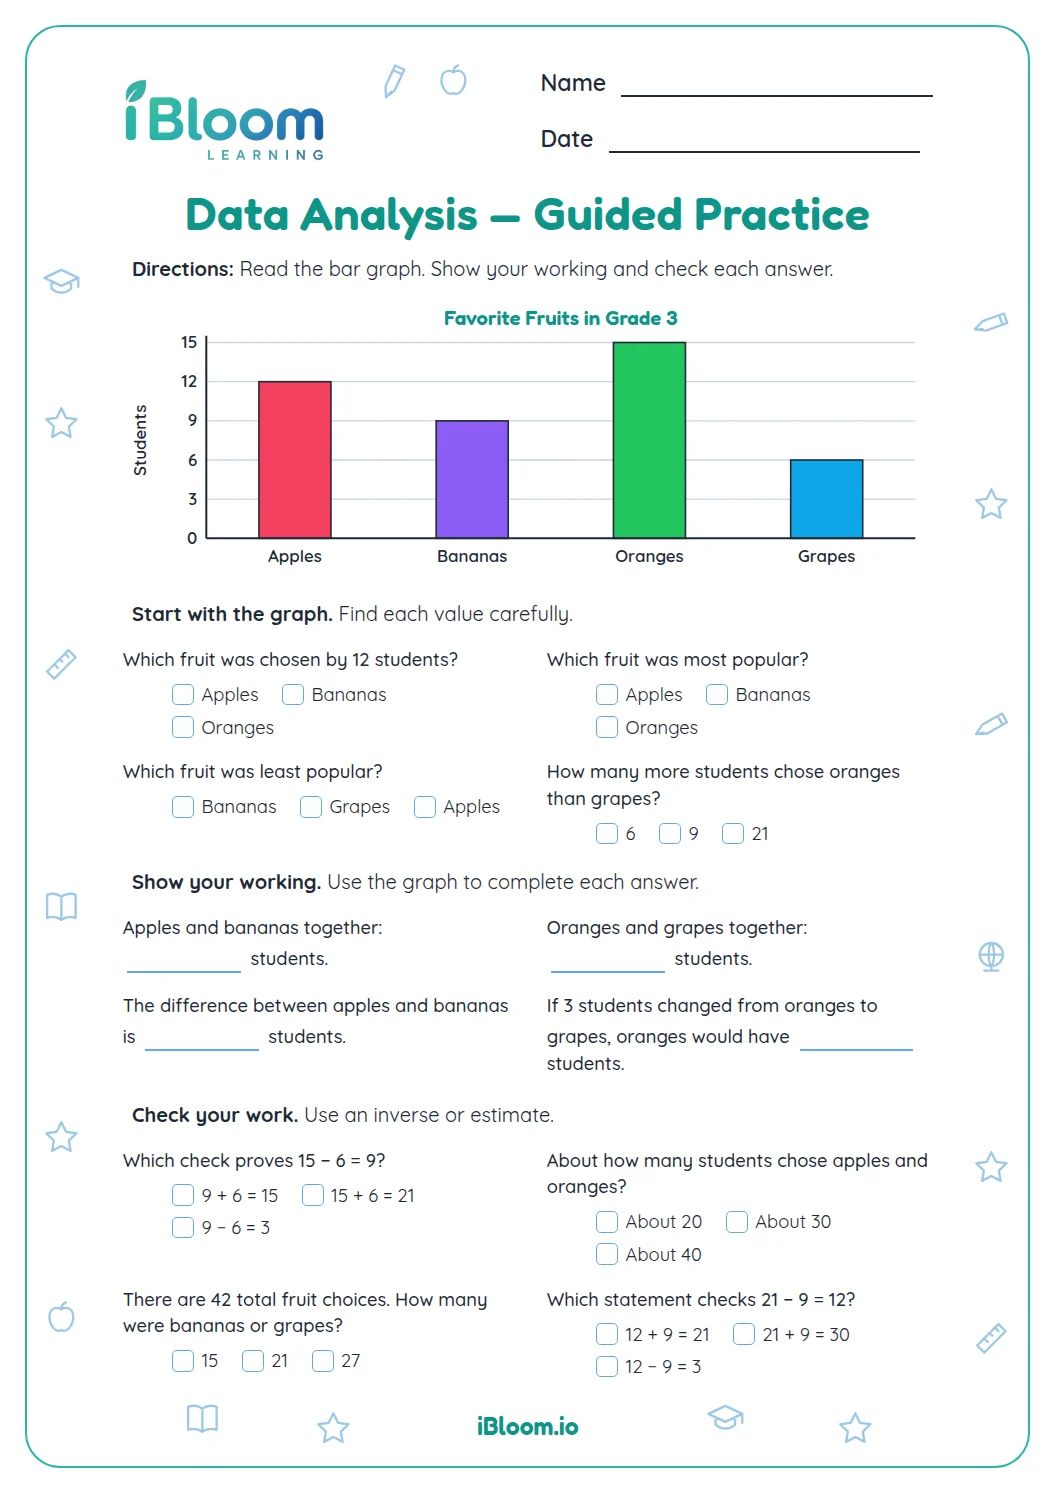
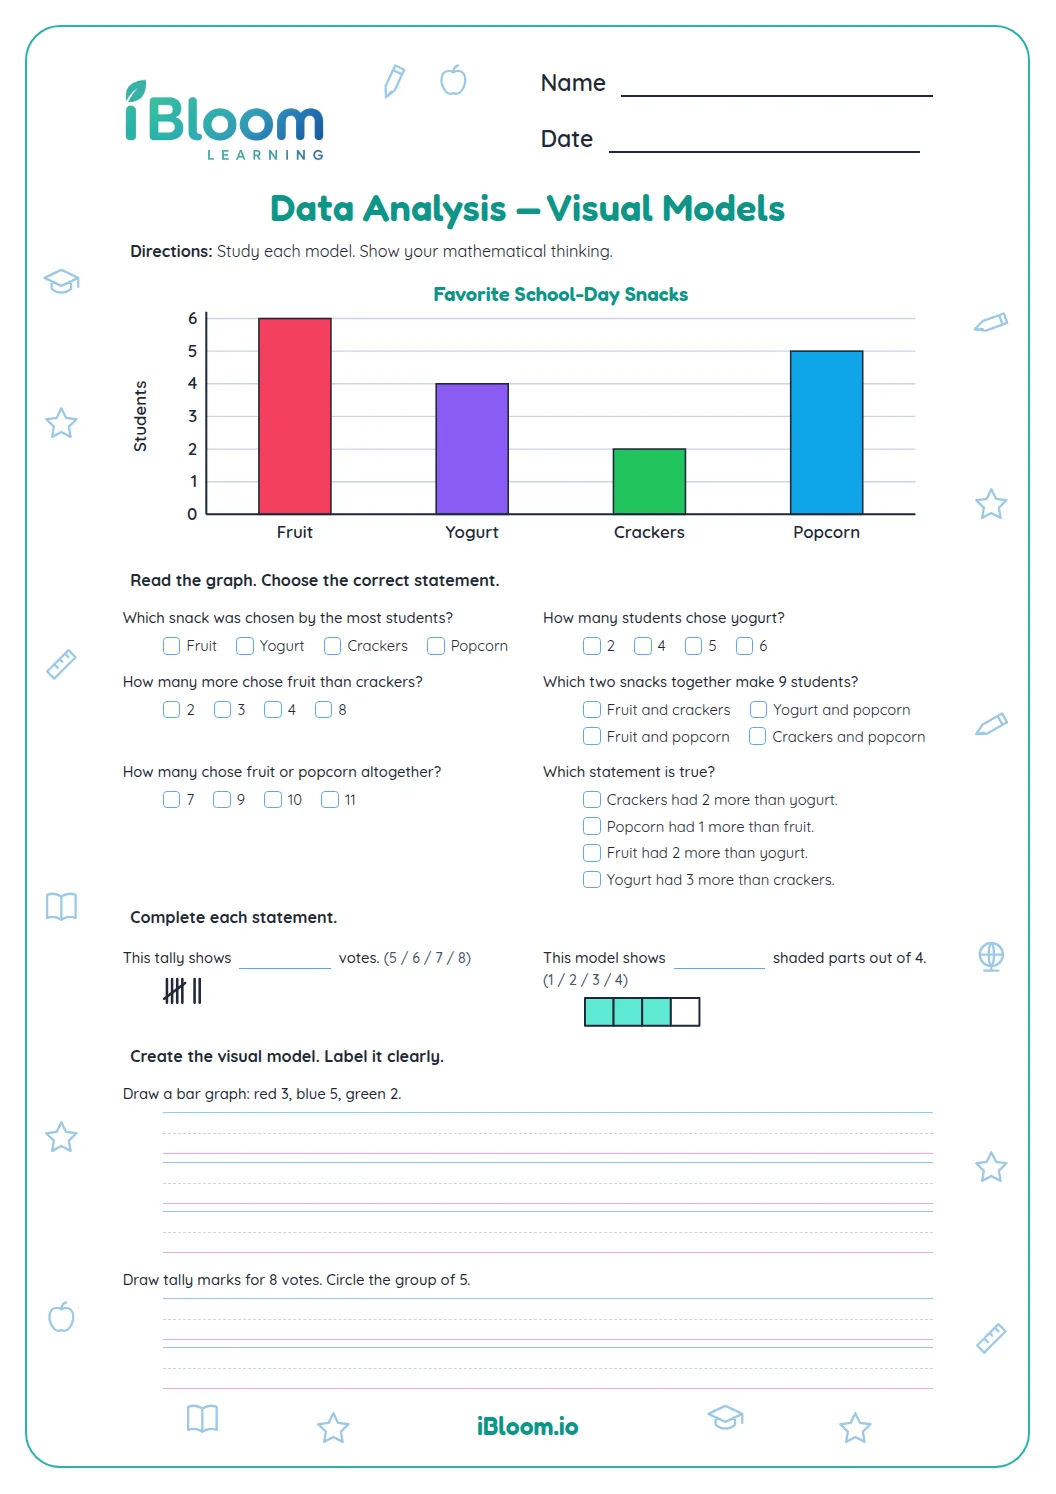
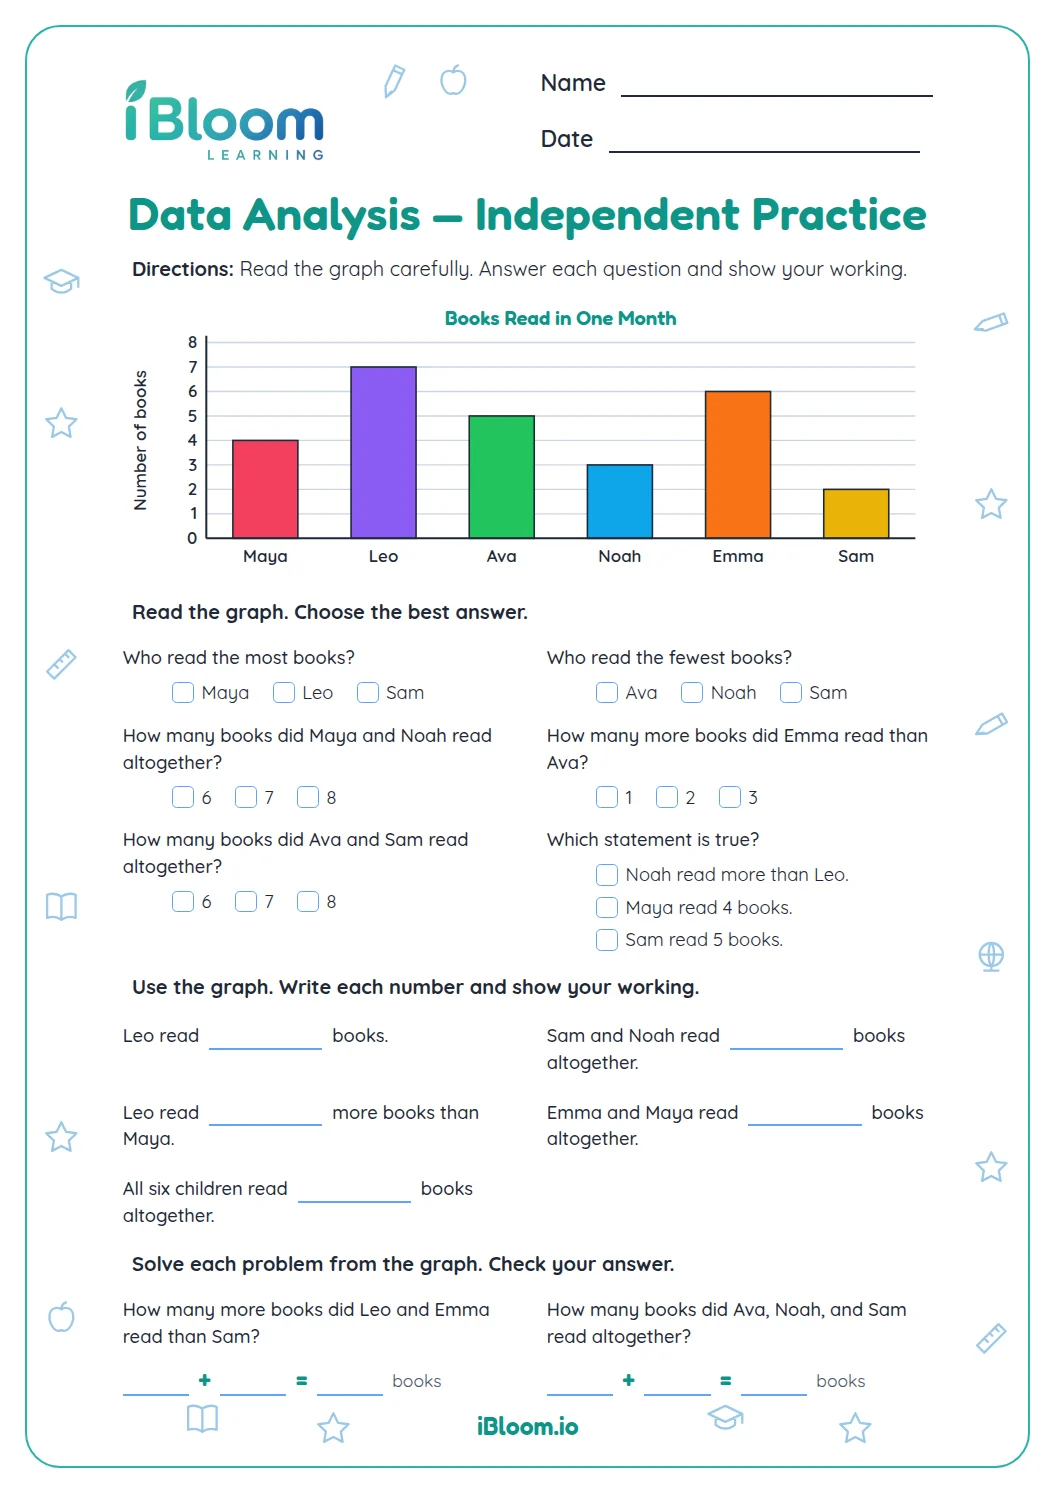
This Grade 3 worksheet uses shaded circle models to show fractions of one whole. Children count the equal sectors in each circle and name the shaded share, then answer a few questions about the whole and its sectors. Part A builds the count-and-name routine; Part B varies the models and asks students to read each share. The work practices CCSS 3.NF.A.1 by representing fractions as equal parts of one whole. A separate key lists the answers.
Aligned to 3.NF.A.1
How do you name a shaded share?
Count all equal sectors first; that is the denominator. Count the shaded sectors next; that is the numerator. Together, the numbers name the shaded share of one whole circle.
- 1A circle split into 4 equal parts with 3 shaded represents 3/4.
Why must the circle parts be equal?
Equal sectors matter because a fraction counts equal-sized parts. These models divide each circle evenly, so counting shaded sectors gives a fair share of the whole.
- 1With 6 equal sectors and 2 shaded, the shaded share is 2/6.
How does a fraction connect to a circle graph?
A circle graph organizes one whole into category shares. Each sector or group of sectors represents part of the total. Reading a circle graph means comparing a category’s share with the entire circle. Parts A and B both use circle models to practice naming those shares.
How to use this worksheet
- 1Count the total equal sectors.
- 2Count the shaded sectors.
- 3Write the shaded count over the total count.
- 4For Part B, compare the model with the fraction in the prompt.
- 5Use the answer key to check both counts.
Common mistakes and quick fixes
The mistake
Writing the total number of sectors as the numerator.
The fix
The numerator goes on top and tells how many sectors are shaded.
The mistake
Counting only shaded sectors for both numbers.
The fix
Count every sector for the denominator, including the unshaded ones.
The mistake
Treating unequal pieces as equal shares.
The fix
Look for equal-sized sectors before counting the parts.
Common Core alignment
This worksheet practices the listed Common Core skill through the questions and models on the page.
Understand a fraction as equal parts of one whole.
On this sheet: Each circle is partitioned into equal parts and the shaded share is named as a fraction.
Show the official wordingHide the official wording
Understand a fraction 1/b as the quantity formed by 1 part when a whole is partitioned into b equal parts; understand a fraction a/b as the quantity formed by a parts of size 1/b.
What to practice next
Make more practice
Further reading
Questions parents and teachers ask
What does the denominator tell me?
The denominator is the bottom number in a fraction. It tells how many equal sectors make up the whole circle. For example, a circle split into eight equal sectors has 8 as its denominator, whether one sector or several are shaded.
What does the numerator tell me?
The numerator is the top number in a fraction. It tells how many equal sectors are shaded. If 2 of 6 sectors are shaded, the model represents 2/6. Count the shaded sectors only after you have counted all the sectors in the circle.
Are these models complete circle graphs?
The worksheet uses circle sectors to practice reading fractional shares. It does not include category labels or a data key, so students focus on how many equal parts make the whole and how many of those parts are shaded.
Can 2/6 also be written as 1/3?
Yes. Two sixths and one third name the same amount because 2 of 6 equal sectors cover the same share as 1 of 3 equal parts. On this worksheet, record the fraction by counting the sectors actually drawn.
What should I do if my fraction differs from the key?
Count the equal sectors around the whole circle again, then count the shaded sectors. Put the shaded count on top and the total count on the bottom. Compare those two counts with the model before checking the answer key.