
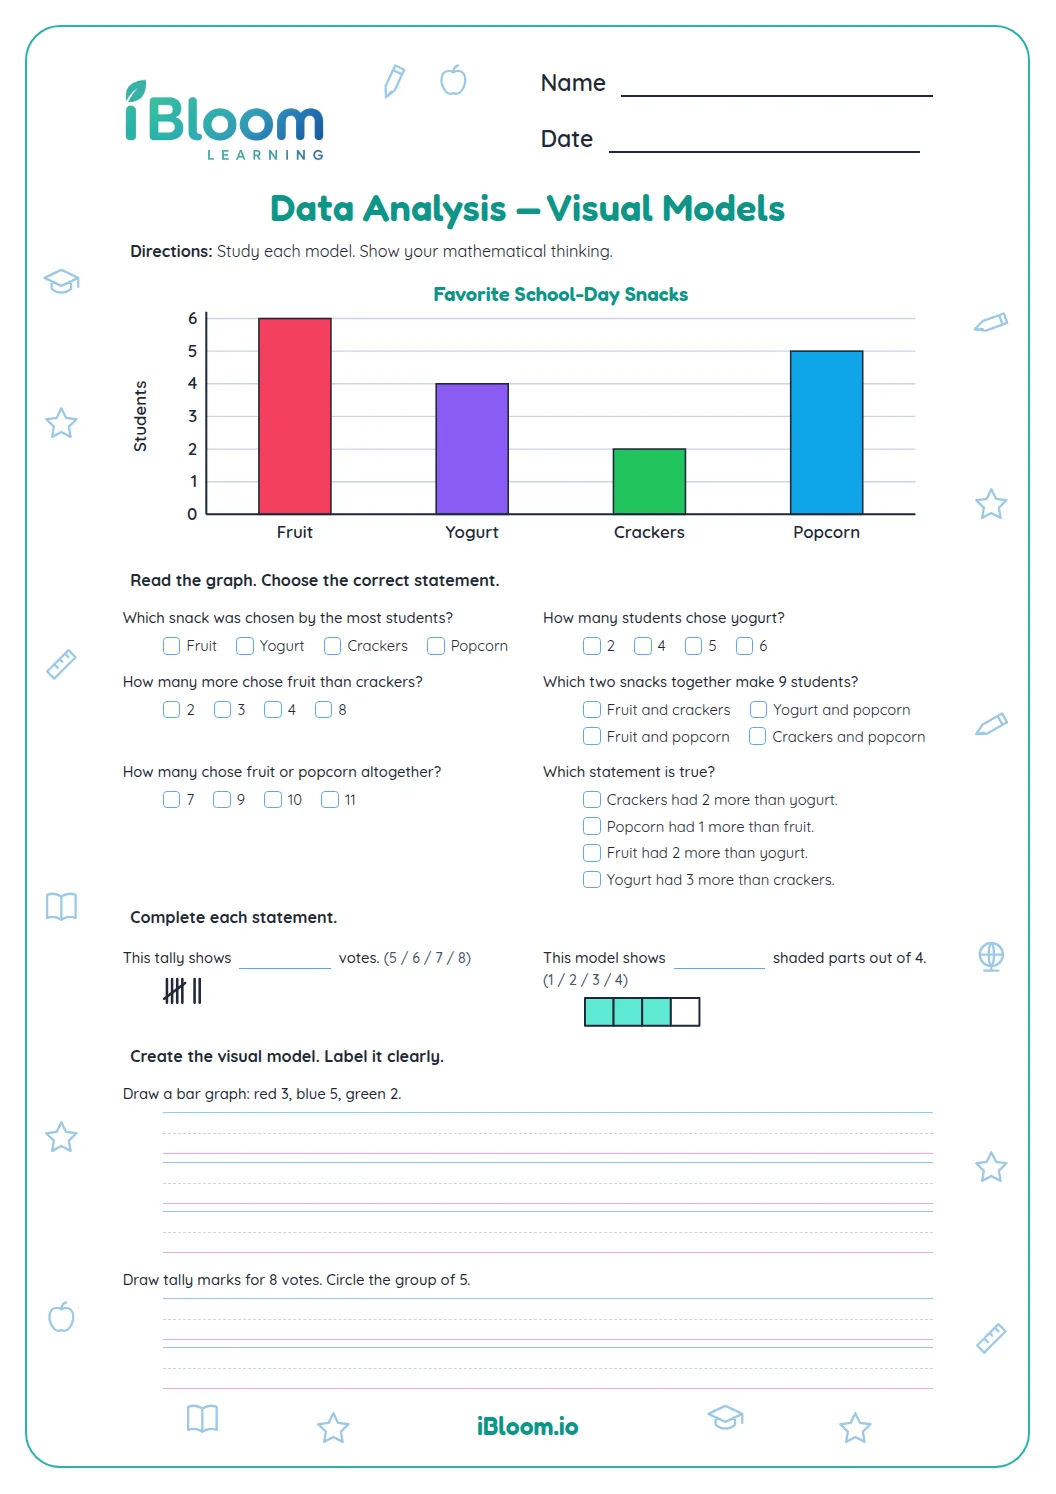
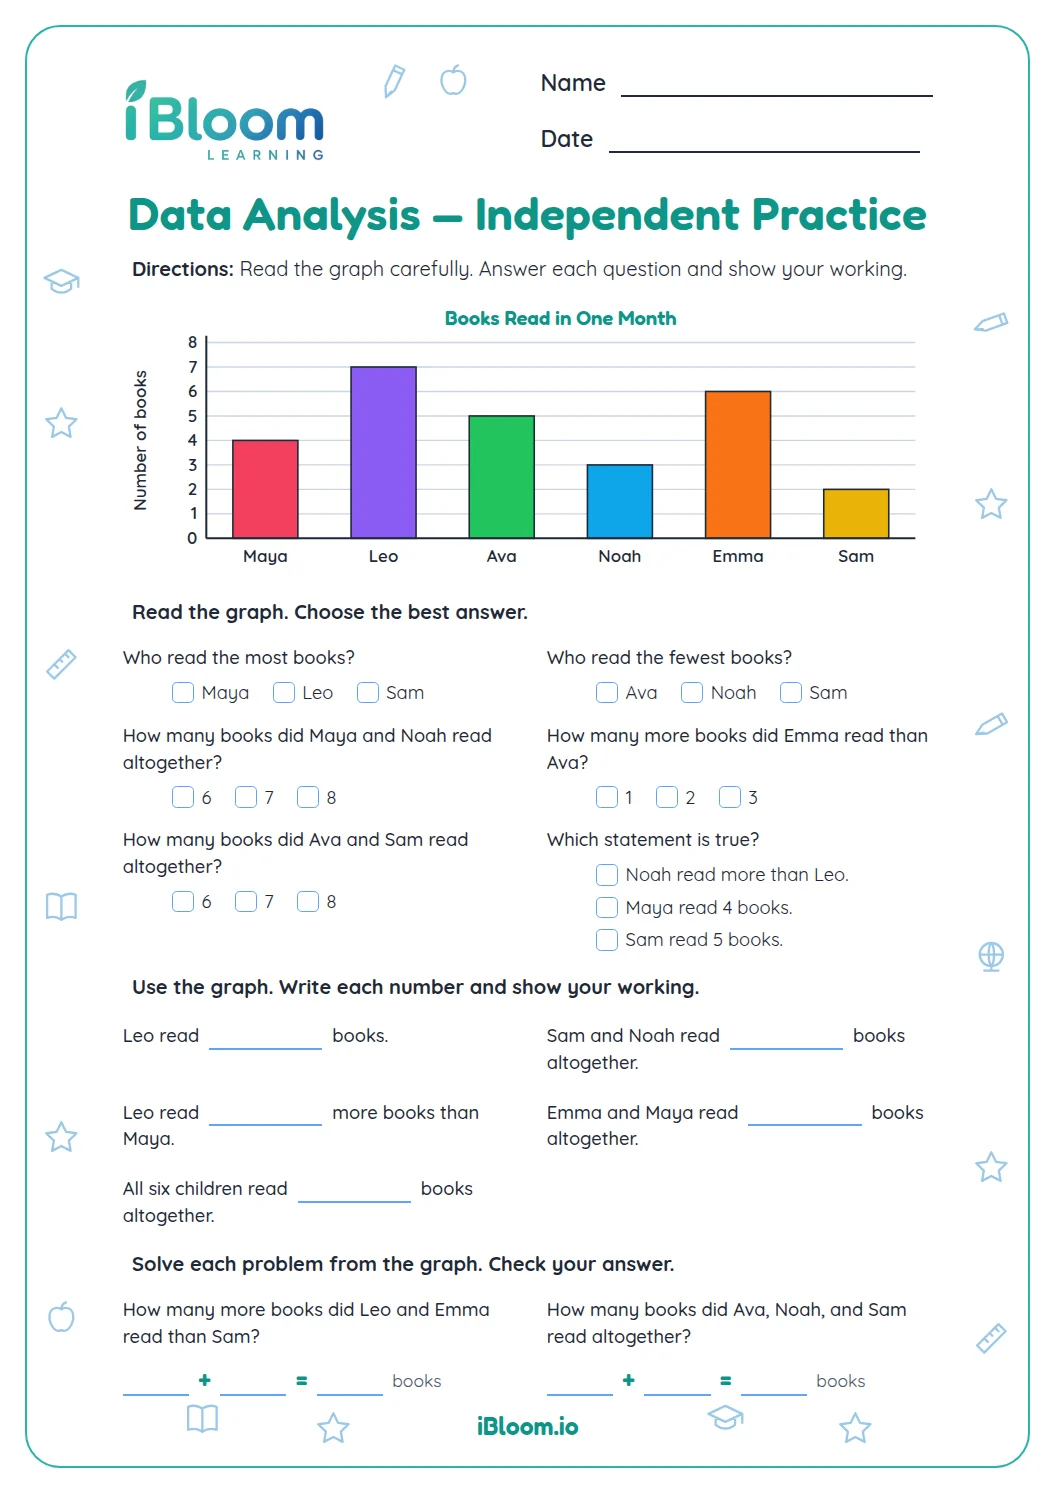
About this worksheet
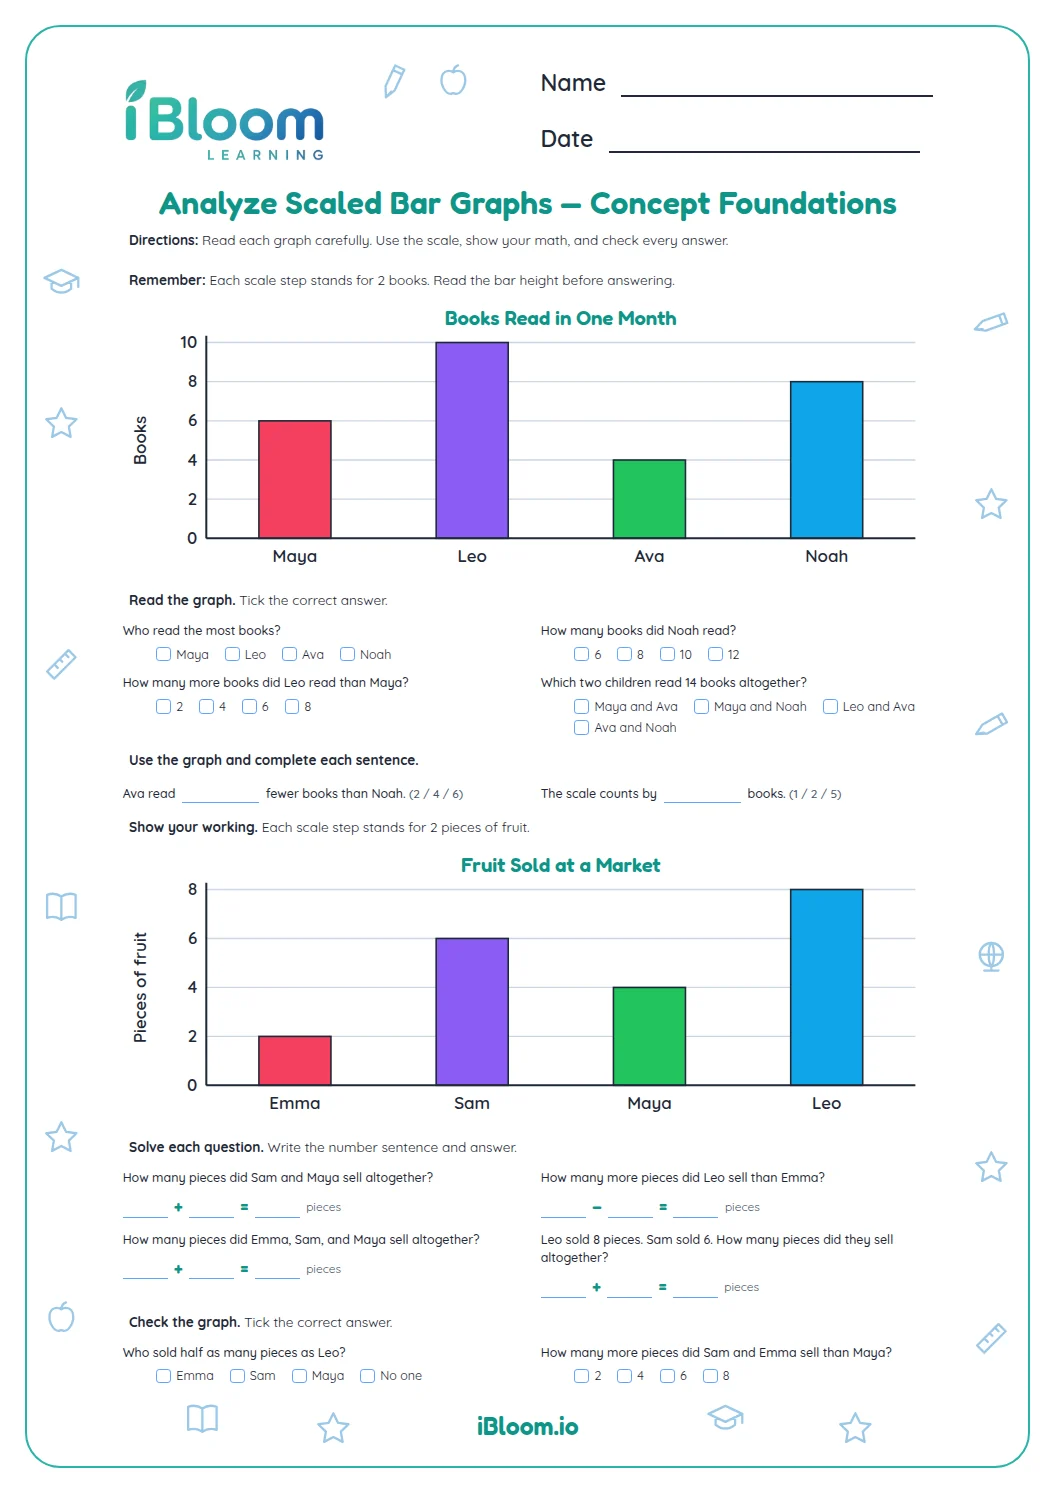
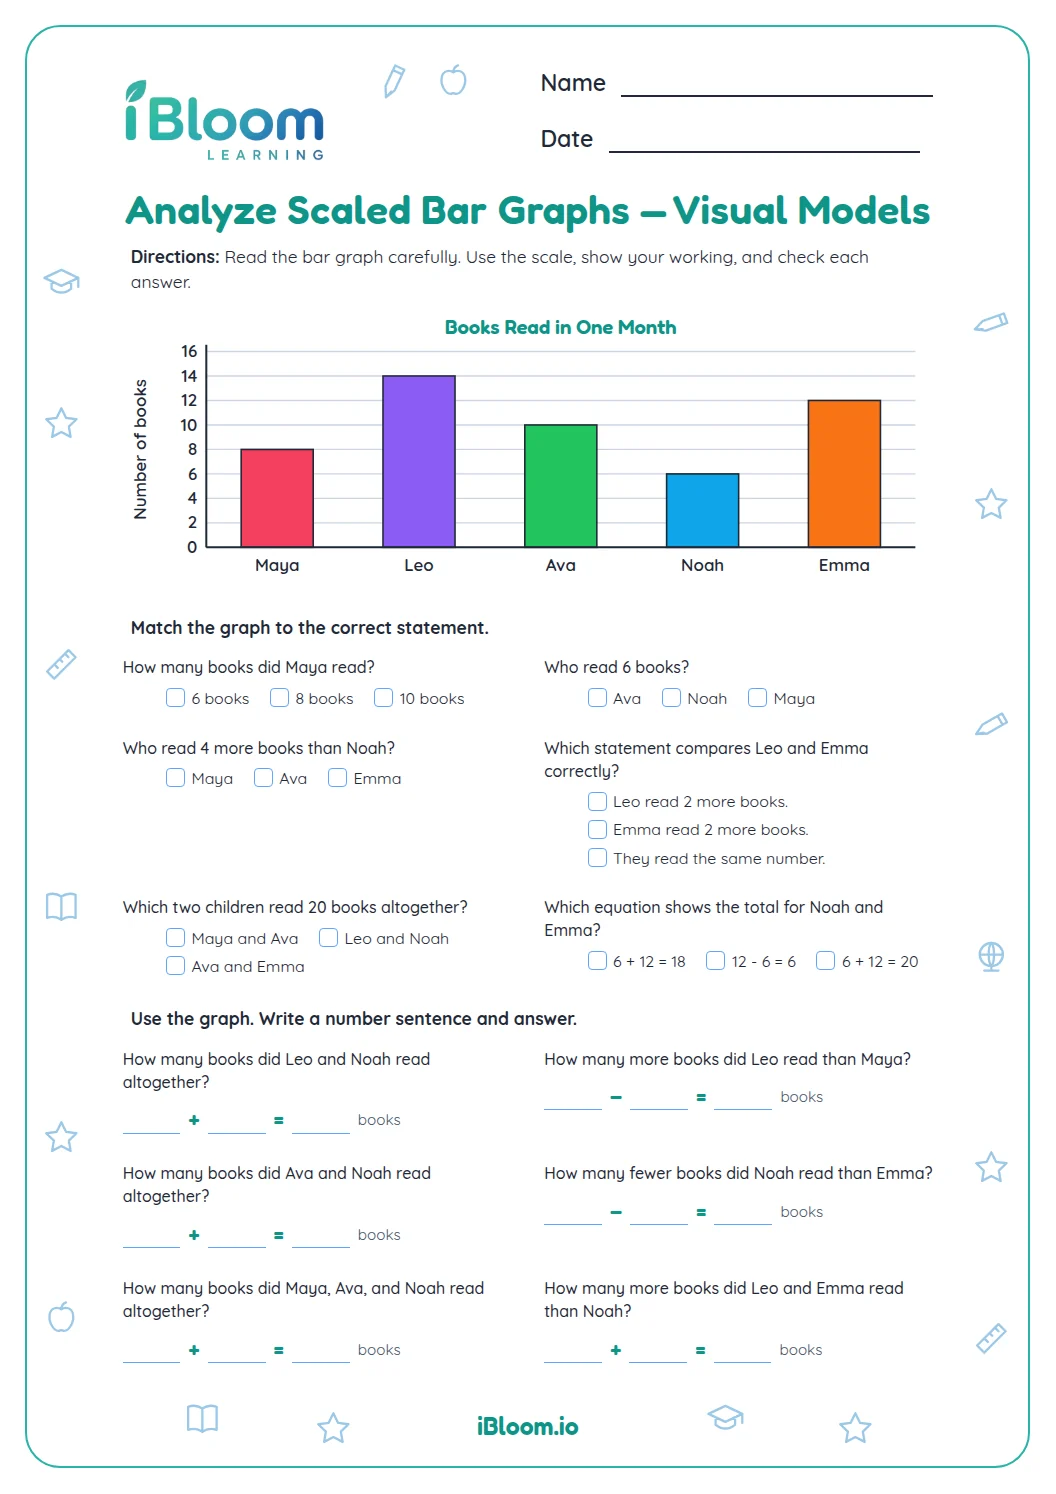
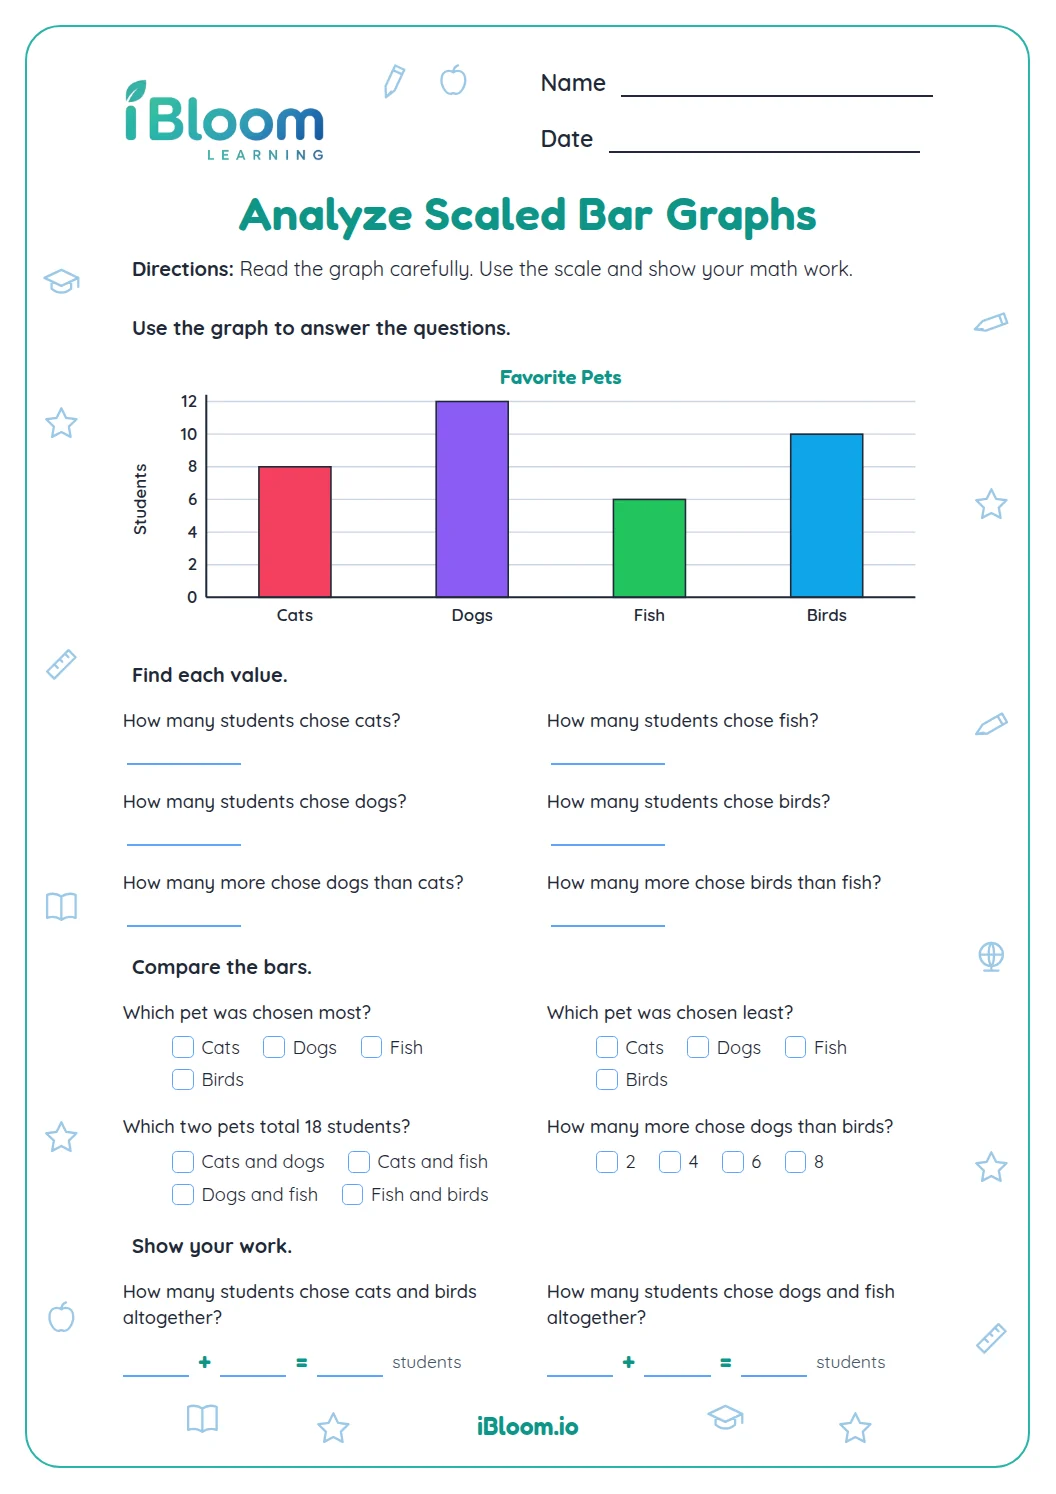
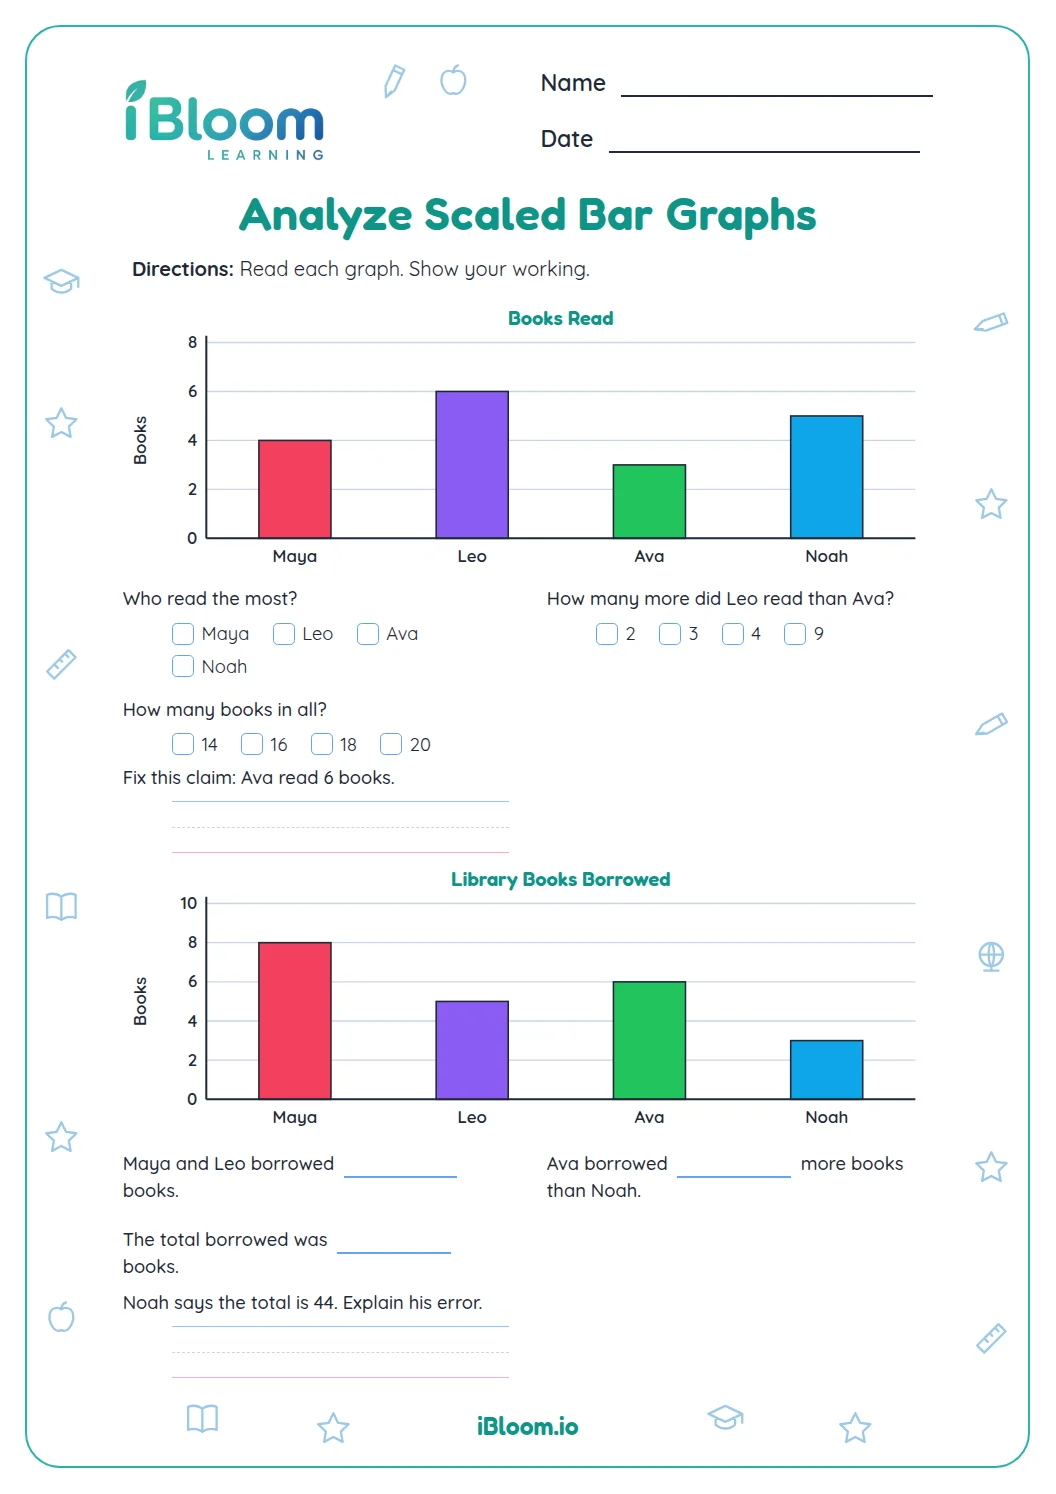
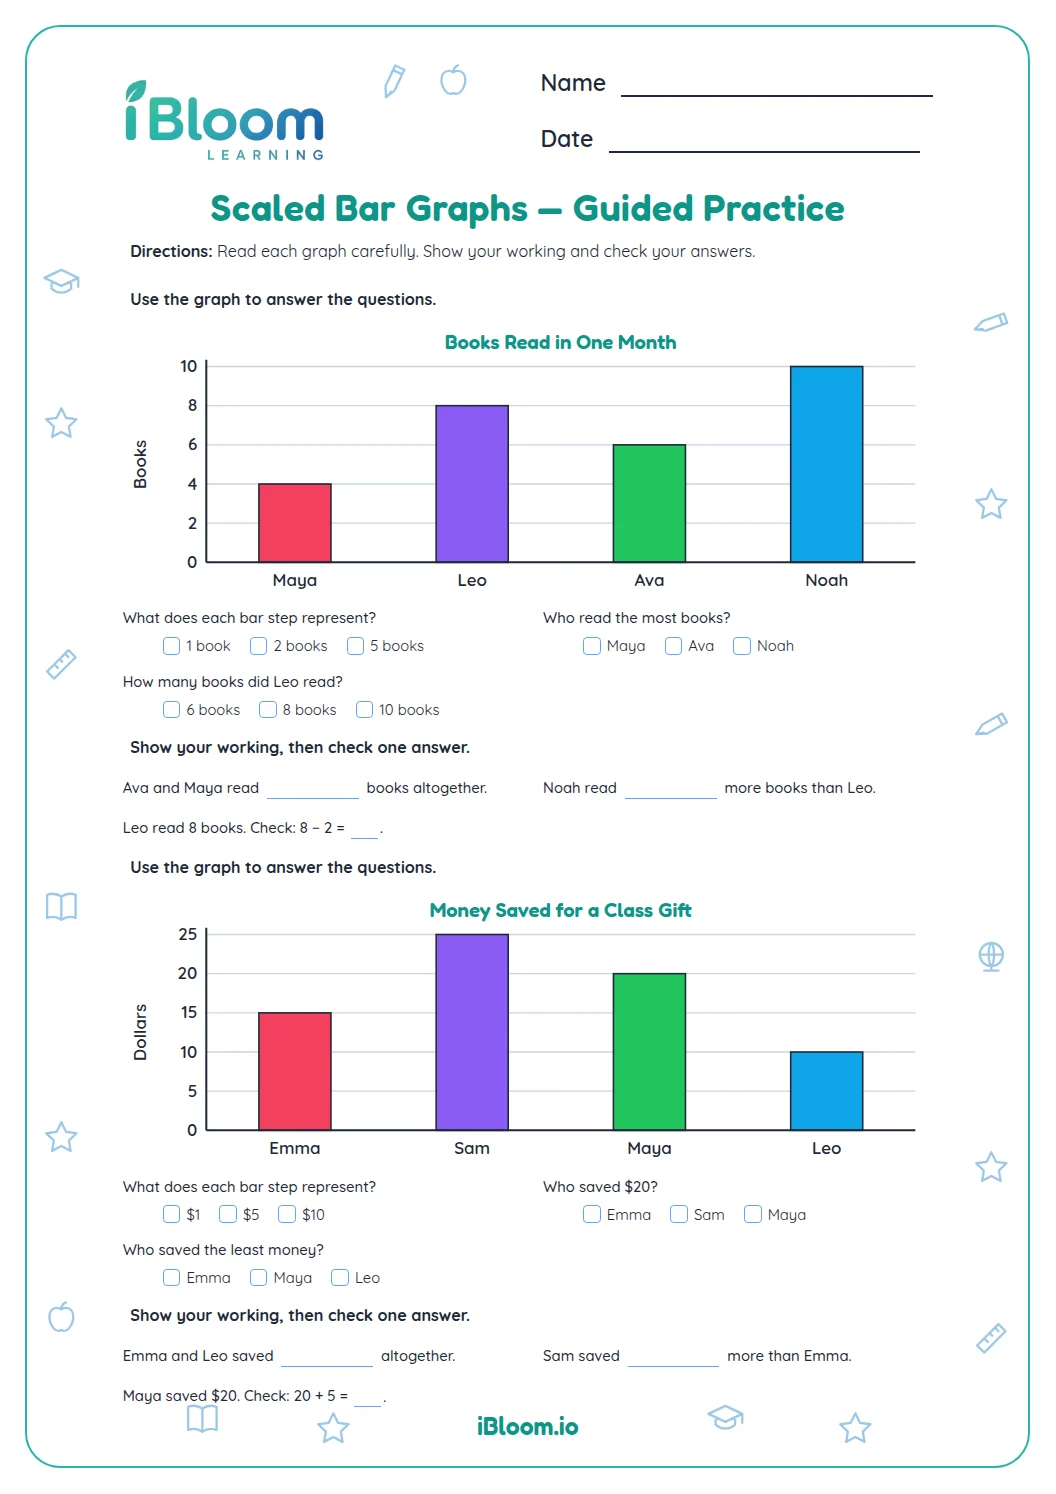
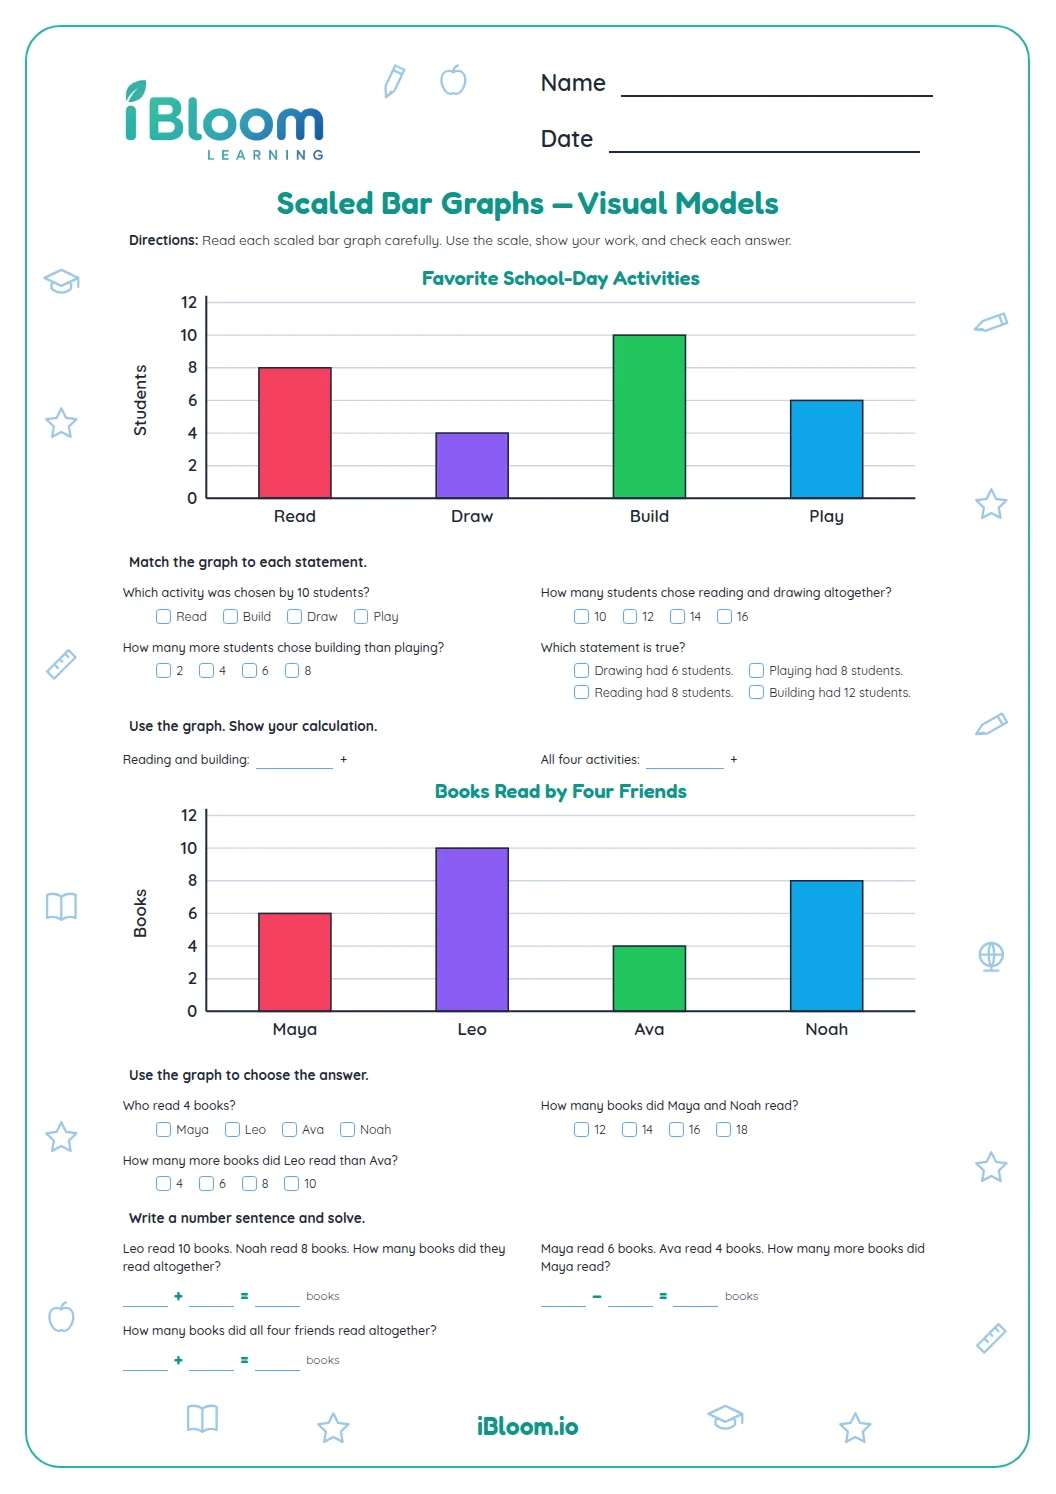
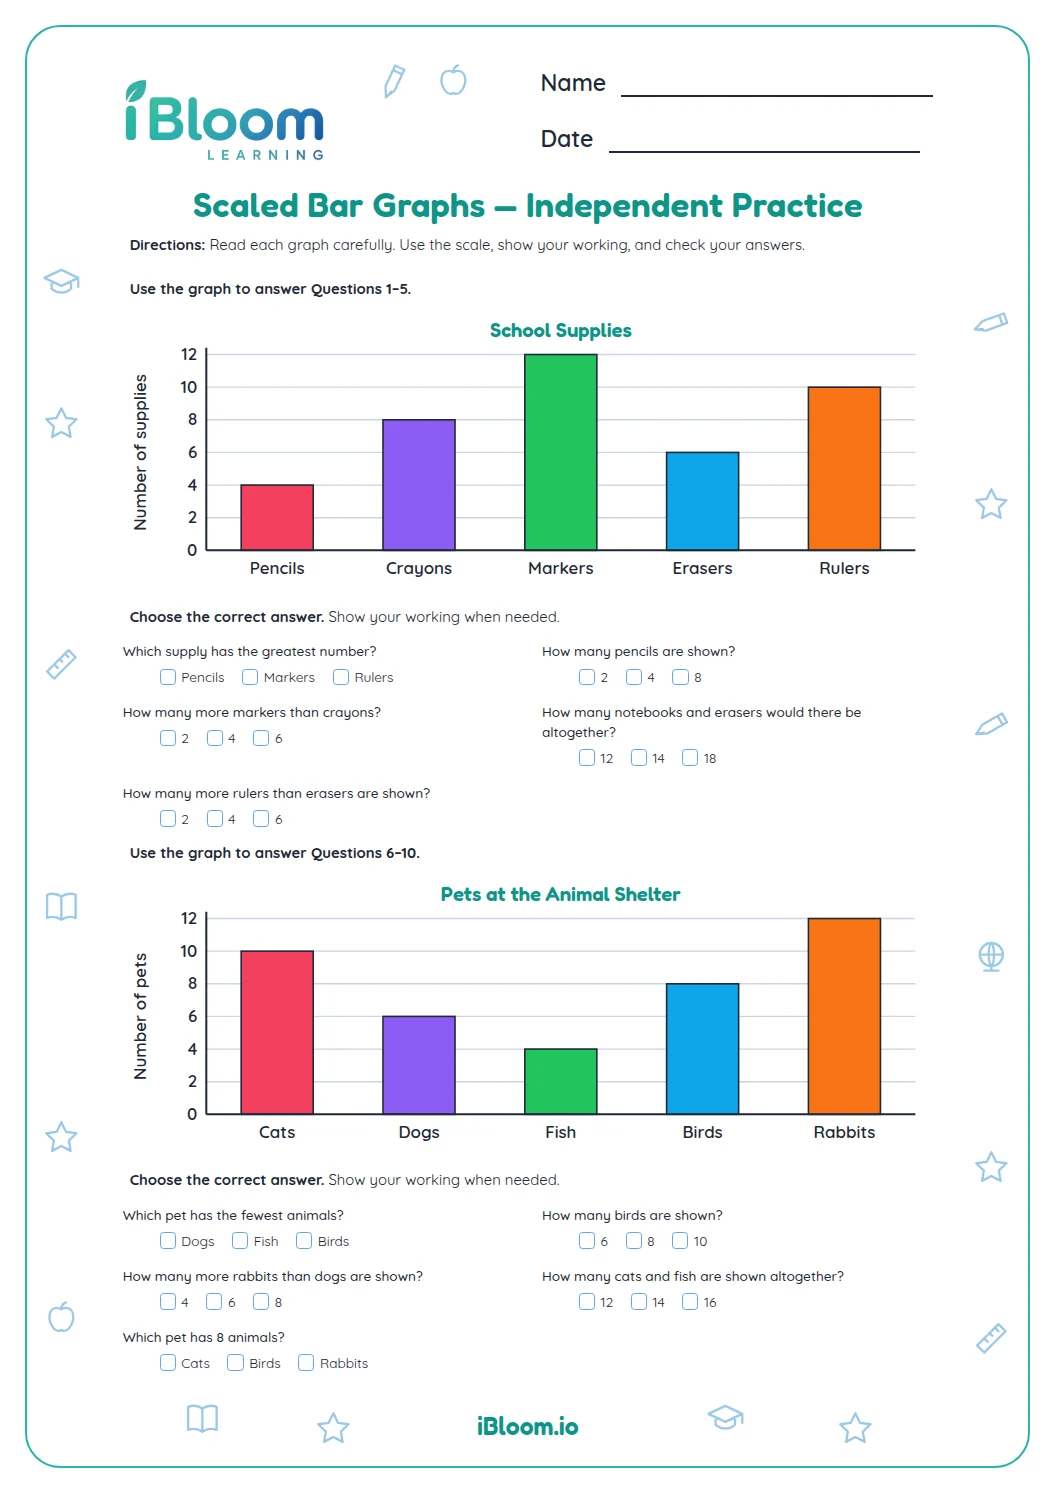
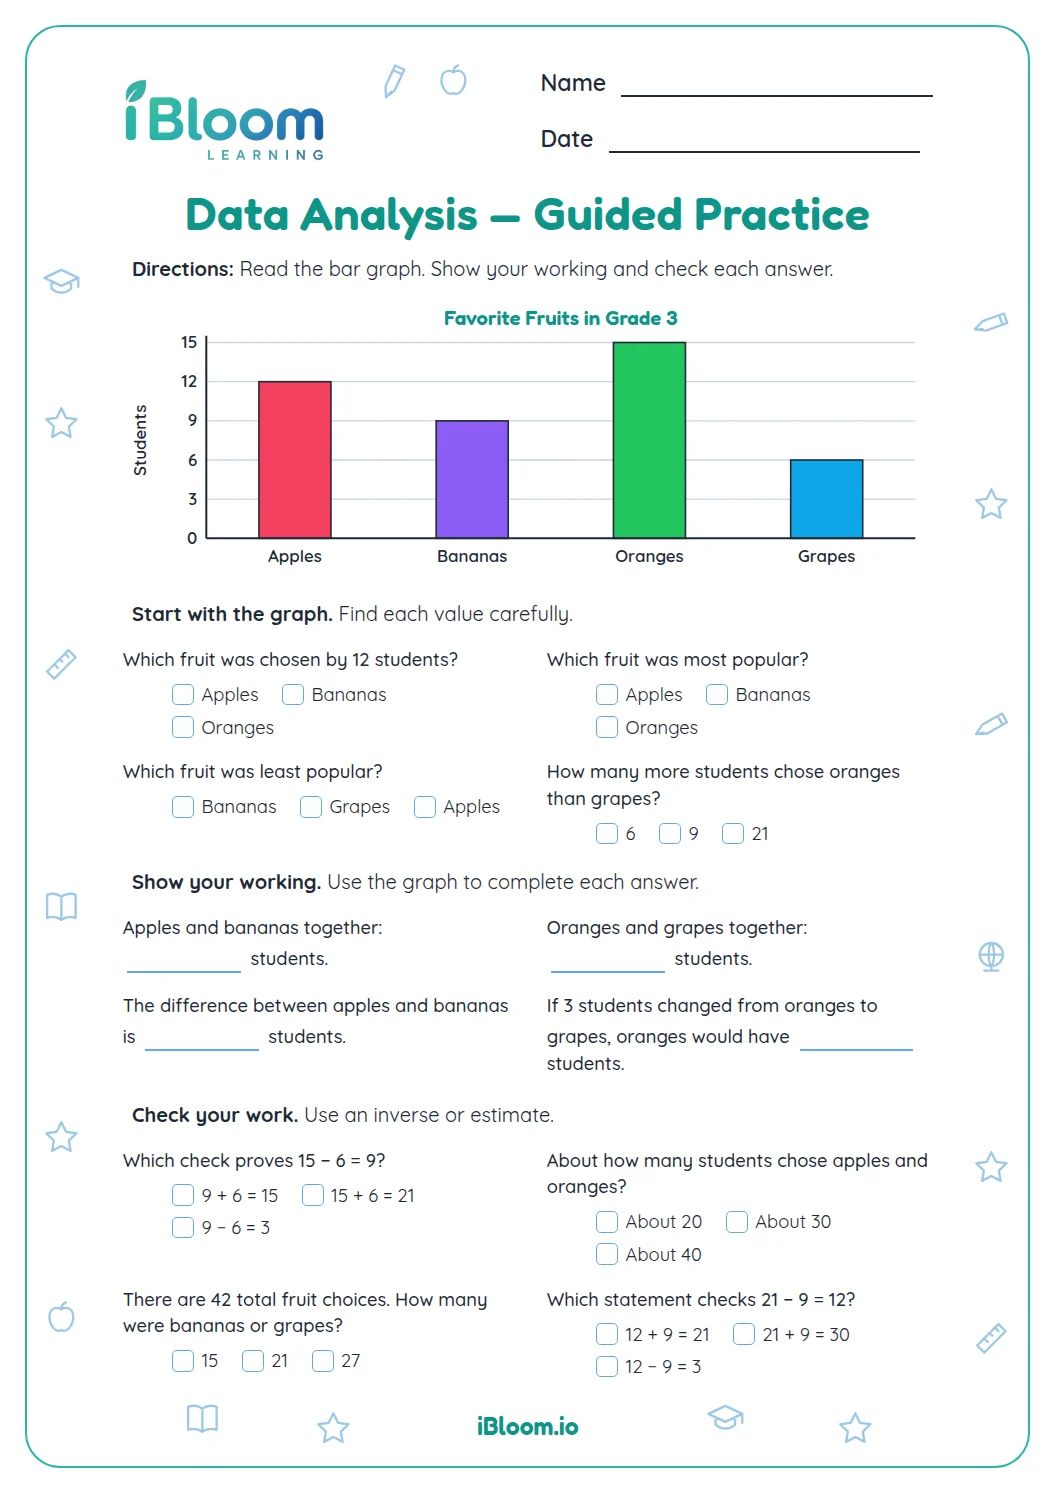
Children read one classroom book-vote bar graph with a scale of 2 votes per grid step. The 14 questions ask them to identify categories, read values, combine votes, compare amounts, and find totals. The same graph is repeated on the second question page so children can refer to it, and a separate answer key is included.
Aligned to 3.MD.B.3
How does the graph scale show each vote total?
The vertical axis counts by 2, so each grid step stands for two votes. Read the numbered axis first, then match the top of a bar to its value. The Mystery bar reaches 8 votes, while the Poems bar reaches 6.
For a question about how many more, read both bars and subtract. For a total, add the named categories or all four categories.
- 1Mystery: 8 votes; Poems: 6 votes
- 28 − 6 = 2
- 3Mystery received 2 more votes than Poems.
What do the graph questions ask?
One classroom vote graph supports questions that move from locating a category to combining values and comparing amounts.
- Read category values from the scale
- Combine categories to find totals
- Compare amounts and find differences
How can students check a graph answer?
Read the axis labels again before calculating. When adding categories, copy each value once; when comparing categories, subtract the smaller value from the larger one.
The graph is repeated on the second question page for reference. The key gives the category, comparison, and total answers.
A routine for graph questions
- 1Read the title and axis label.
- 2Find the number represented by one grid step.
- 3Locate the bar or bars named in the question.
- 4For altogether questions, add the requested values. For how-many-more questions, subtract the smaller value from the larger.
- 5Check that the answer uses the graph’s unit, such as votes, pounds or walkers.
Common graph-reading slips
The mistake
Reading a bar’s grid steps as ones when the scale counts by 2, 4 or 5.
The fix
Say the scale aloud and count by that amount at every gridline.
The mistake
Choosing the tallest bar when asked for the fewest.
The fix
Circle the key word most or fewest before comparing the bars.
The mistake
Adding values for a question that asks how many more.
The fix
Find the difference by subtracting the smaller category from the larger one.
Common Core alignment
This worksheet practices interpreting a scaled bar graph and solving questions with its data.
Read a scaled bar graph and solve one- and two-step questions with its data.
On this sheet: Students read one scaled bar graph, combine category values, and compare how many more.
Show the official wordingHide the official wording
Draw a scaled picture graph and a scaled bar graph to represent a data set with several categories. Solve one- and two-step how many more and how many less problems using information presented in scaled bar graphs.
What to practice next
Make more practice
Further reading
Questions parents and teachers ask
Why do the graphs count by more than one?
A scale lets a graph show a larger amount in a compact space. Each grid step may stand for 2, 4 or 5 items, so read the axis labels before reading a bar. Counting the gridlines by the scale gives the value represented by each bar.
How do students find how many more?
Read both category values using the scale, then subtract the smaller amount from the larger one. The difference tells how many more belong to the category with the greater bar. Recheck each value before subtracting so the graph scale is used correctly.
How do students find a total from a graph?
Read the values named in the question and add them. For a whole-graph total, add every category once. Make sure each bar value comes from the labeled scale, then use addition to combine the amounts. A quick estimate of the sum can help catch a missed category or scale step.
Is an answer key included?
Yes. The separate key gives category answers and each calculated total or difference. Students can use it after completing the questions to review whether they read the axis correctly and chose addition or subtraction for the task. It is useful for a quick independent check.
Why does the graph repeat on the second page?
The questions continue onto a second page, so the same bar graph is printed there for reference. Children can read the scale and category values without turning back to the first page. Both copies show the same four vote totals.
How many votes did the class cast?
The graph shows 8 votes for Mystery, 14 for Animals, 10 for Comics, and 6 for Poems. Add the four values once: 8 + 14 + 10 + 6 = 38 votes. Question 13 asks students to find this total from the graph.