
About this worksheet
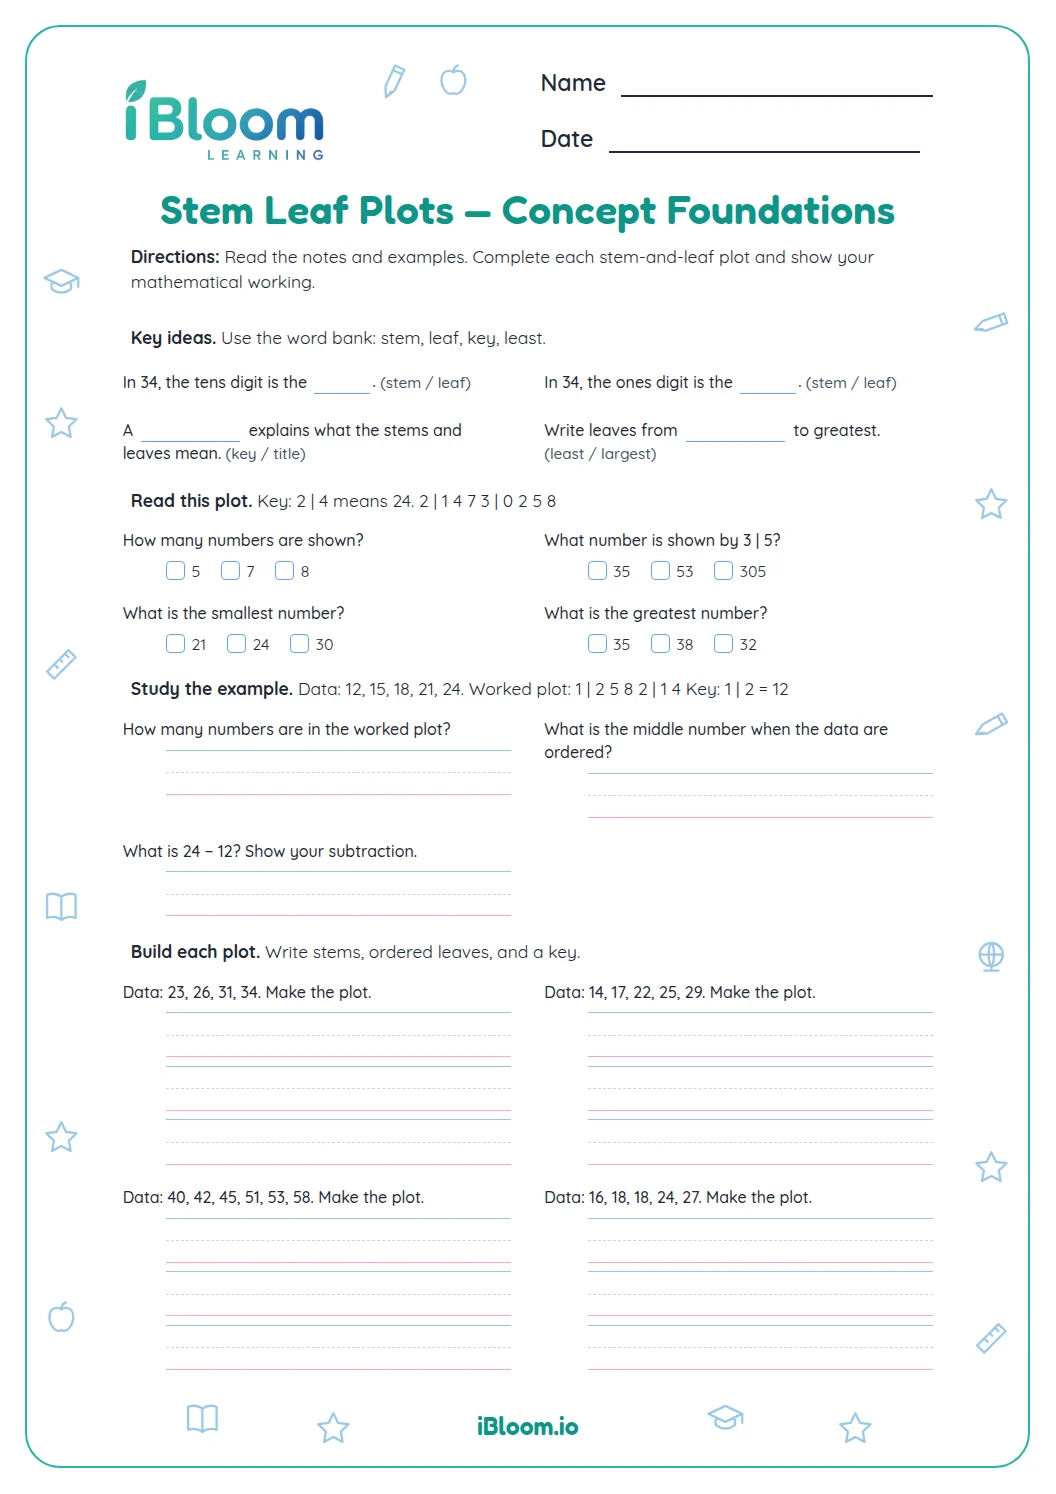
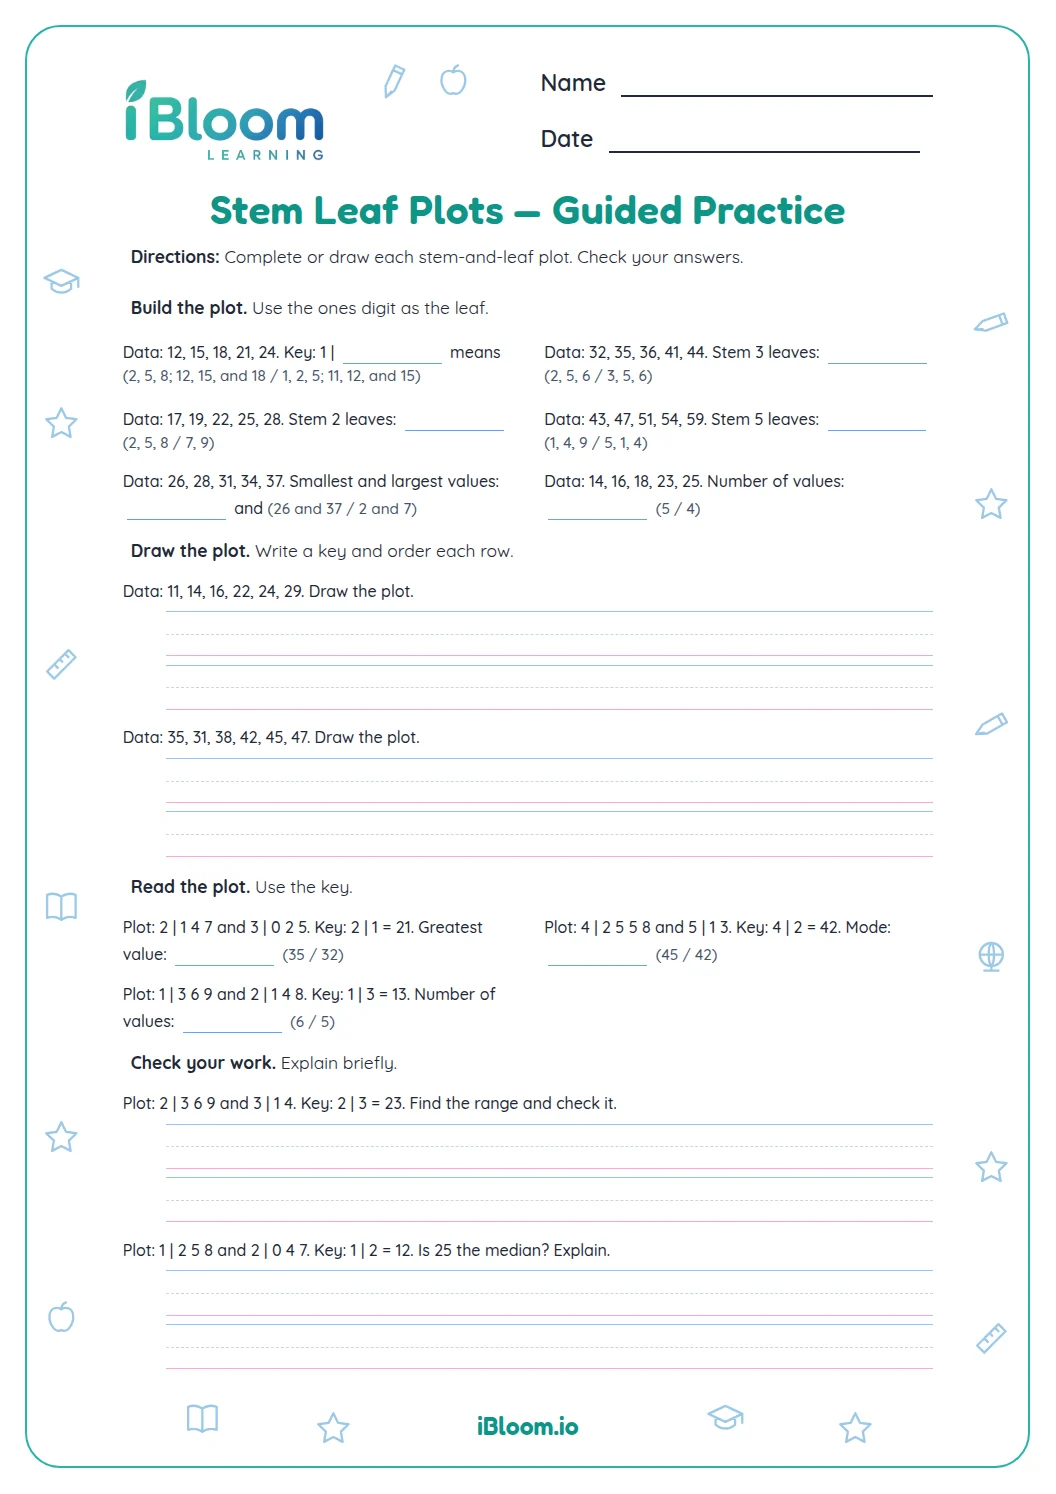
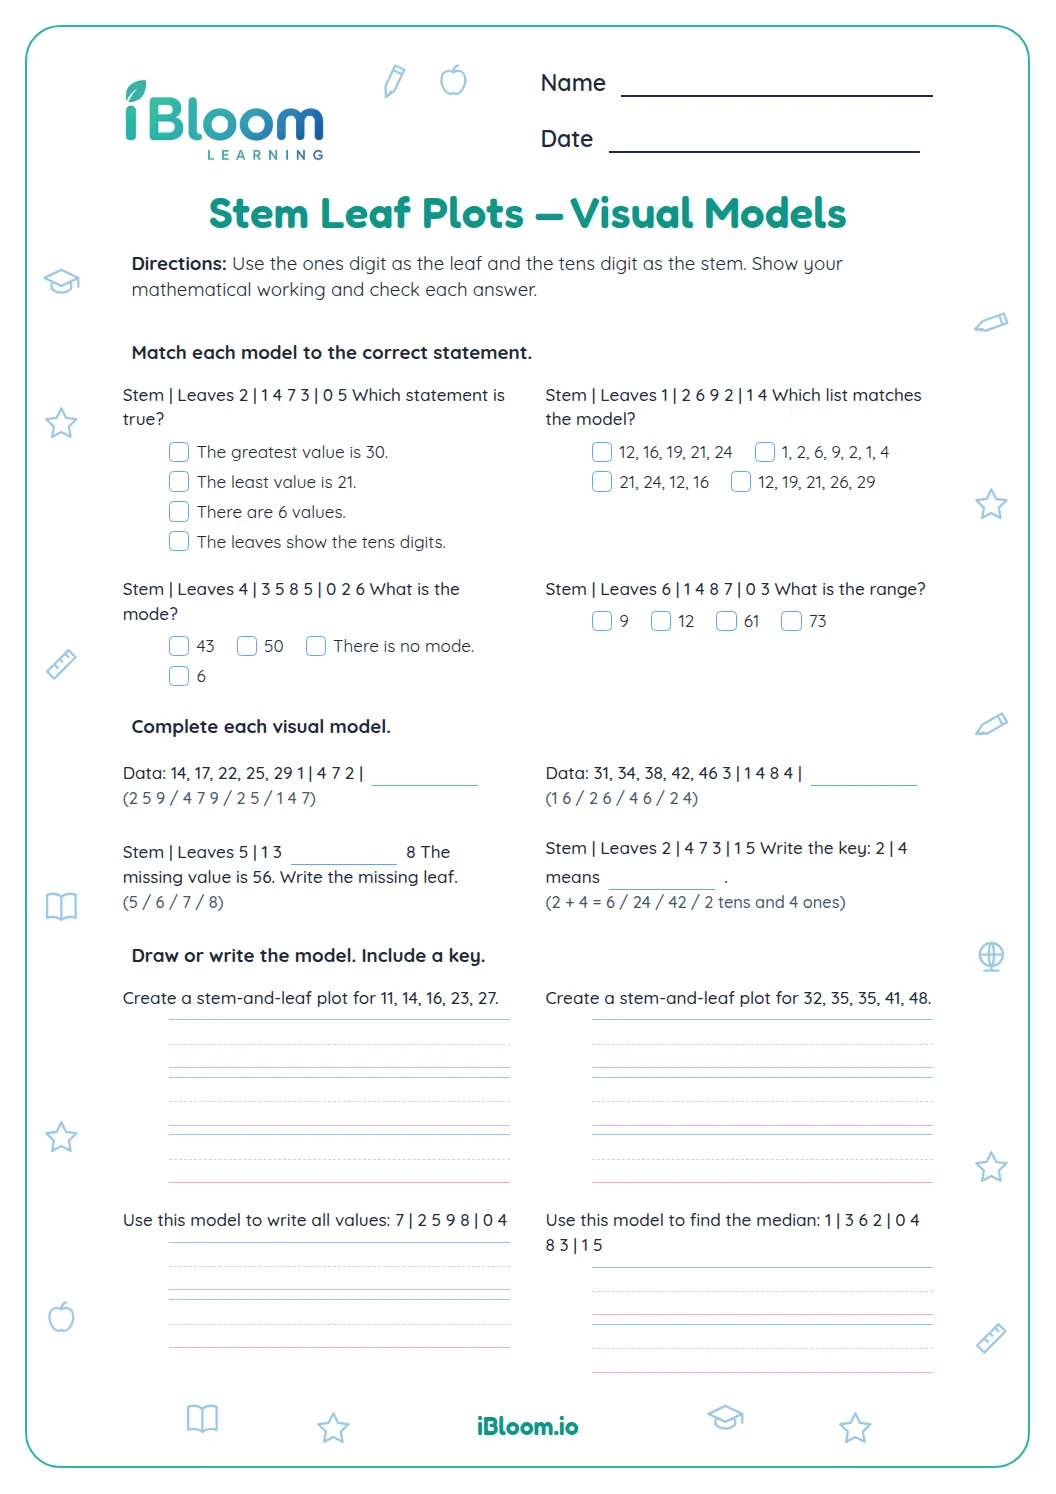
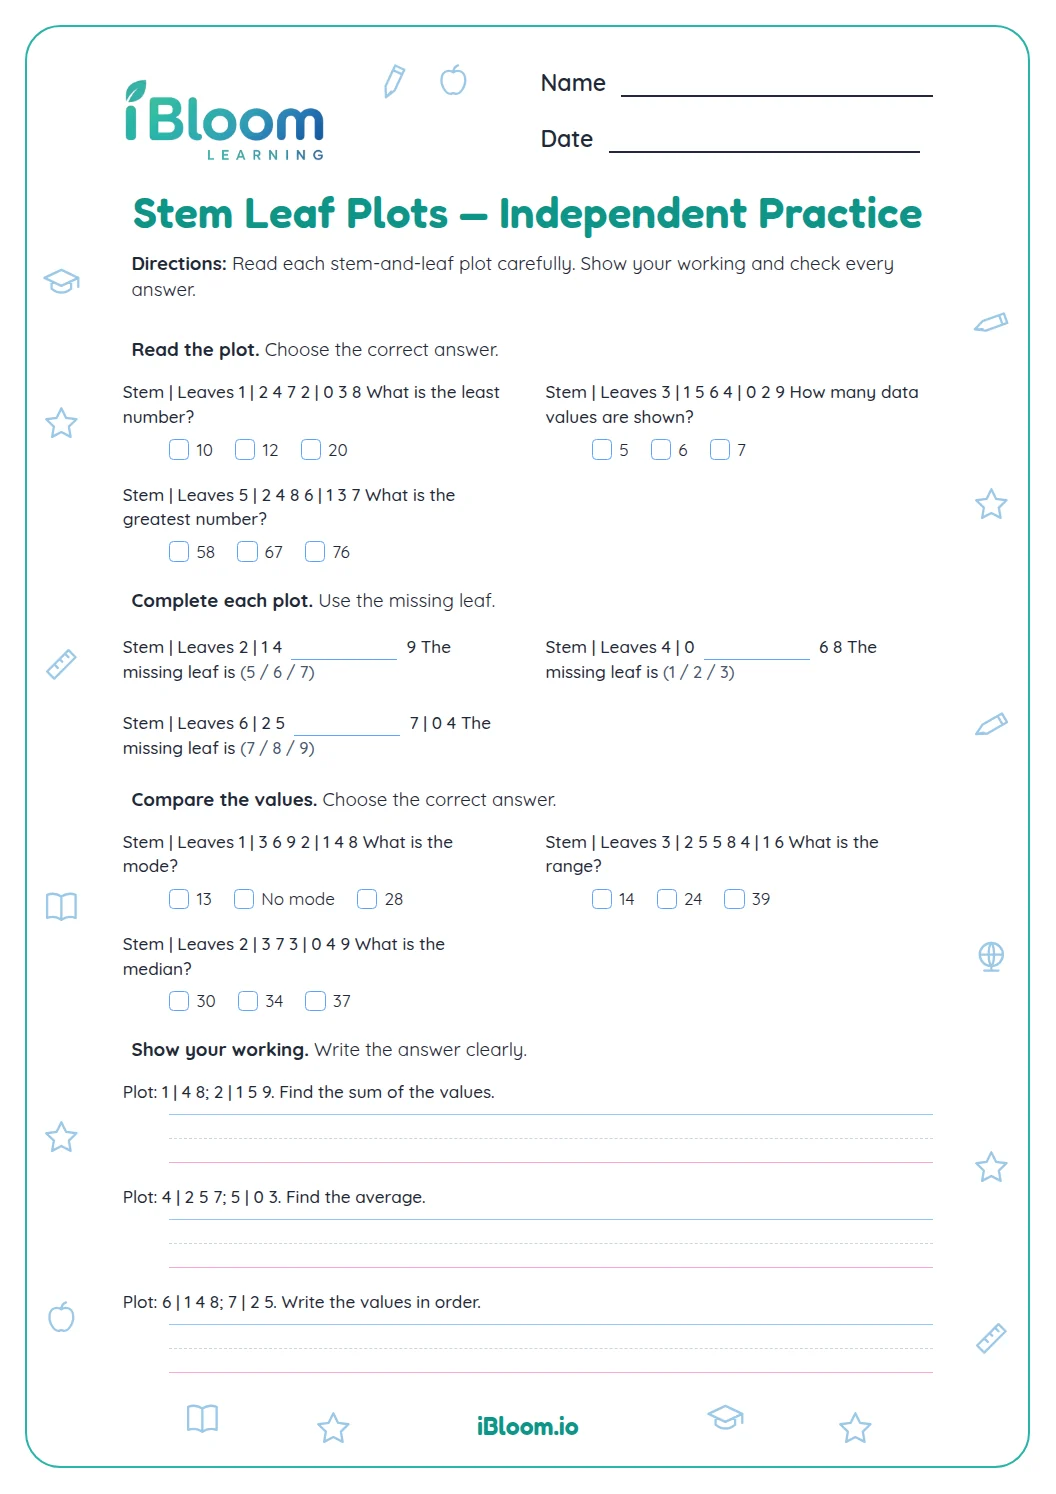
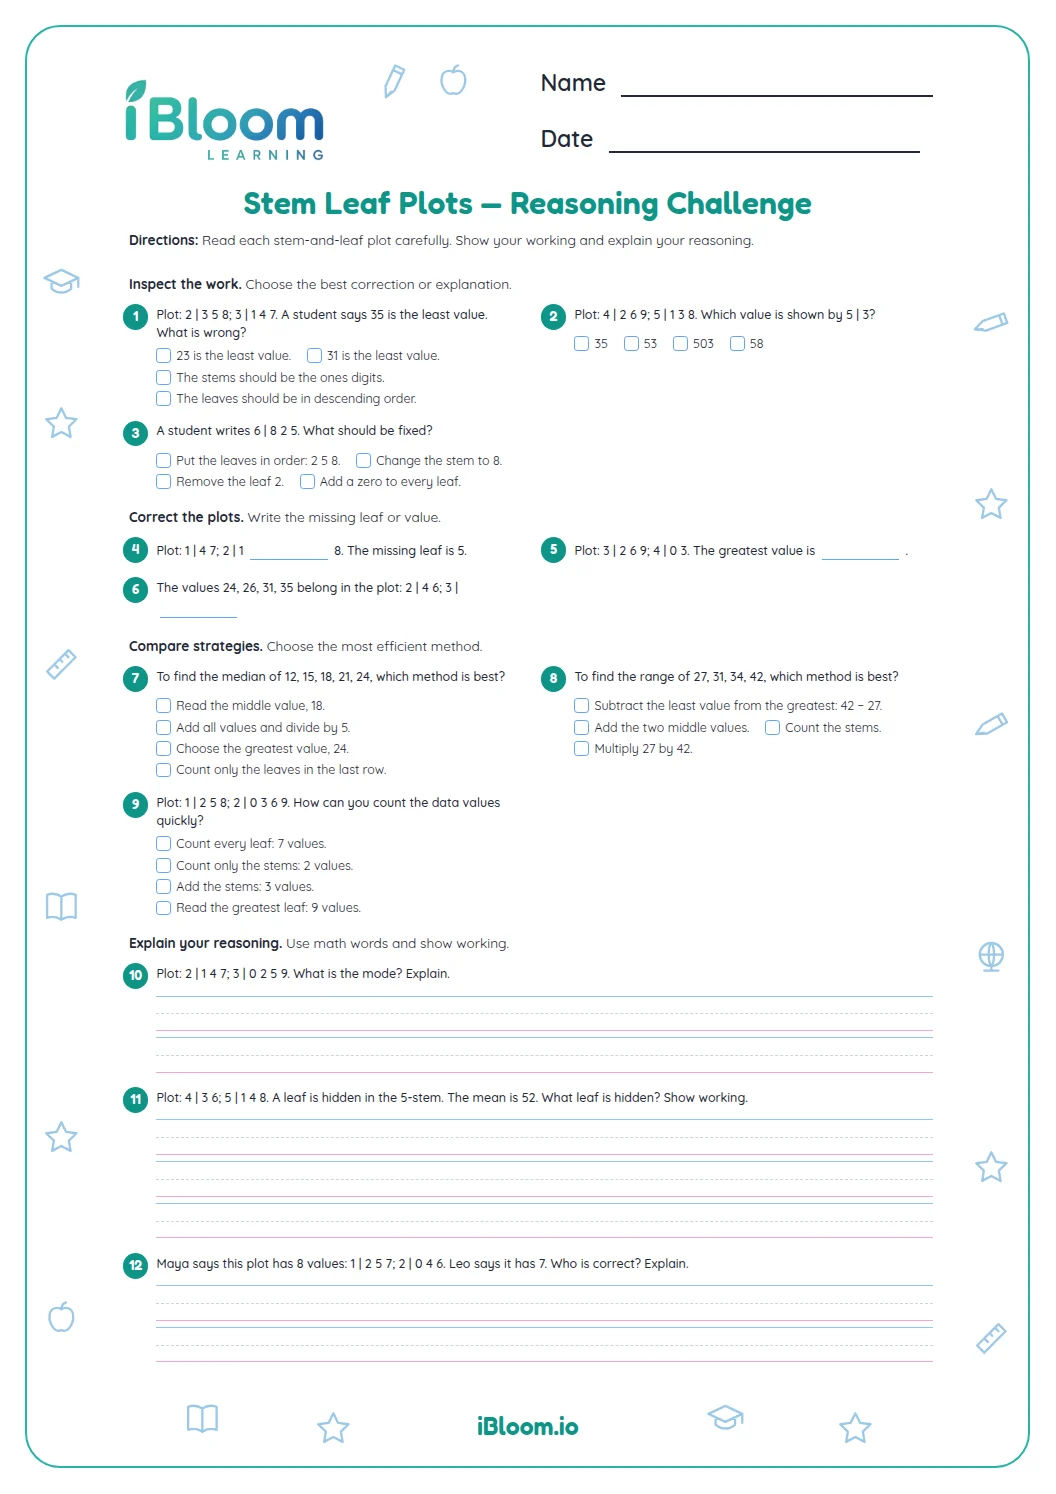
This Grade 4 worksheet gives students practice reading stem-and-leaf plots built from library, soccer, and plant-measurement data. Across 15 questions, students use the key to find values, count observations, and determine the median, mode, and range. The plot is redrawn as a clear two-column table so each stem and its ordered leaves can be read directly. An answer key is included.
How do you read a stem-and-leaf plot?
The key tells how to combine a stem and a leaf. In these plots, 1 | 2 means 12, so stem 1 with leaf 6 means 16. Read all leaves in a row with the same stem as separate data values.
- 1Library plot: stem 1 has leaves 0, 1, 3 and 6. The values are 10, 11, 13 and 16.
How can you find the median and range?
List the values in order. The median is the middle value, or the mean of the two middle values when there is an even number. Subtract the least value from the greatest to find the range.
- 1The library values are 2, 4, 5, 8, 10, 11, 13, 16. The two middle values are 8 and 10, so the median is 9.
What can a plot tell you about a real data set?
Questions use three contexts so students practice reading the display before deciding which calculation fits. Soccer data asks about a mode and a total; plant heights use centimeters and ask about a median and a threshold.
How to use this worksheet
- 1Read the key before combining any digits.
- 2Write each stem-and-leaf pair as a whole number.
- 3Count each leaf once when finding the number of observations.
- 4Order the values before finding the median.
- 5Subtract the least value from the greatest to find the range.
Common mistakes and quick fixes
The mistake
Reading 1 | 6 as 1.6.
The fix
Use the key: it says 1 | 2 represents 12, so 1 | 6 is 16.
The mistake
Using the number of stems as the data count.
The fix
Count every leaf; each leaf represents one observation.
The mistake
Subtracting the median from the greatest value for the range.
The fix
Range is greatest minus least.
What to practice next
Make more practice
Questions parents and teachers ask
What does a stem-and-leaf plot show?
It displays each data value by place value: the stem gives the tens digit and the leaf gives the ones digit. In the library plot, stem 1 with leaf 6 means 16 books. This keeps the original values visible while grouping values that share a tens digit.
What does the key 1 | 2 = 12 mean?
The key explains how to join a stem and leaf into one number. Stem 1 and leaf 2 make 12, while stem 1 and leaf 6 make 16. Use that relationship to read the library, soccer, and plant tables before counting, comparing, or summarizing their values.
How many questions are on this worksheet?
There are 15 questions in three parts. The plots describe library books, soccer goals, and plant heights. Students read values and counts, then find totals, medians, a mode, and ranges. The answer key follows the same order as the worksheet so each response can be checked against its data set.
How do students find the median?
First list the data values in order. With an odd number of values, the median is the single middle value; with an even number, find the number halfway between the two middle values. For the library data, 8 and 10 are in the middle, so the median is 9.
How is range different from median?
The median describes the center of an ordered set, while the range measures the distance from its least to its greatest value. For the library data, the range is 16 − 2 = 14. The median is 9, found from the two middle values rather than the endpoints.