

About this worksheet
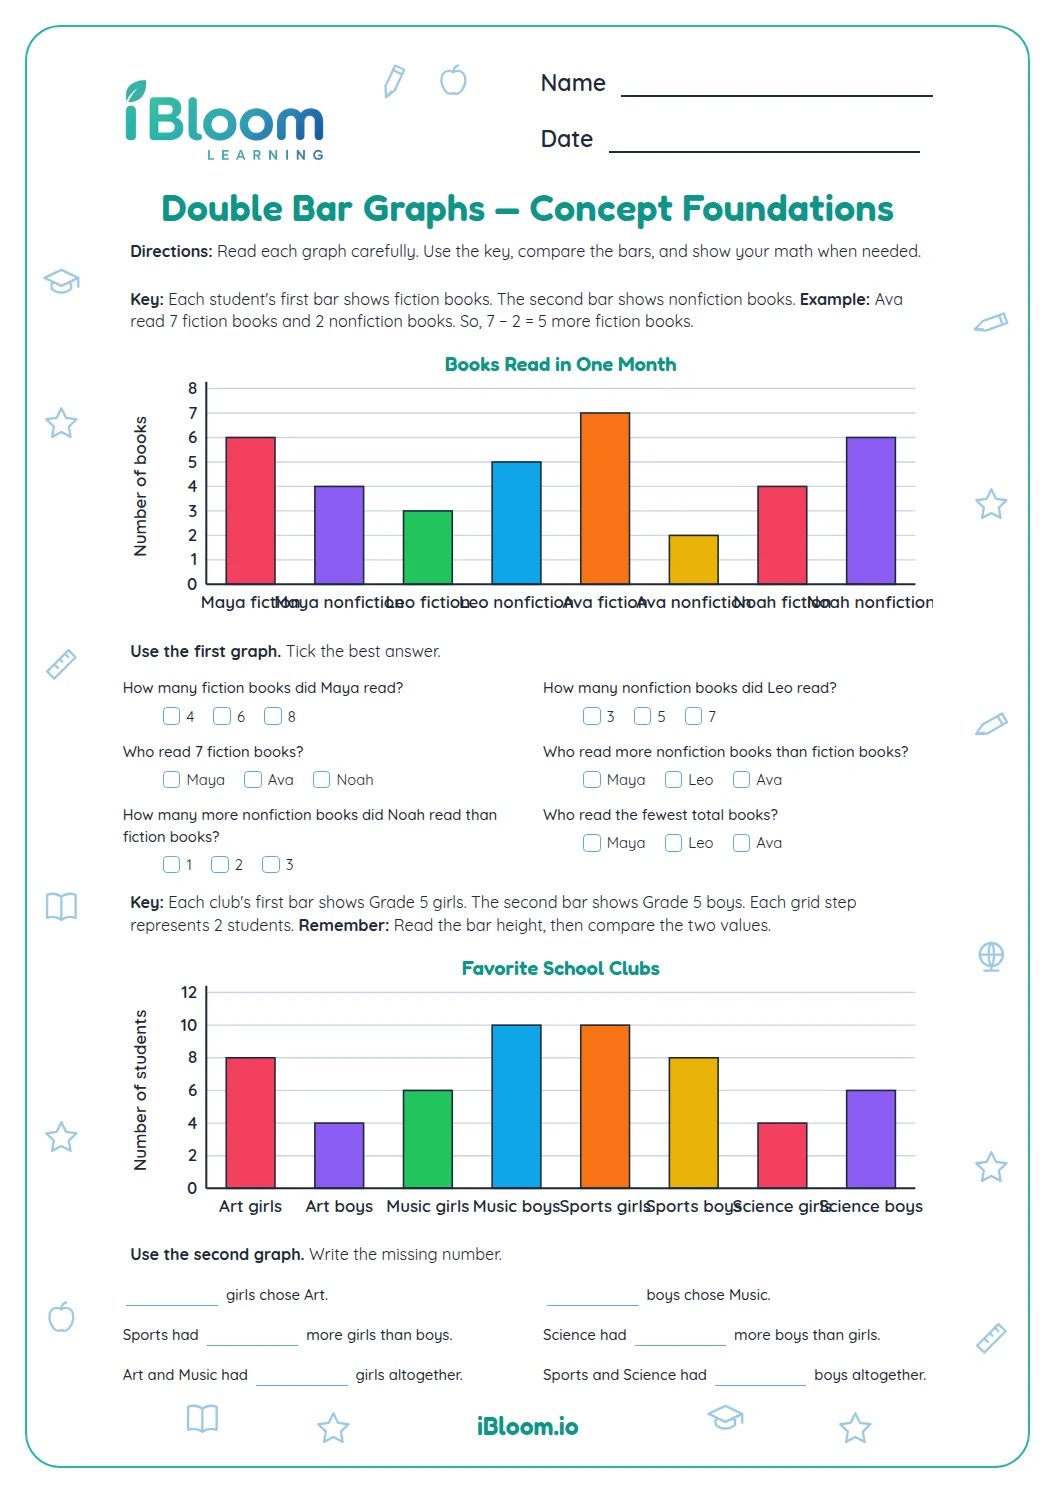
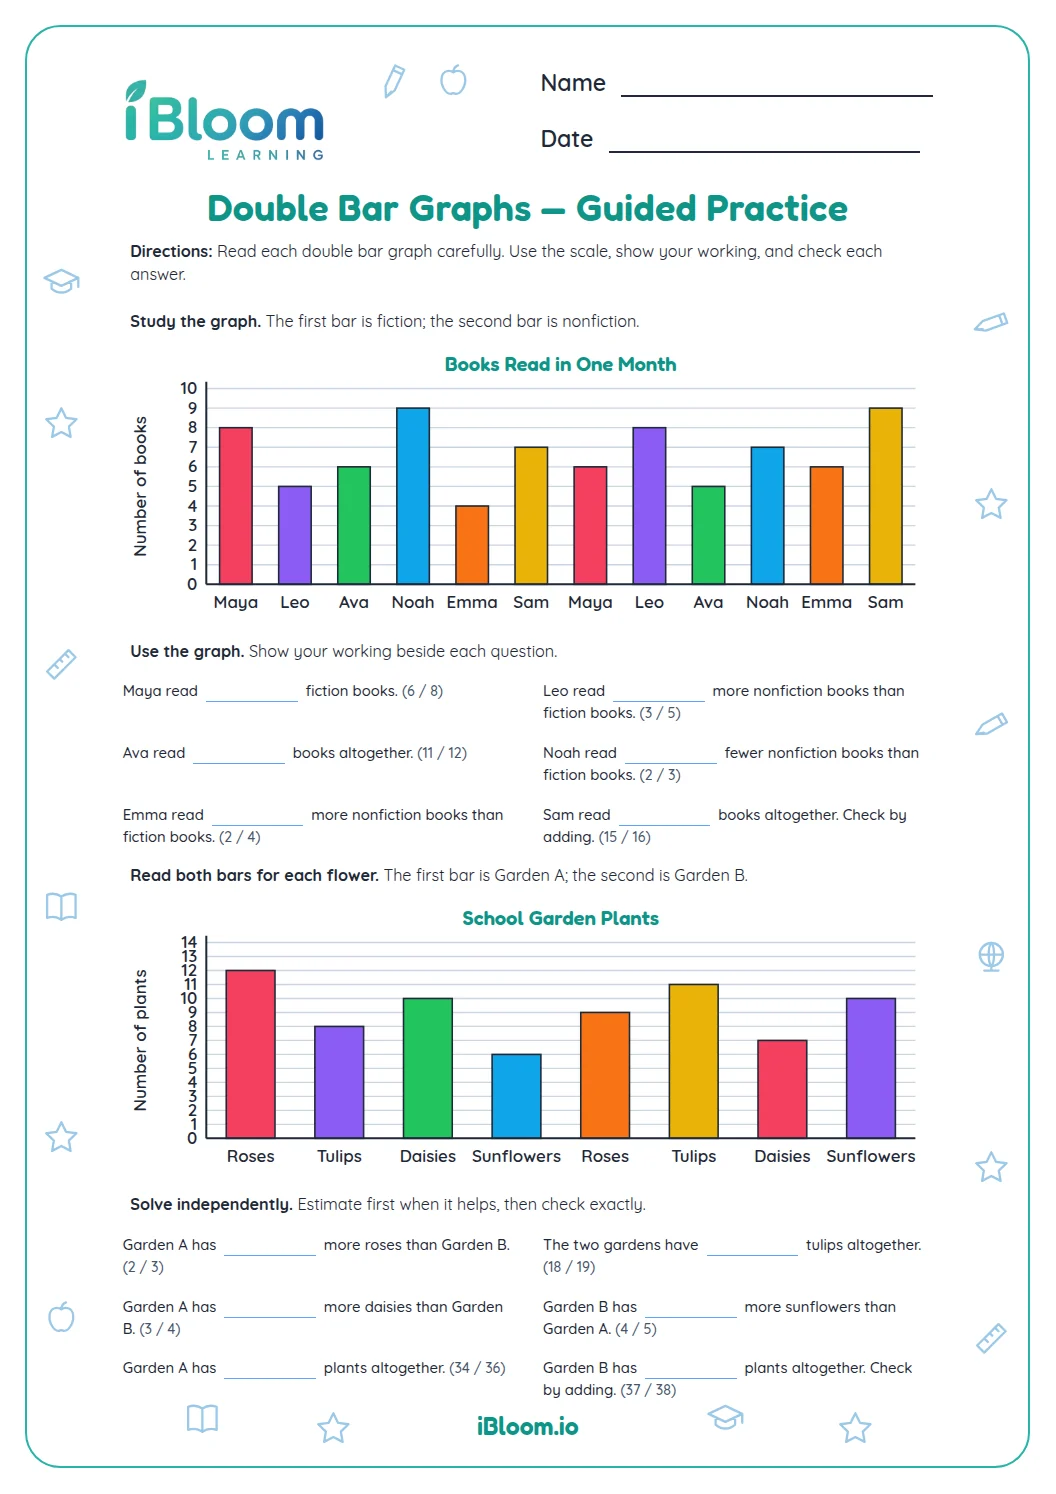
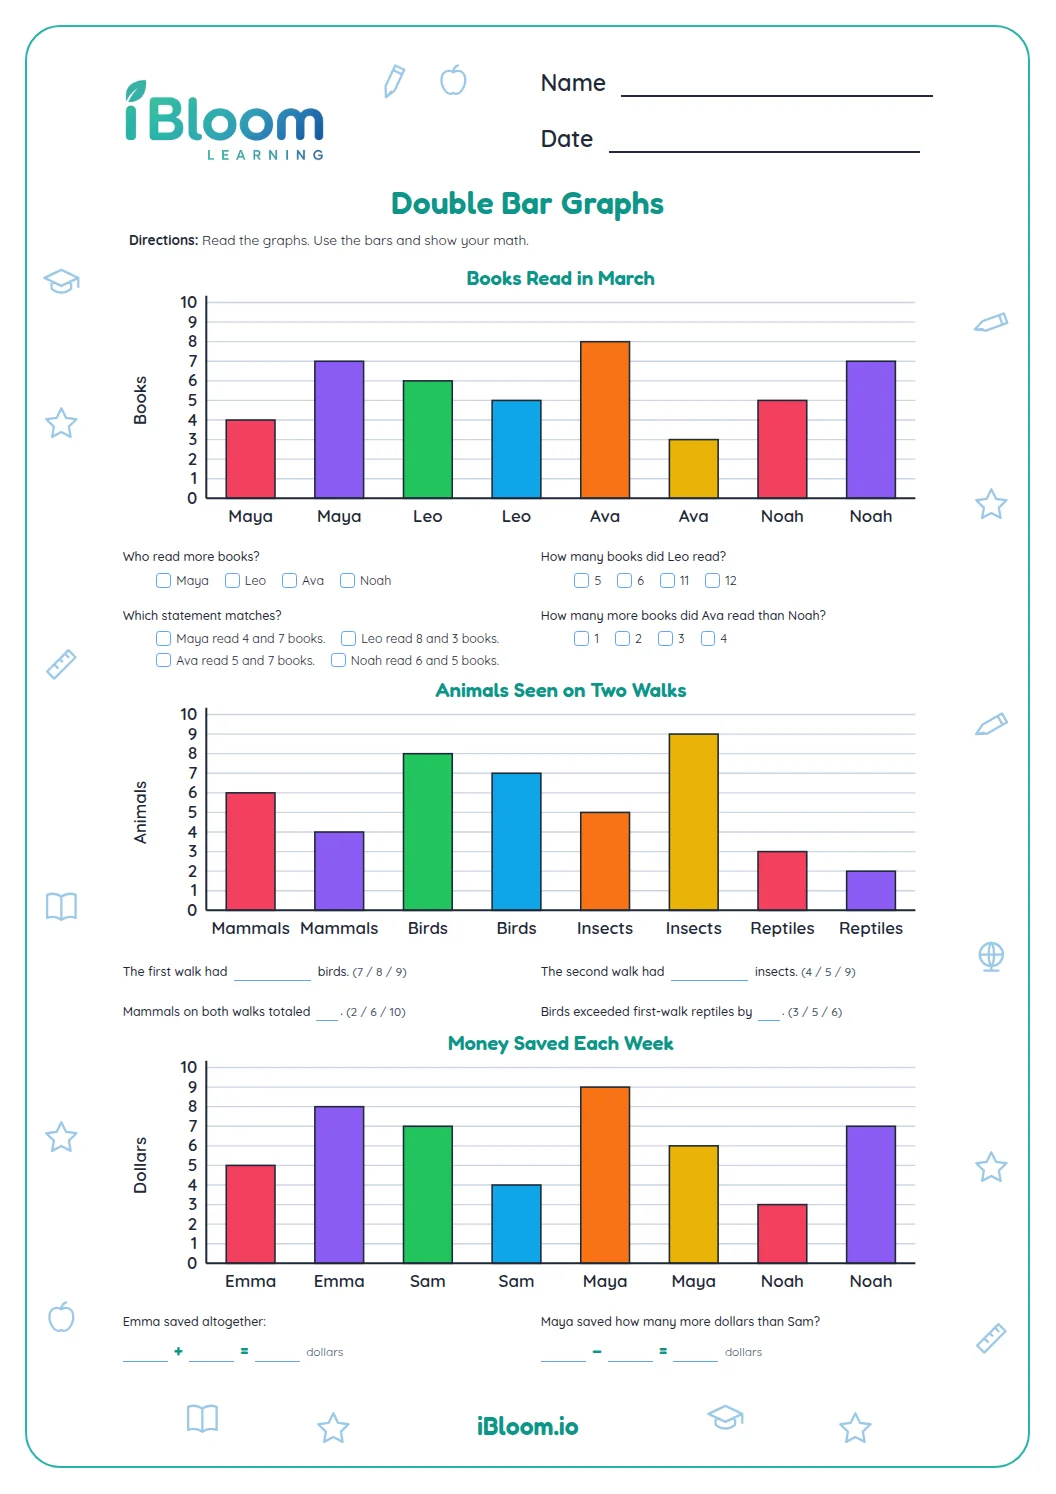
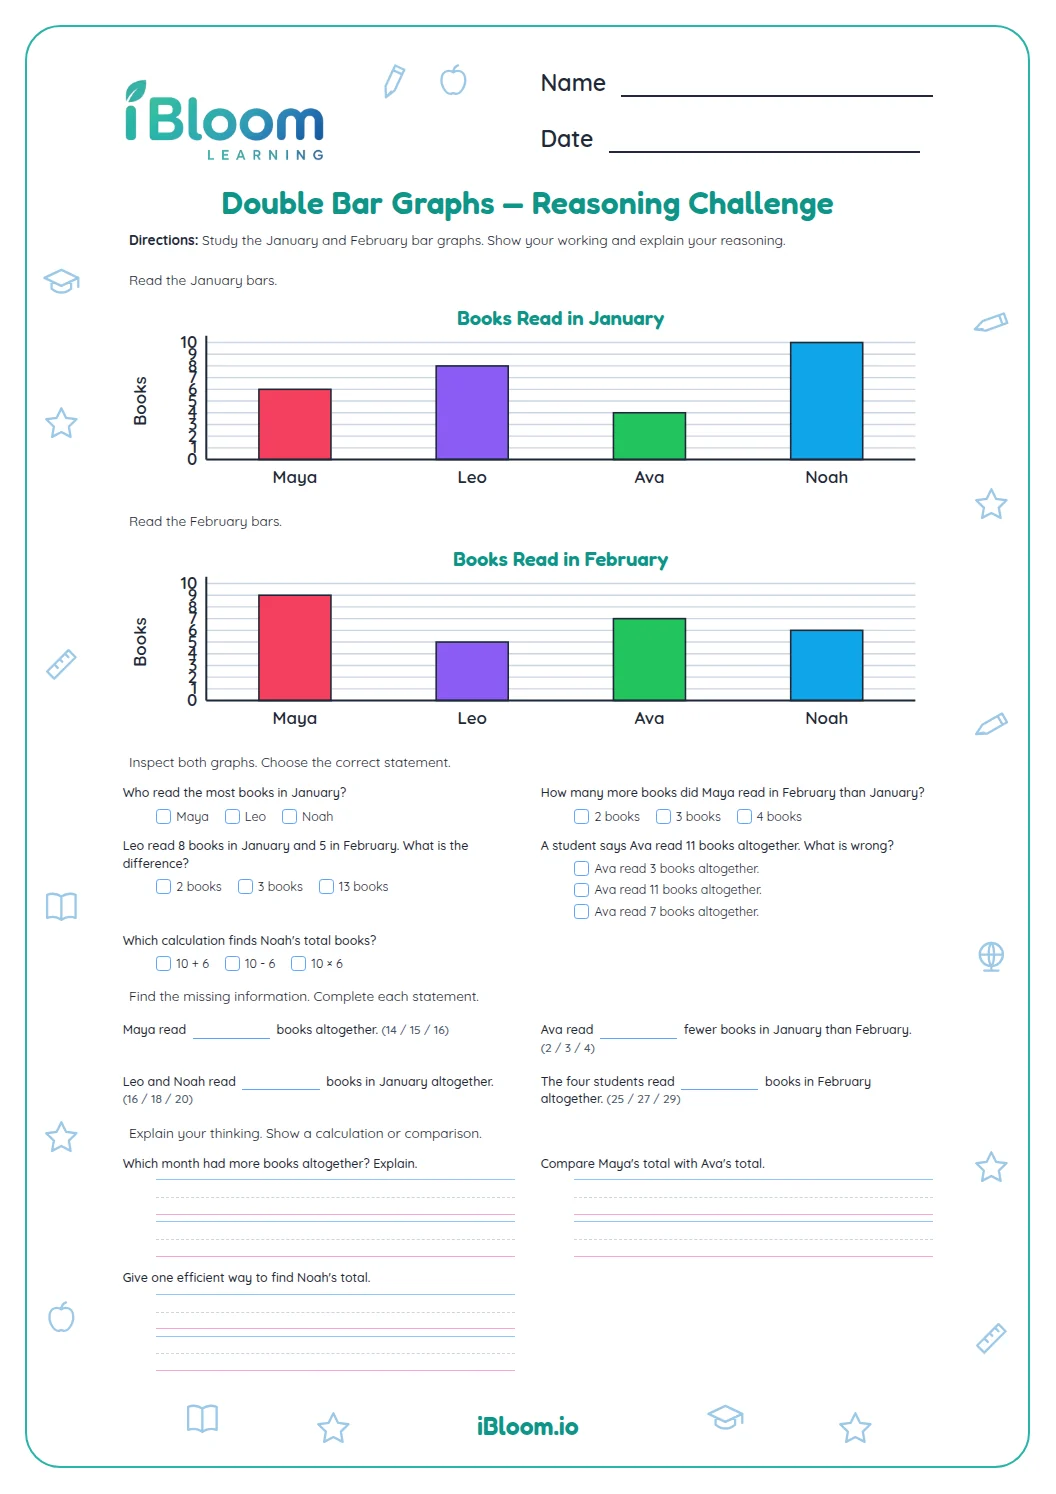
This Grade 5 printable practices double-bar comparisons with one paired bar graph showing books read by month for two teams. Fourteen questions ask children to read the bars, compare values, find totals and explain what each pair represents. Children use the same chart throughout, including for combined totals and differences. The key shows the selected answers.
How do paired bars help compare two groups?
Each month has one bar for each team. Find the two bars with the same month label before comparing. Question 2 asks about June: Team A read 4 books and Team B read 2, so Team A read 2 more.
- 1June, Team A: 4 books
- 2June, Team B: 2 books
- 34 − 2 = 2 books more for Team A
How can readers compare totals?
Add every monthly value for a team to find its total, then compare totals when asked. Keep the chart’s unit in mind: each bar counts books.
What does the worksheet include?
There are 14 multiple-choice questions in two parts. Children read the paired monthly book bars, compare the two teams, calculate monthly and group totals, and identify what a pair of bars represents.
How to use this worksheet
- 1Read the graph title and identify the group.
- 2Find the requested category on both graphs.
- 3Read each bar against the numbered scale.
- 4Subtract to compare or add to find a total.
- 5Write the unit in your answer when it is useful.
Common mistakes and quick fixes
The mistake
Reading a Team B bar as Team A.
The fix
Check the graph title or group label before recording a value.
The mistake
Subtracting in the wrong order.
The fix
Say which group should have more, then subtract the smaller value from the larger.
The mistake
Adding only one category for the total.
The fix
Add every category in that group, then compare totals.
What to practice next
Make more practice
Questions parents and teachers ask
Is this a traditional double bar graph?
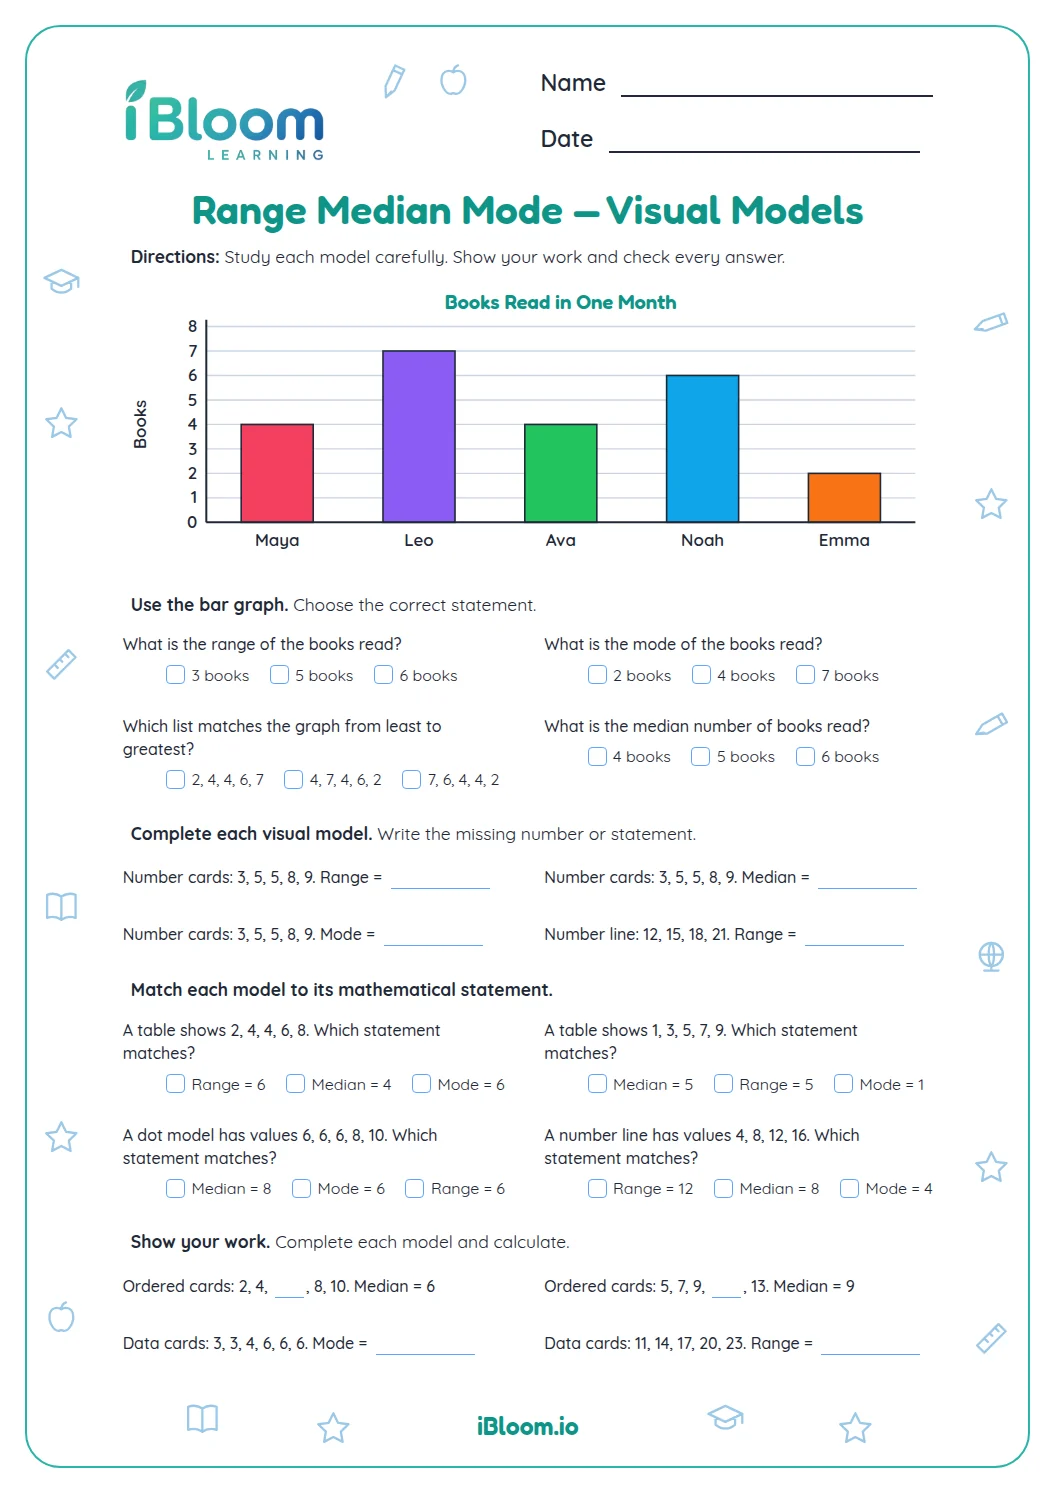
The worksheet uses one graph with a bar for each team in each month, labeled June A, June B and so on. The paired values sit together so children can compare the same month across teams. All 14 questions use the monthly book data or ask how paired bars work.
What does the combined book total mean?
Add the monthly values for both teams. Team A read 15 books and Team B read 12, so the combined total is 27 books. Question 5 asks children to choose that total after reading the team values in the paired monthly graph.
How do I find how many more one team has?
Read the two values for the same category, then subtract the smaller from the larger. For June, Team A read 4 books and Team B read 2, so the difference is 2 books. Check the group labels before deciding which value belongs to each team.
What kinds of situations appear?
This worksheet focuses on one set of real-world data: books read by two teams over three months. Children compare the paired bars, find team totals and calculate differences. The graph labels and scale provide the values needed for each question.
Is an answer key included?
Yes. The separate key marks the correct choice for all 14 questions, including the greatest combined monthly count, group comparisons, totals and the purpose of paired bars. Children can use it to check both graph reading and arithmetic.