
About this worksheet
This Grade 5 worksheet introduces mean as the equal share of a data set. Students read a number-line model, calculate totals and means, solve missing-value questions, and reason about adding or removing a value. The answer key is included. Short data sets use books read, plant heights, and scores.
How does the number line show a mean?
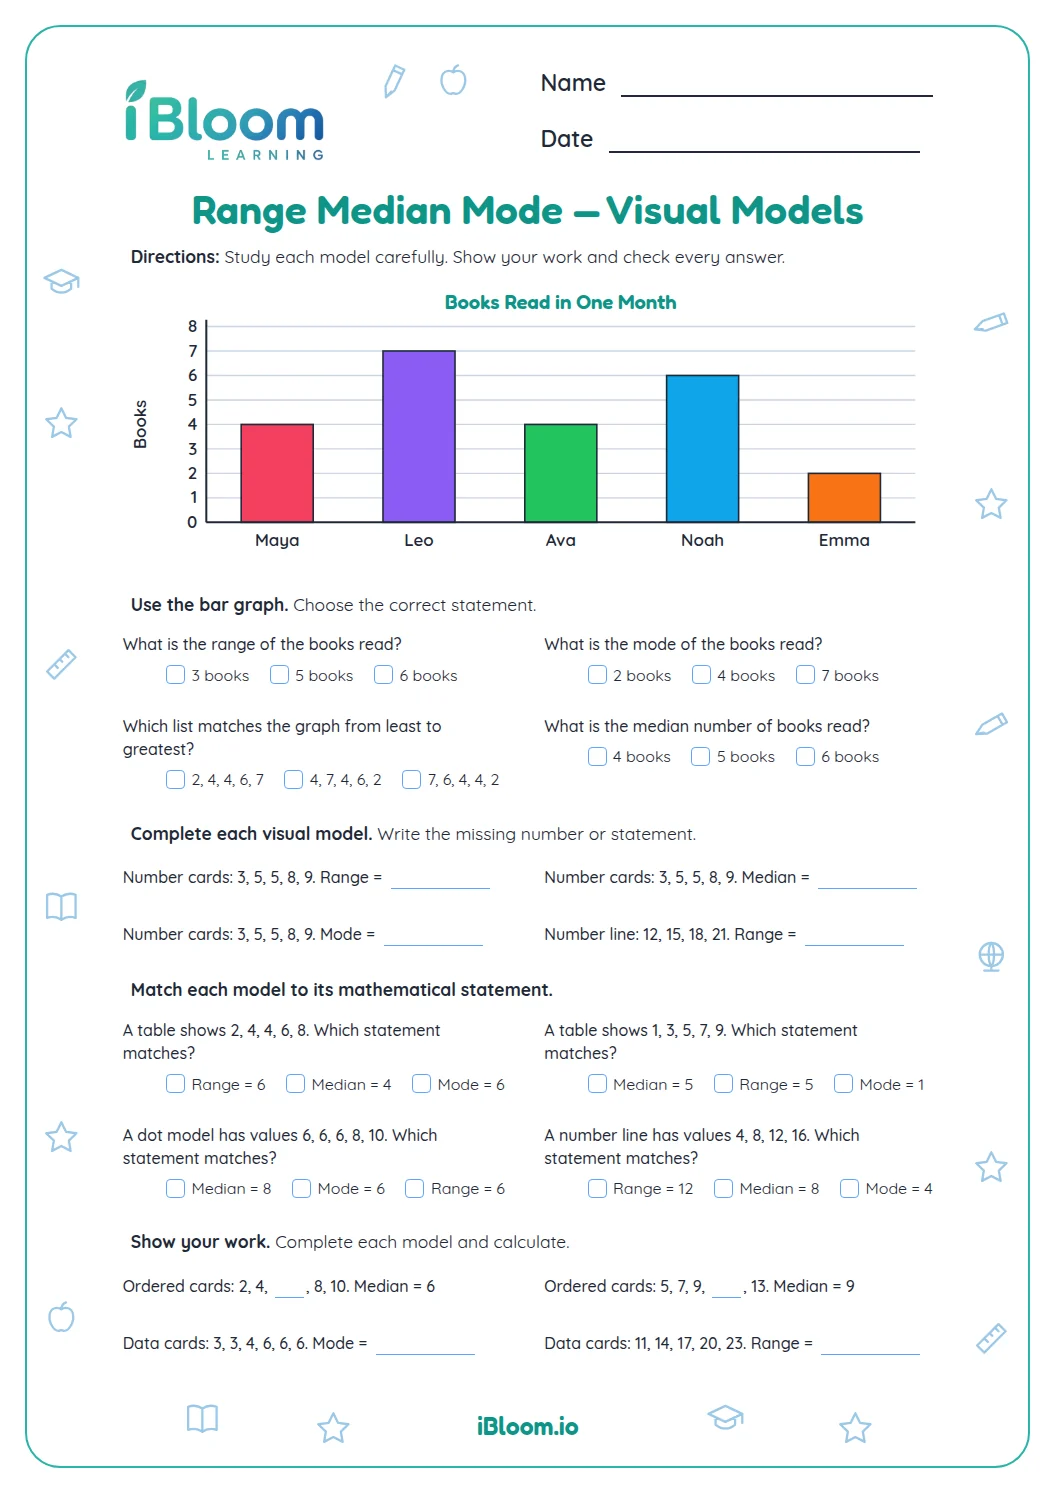
The graph shows 2, 3, 4, 5, and 6 books. Their total is 20 across 5 readers, so the mean is 4 books.
Question 1 asks for that mean from the graph. Questions 2 and 3 check the count and total before later questions apply the same reasoning.
- 12 + 3 + 4 + 5 + 6 = 20
- 220 ÷ 5 = 4
- 3Mean: 4 books
How can a mean reveal a missing value?
Multiply the mean by the number of values to find the total, then subtract the known values. In question 11, four values with a mean of 5 must total 20. Since 3 + 5 + 6 = 14, the missing value is 6.
What happens when a value is added or removed?
Adding a value equal to the mean leaves the mean unchanged. Question 4 adds a 4 to values whose mean is 4. For plant heights 4, 5, 6, 6, 7, and 8, the mean is 6; removing 8 leaves 28 across five plants, or 5.6 cm.
How to use this worksheet at home or in class
- 1Read the number-line model and name the marked balance point.
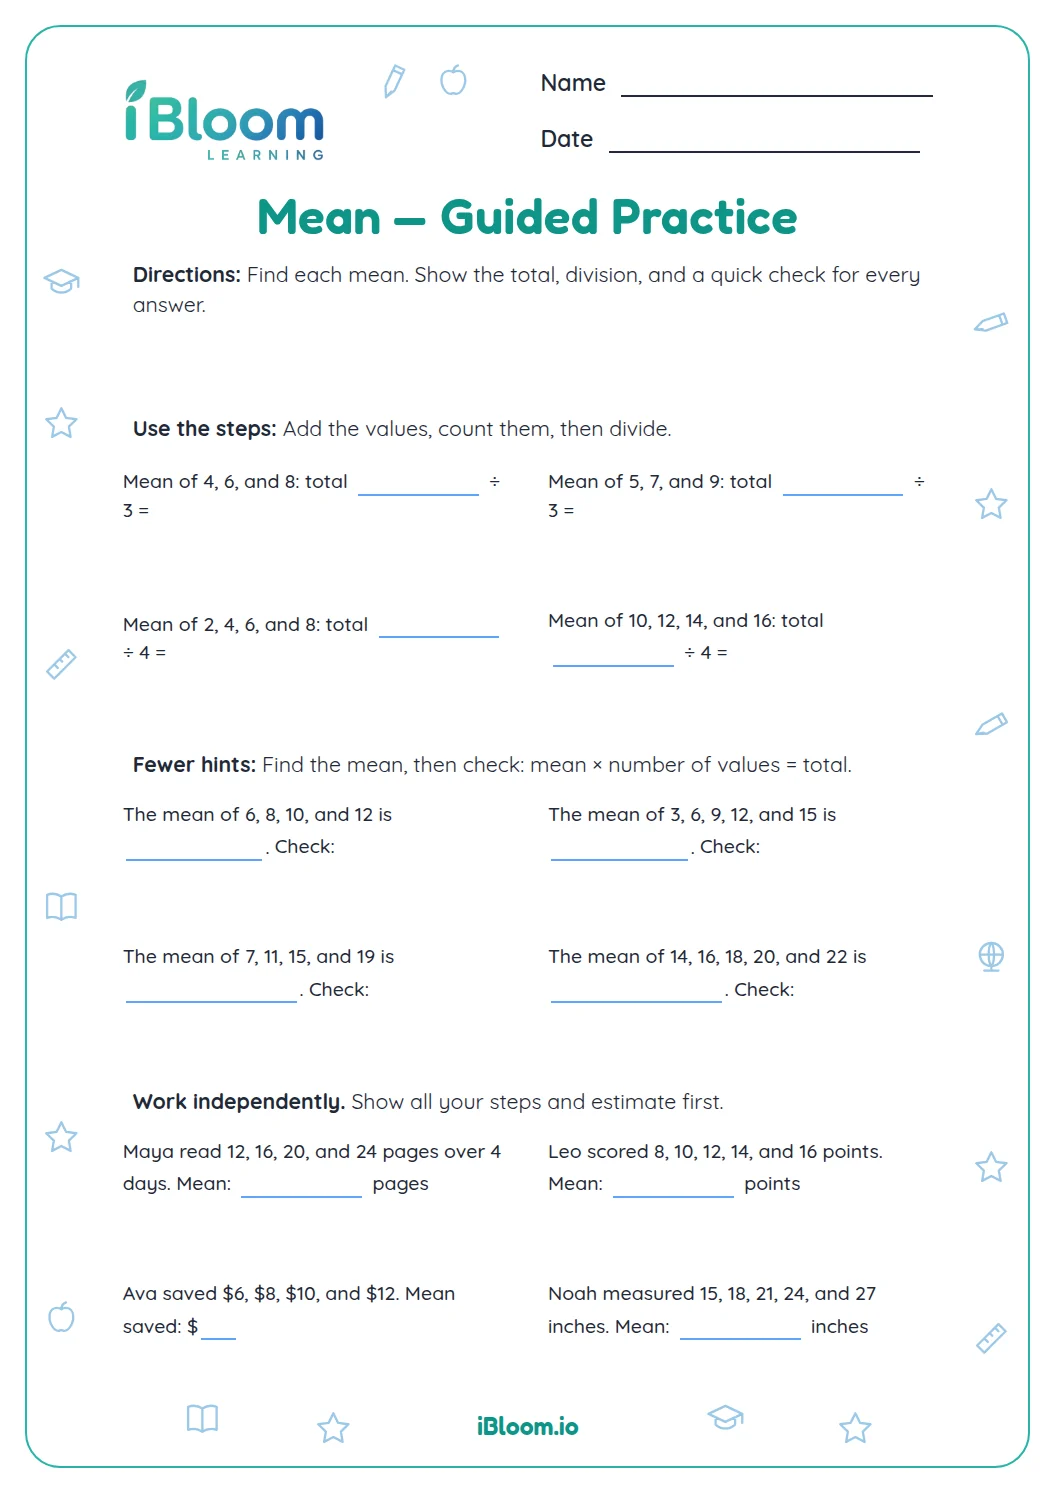
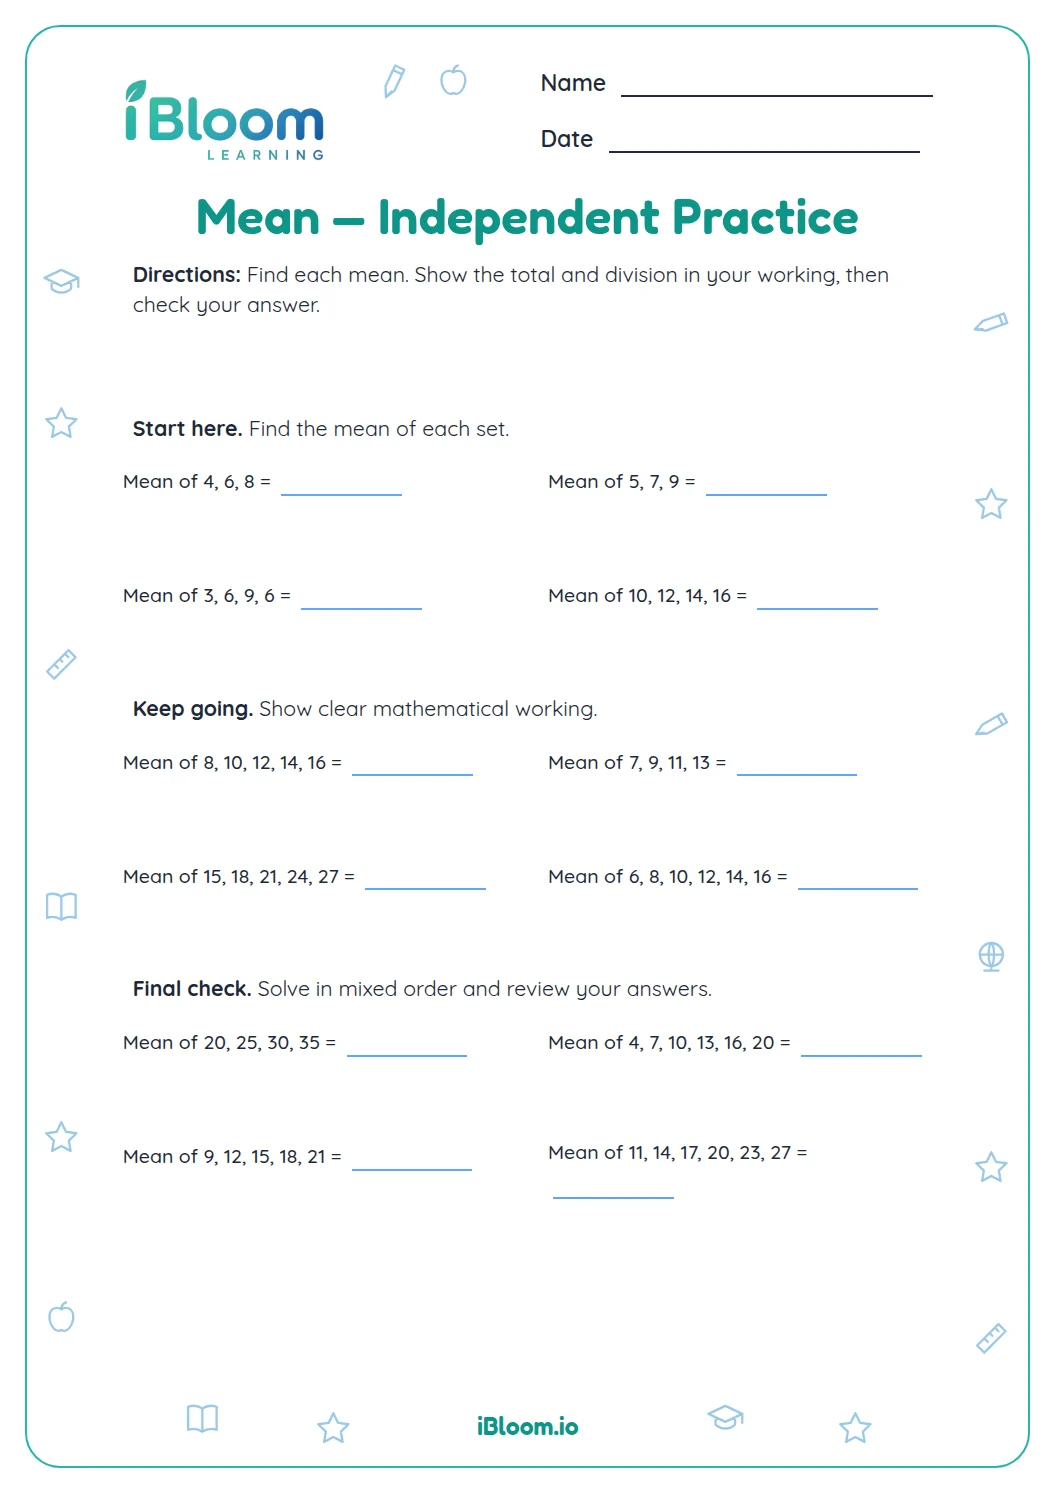
- 2Add the values and count how many are in the set.
- 3Divide the total by the count to find the mean.
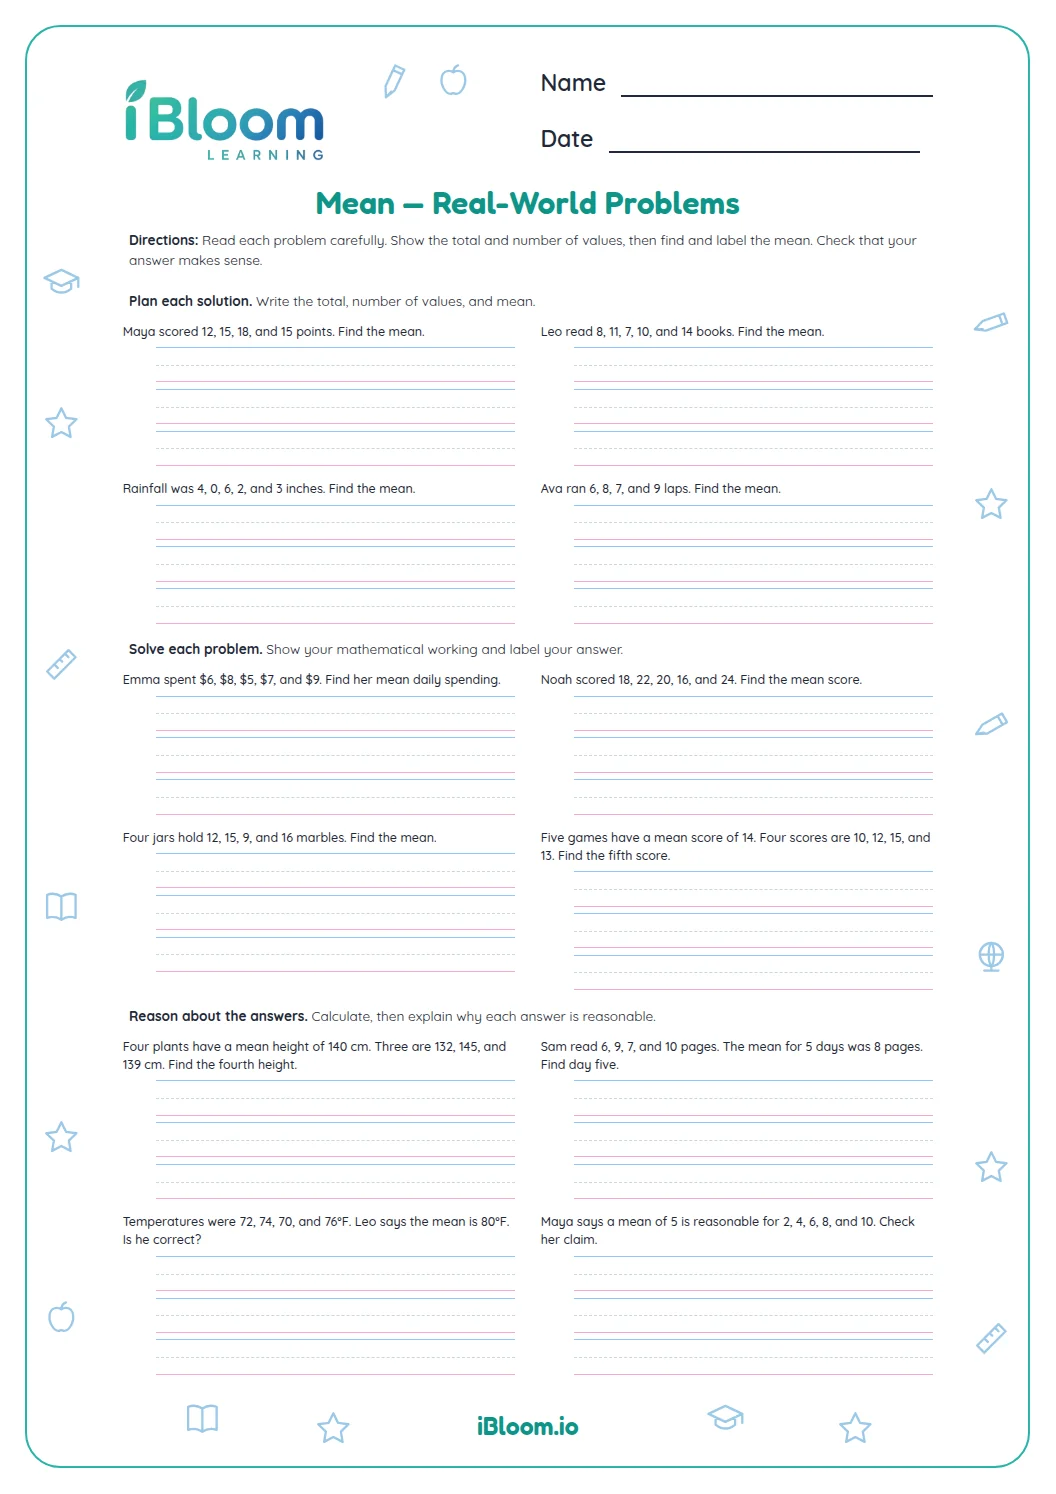
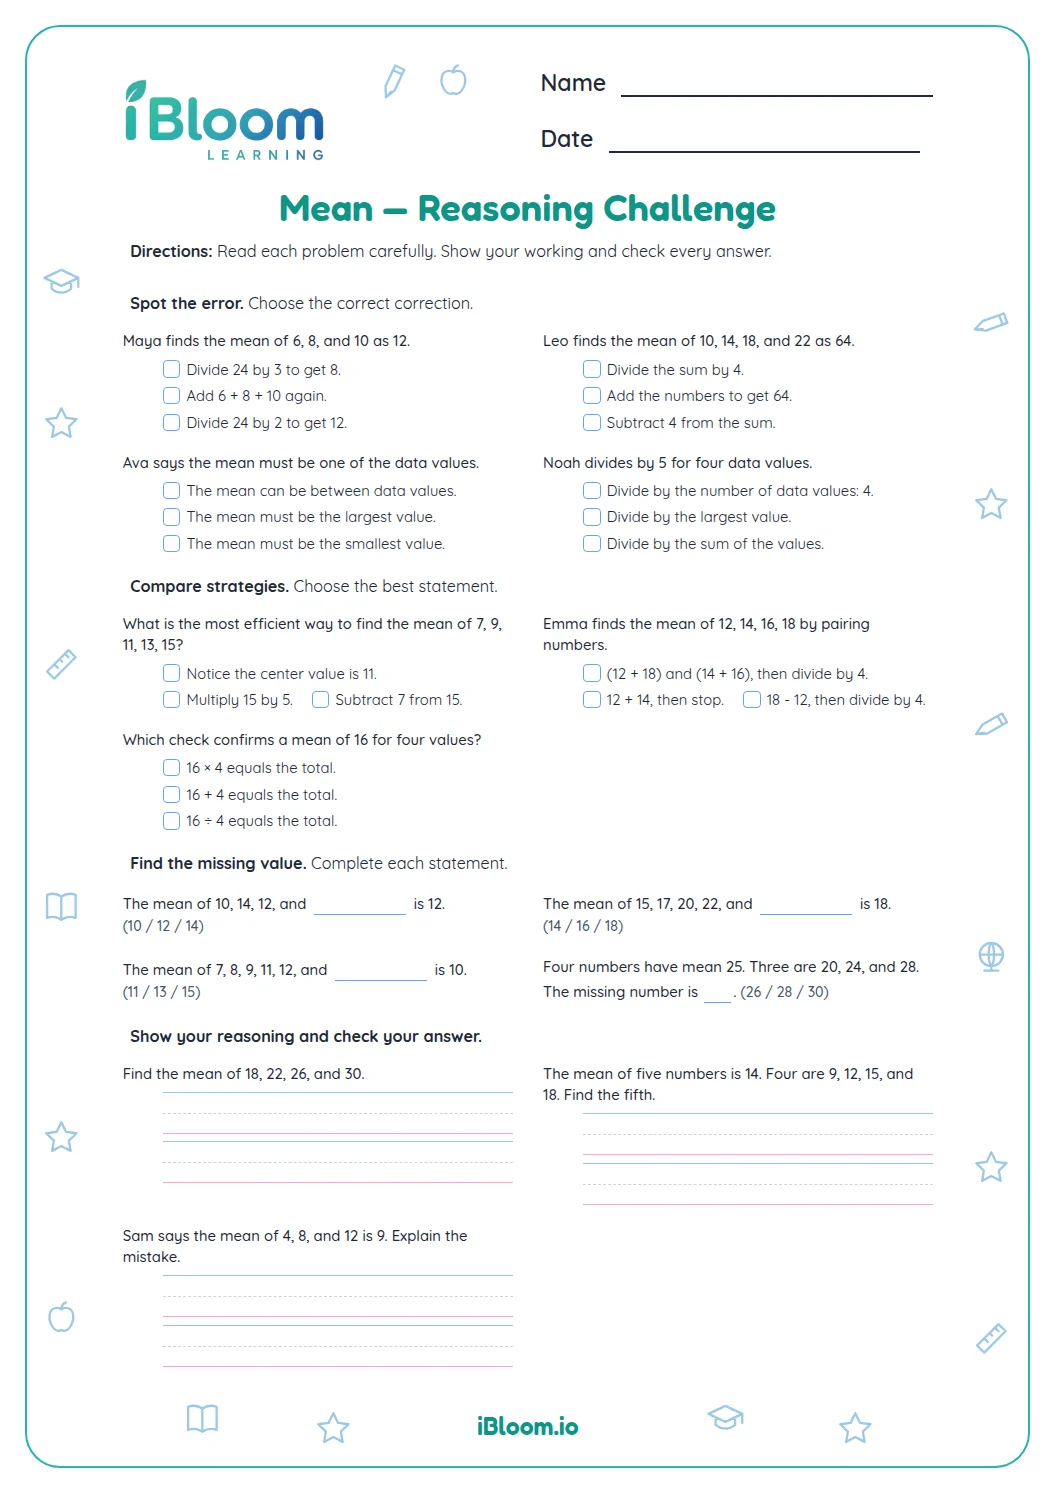
- 4For a missing value, find the required total with mean × count.
- 5Check whether adding or removing a value changes the equal share.
Common mistakes and quick fixes
The mistake
Dividing by the value of the largest number instead of the number of data values.
The fix
Count the values first; that count is the divisor.
The mistake
Leaving out a repeated value when finding the total.
The fix
Write every observation in order before adding.
The mistake
Assuming any new value leaves the mean unchanged.
The fix
The mean stays the same only when the added value equals the current mean.
What to practice next
Make more practice
Questions parents and teachers ask
What does mean tell me?
The mean is the equal share each value would have if the total were split evenly. Add the values and divide by their count. This worksheet uses books read, plant heights, and scores to help children connect that calculation with a data set.
How does the number line help?
The graph gives five values: 2, 3, 4, 5, and 6 books. Add them to get 20, then divide by 5 readers. The mean is 4 books. The bar heights make each value easy to read before calculating.
What is the mean of 2, 3, 4, 5, and 6?
The mean is 4. The five bar heights are 2, 3, 4, 5, and 6, which add to 20. Divide by the five readers to get 4 books. The first question asks students to use the graph to find that equal share.
How can I solve a missing-value mean question?
The mean is 4. The five values add to 20, and 20 ÷ 5 = 4. The first question asks students to find the equal share for the five readers in the bar graph. They can check by multiplying 4 by 5.
Does adding the mean change the mean?
No. If a new value equals the current mean, the mean stays the same because the total and count increase in balance. Question 4 adds another 4 to a set with mean 4, so its new mean is still 4.
Is an answer key included?
Yes. The key gives the result for all 14 questions, including graph reading, data totals, means, and missing values. The worksheet uses three pages and the answer key uses three pages, so families can print the student pages and key together.