
About this worksheet
This Grade 5 worksheet uses a bar graph, two line plots, and short numerical data sets to practice mean, median, mode, and observation counts. Learners answer 14 questions, including a set with no repeated value, and use a separate answer key to check their work.
What can you read from the graph and plots?
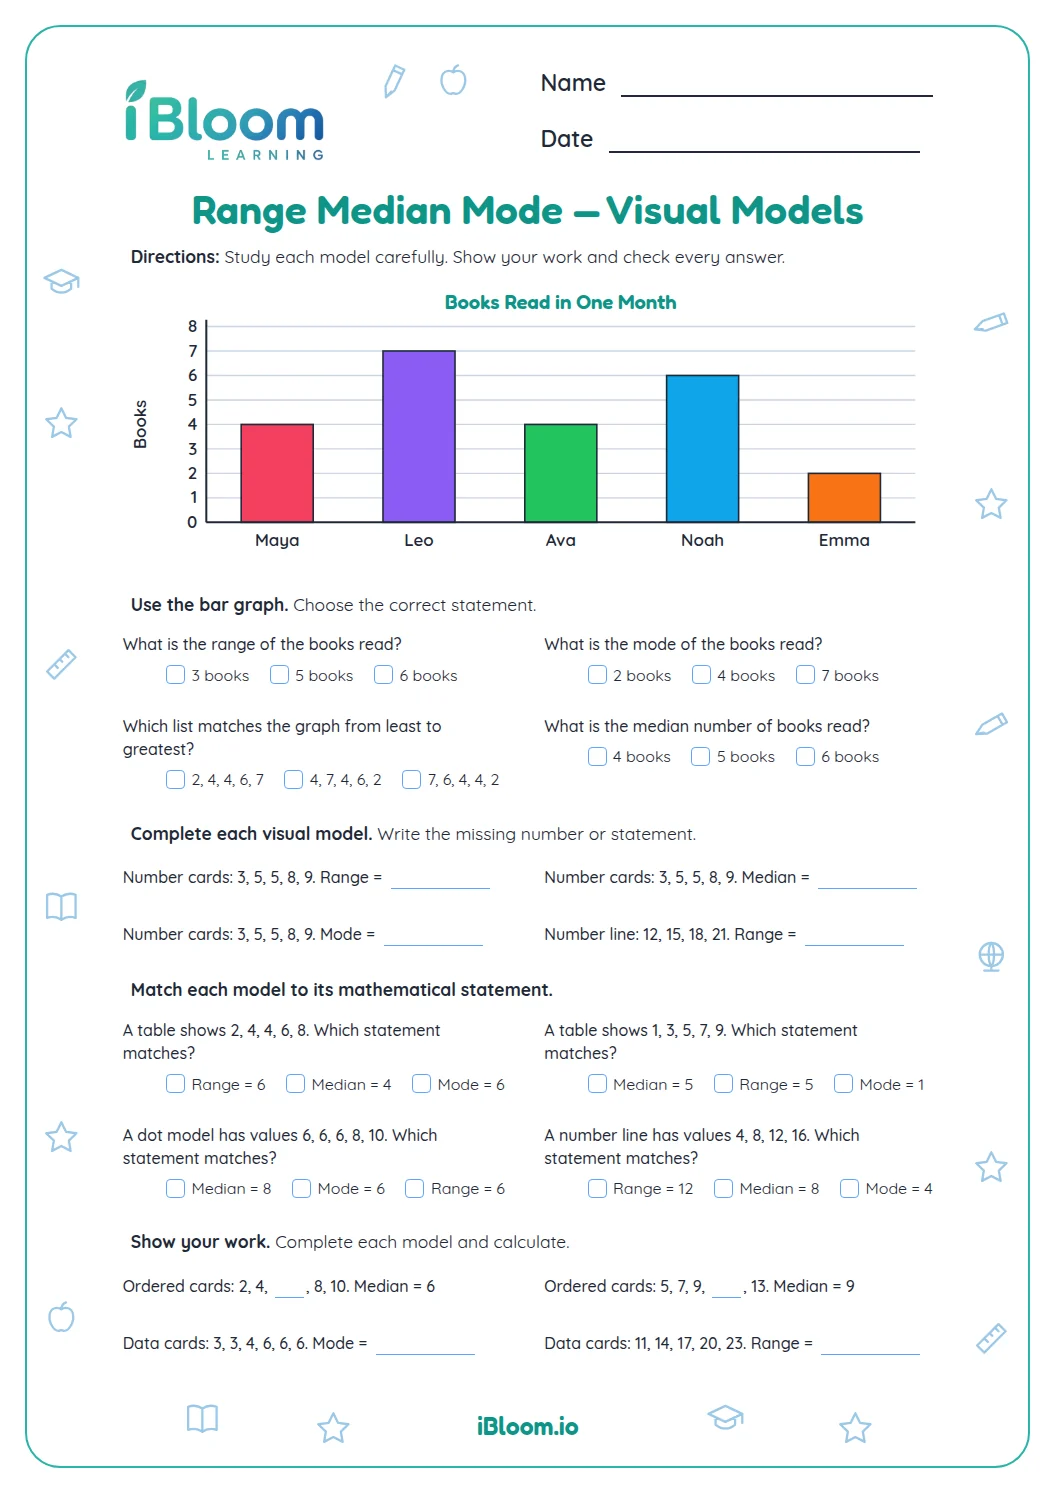
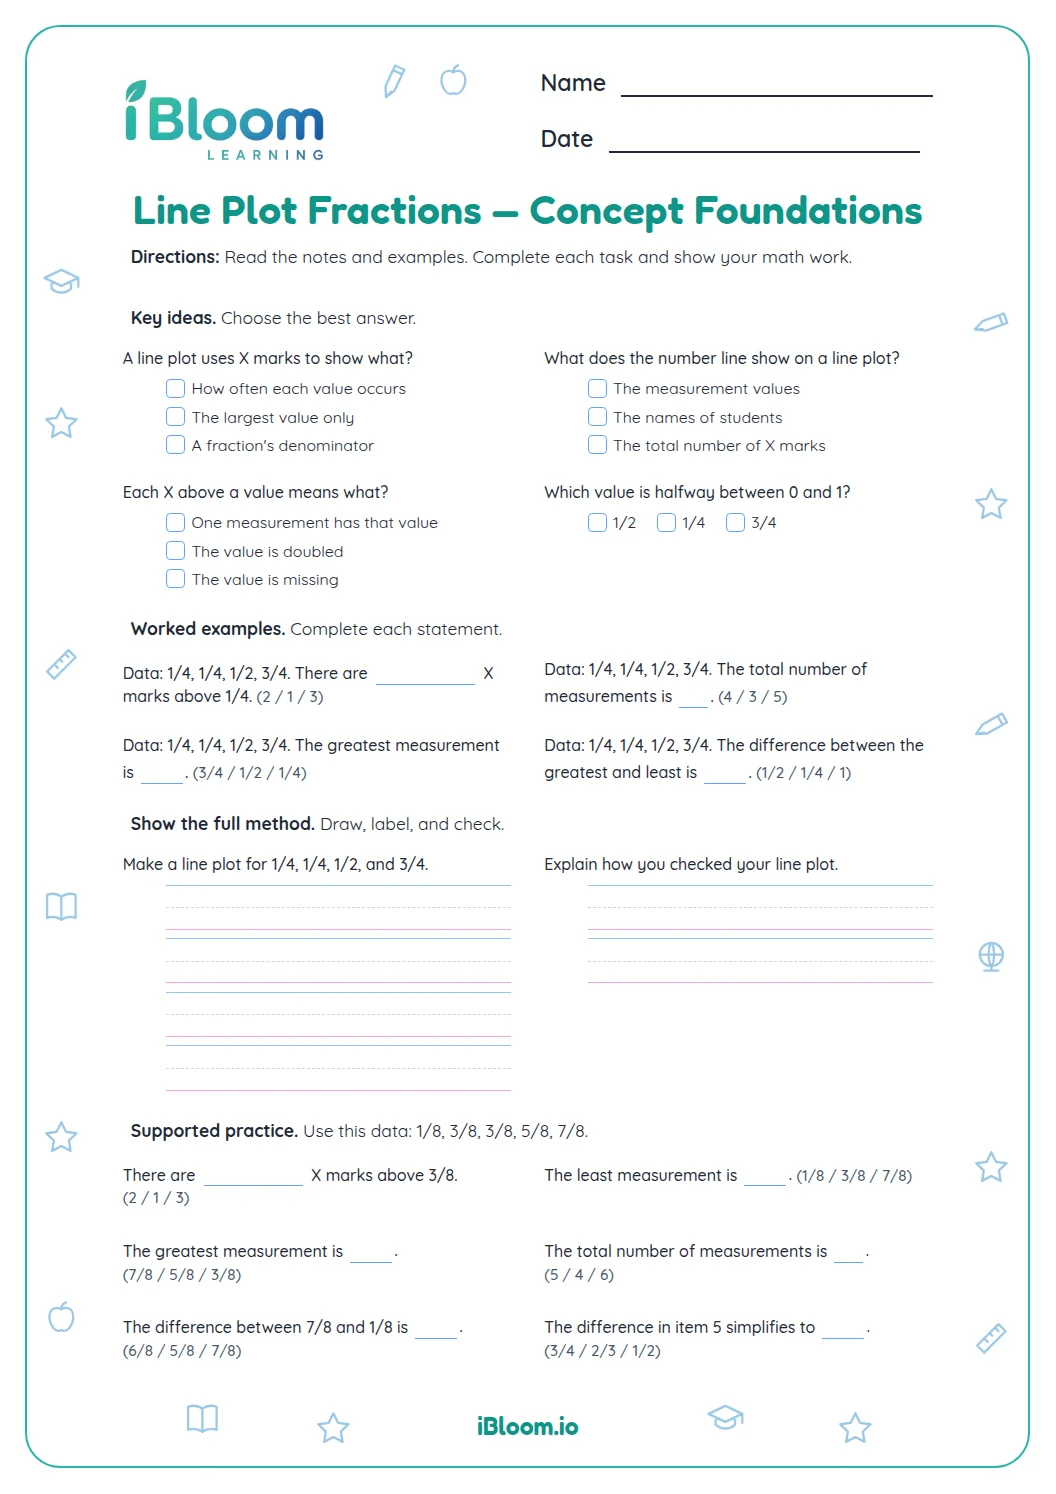
A data set is a group of numerical observations. The first set appears in a bar graph, and two more appear as line plots; the final sets are listed in the questions. Repeated marks represent separate observations and each one counts.
- 1Books: 1, 2, 3, 3, 6
- 2There are 5 observations
- 3Total: 1 + 2 + 3 + 3 + 6 = 15
How is the mean calculated?
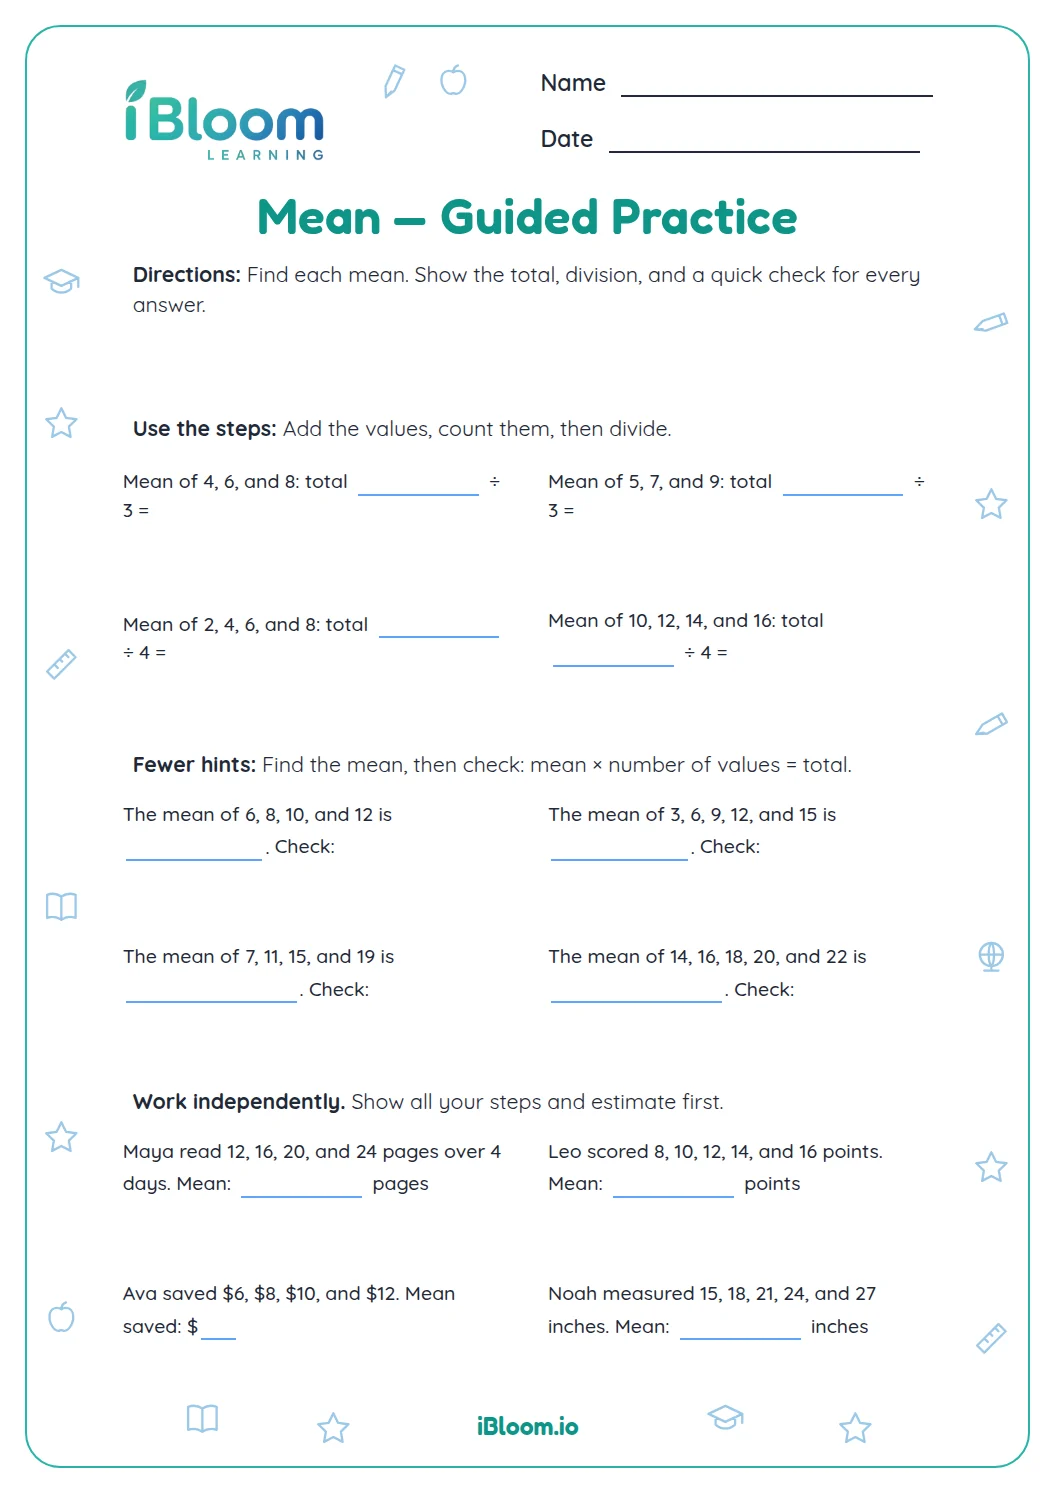
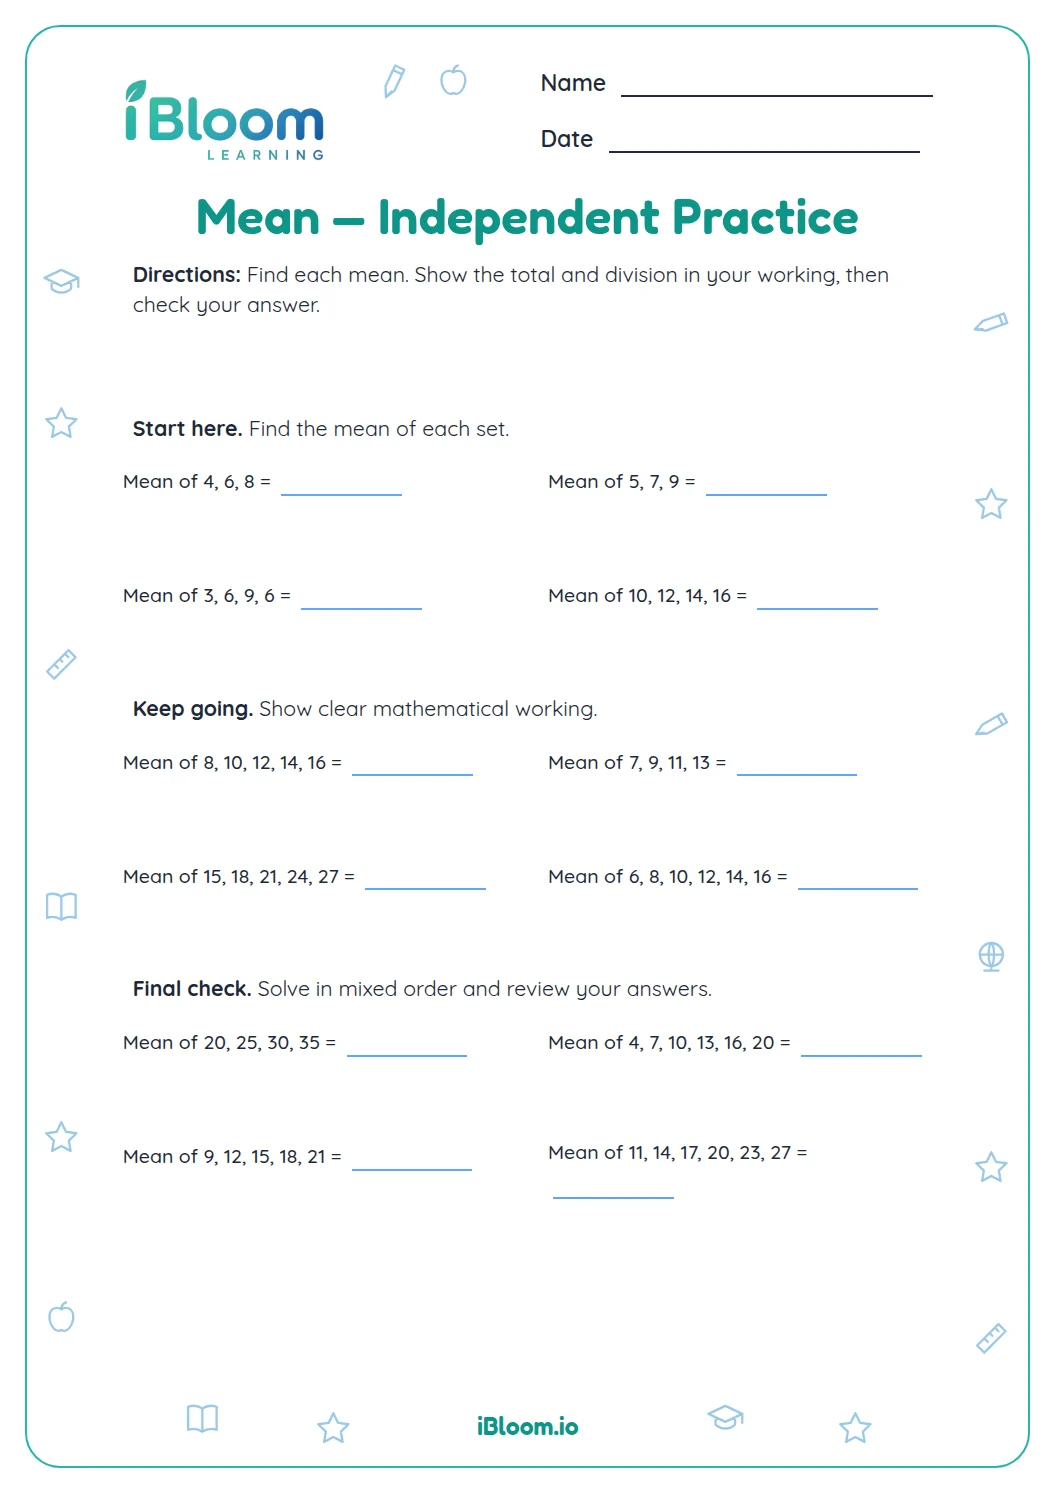
Add all observations, counting repeats, and divide by the number of observations. For Set A, 8 divided by 4 is 2. The mean is a balance point for the values, so a result can fall between two whole numbers.
How do median and mode describe a set?
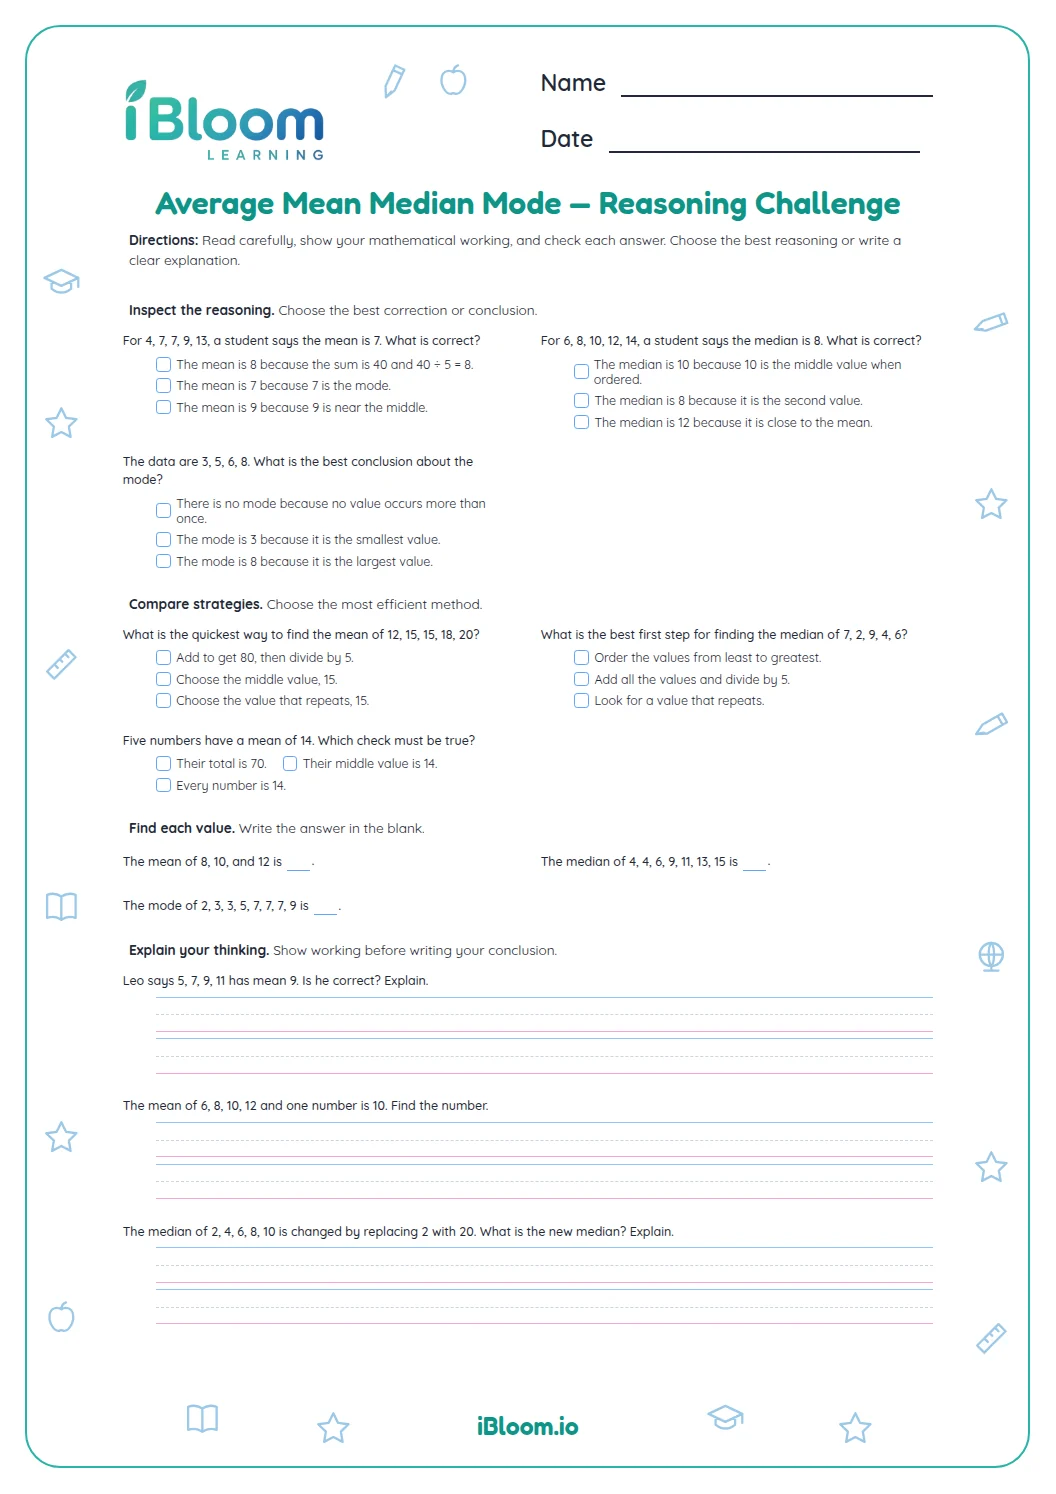
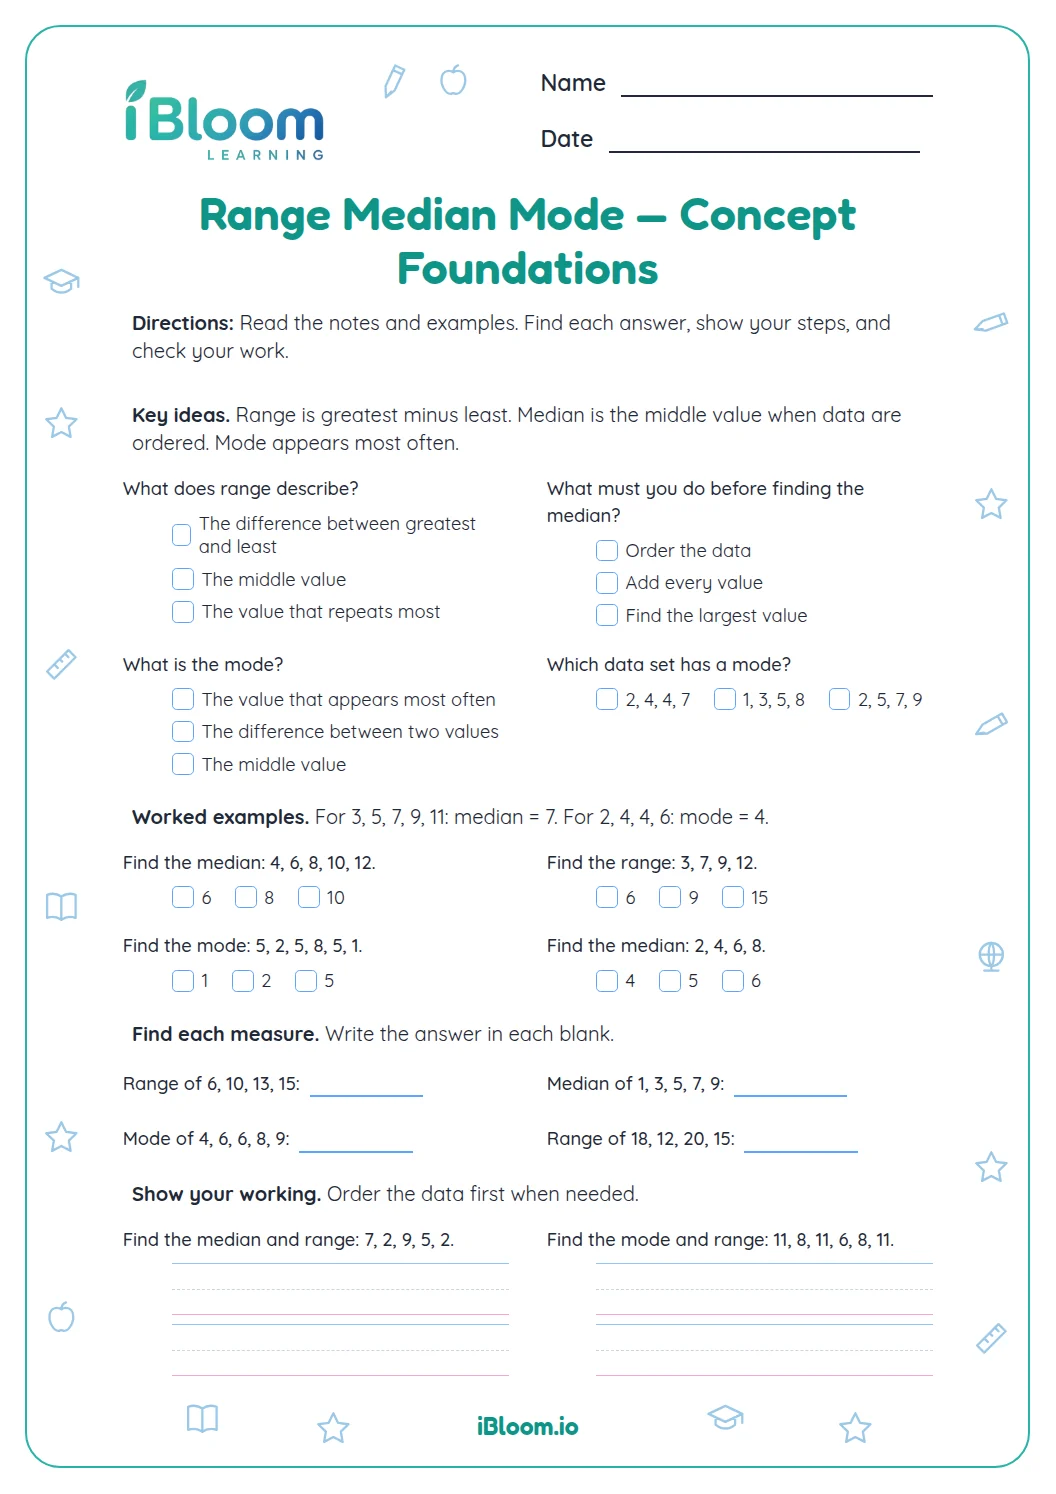
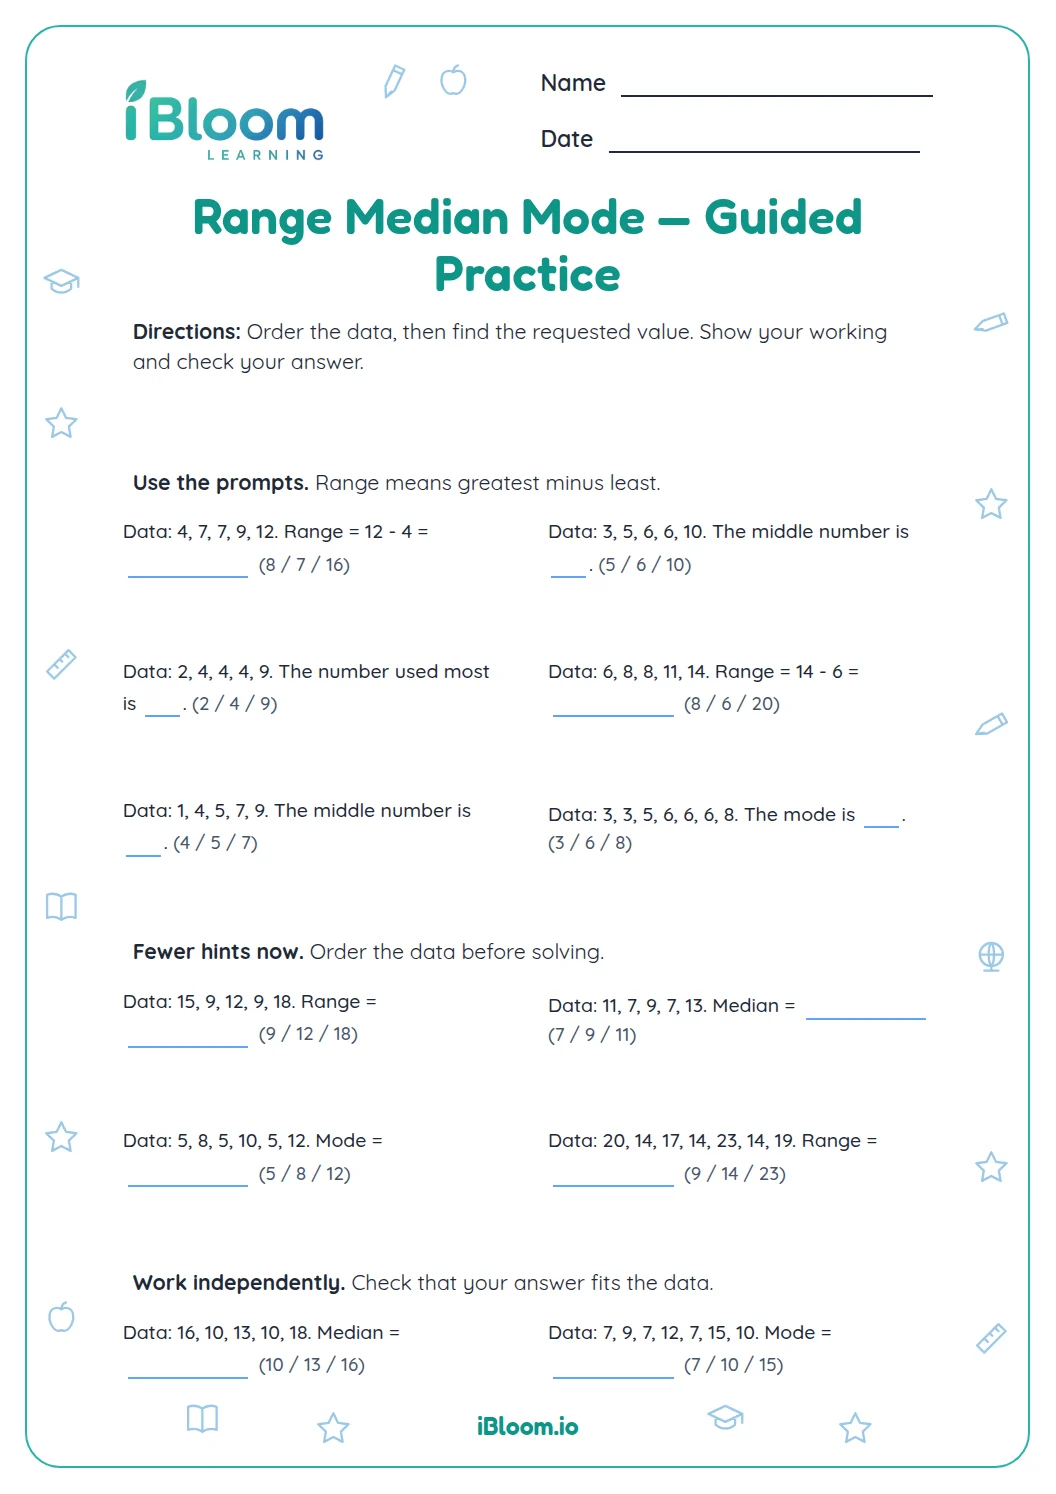
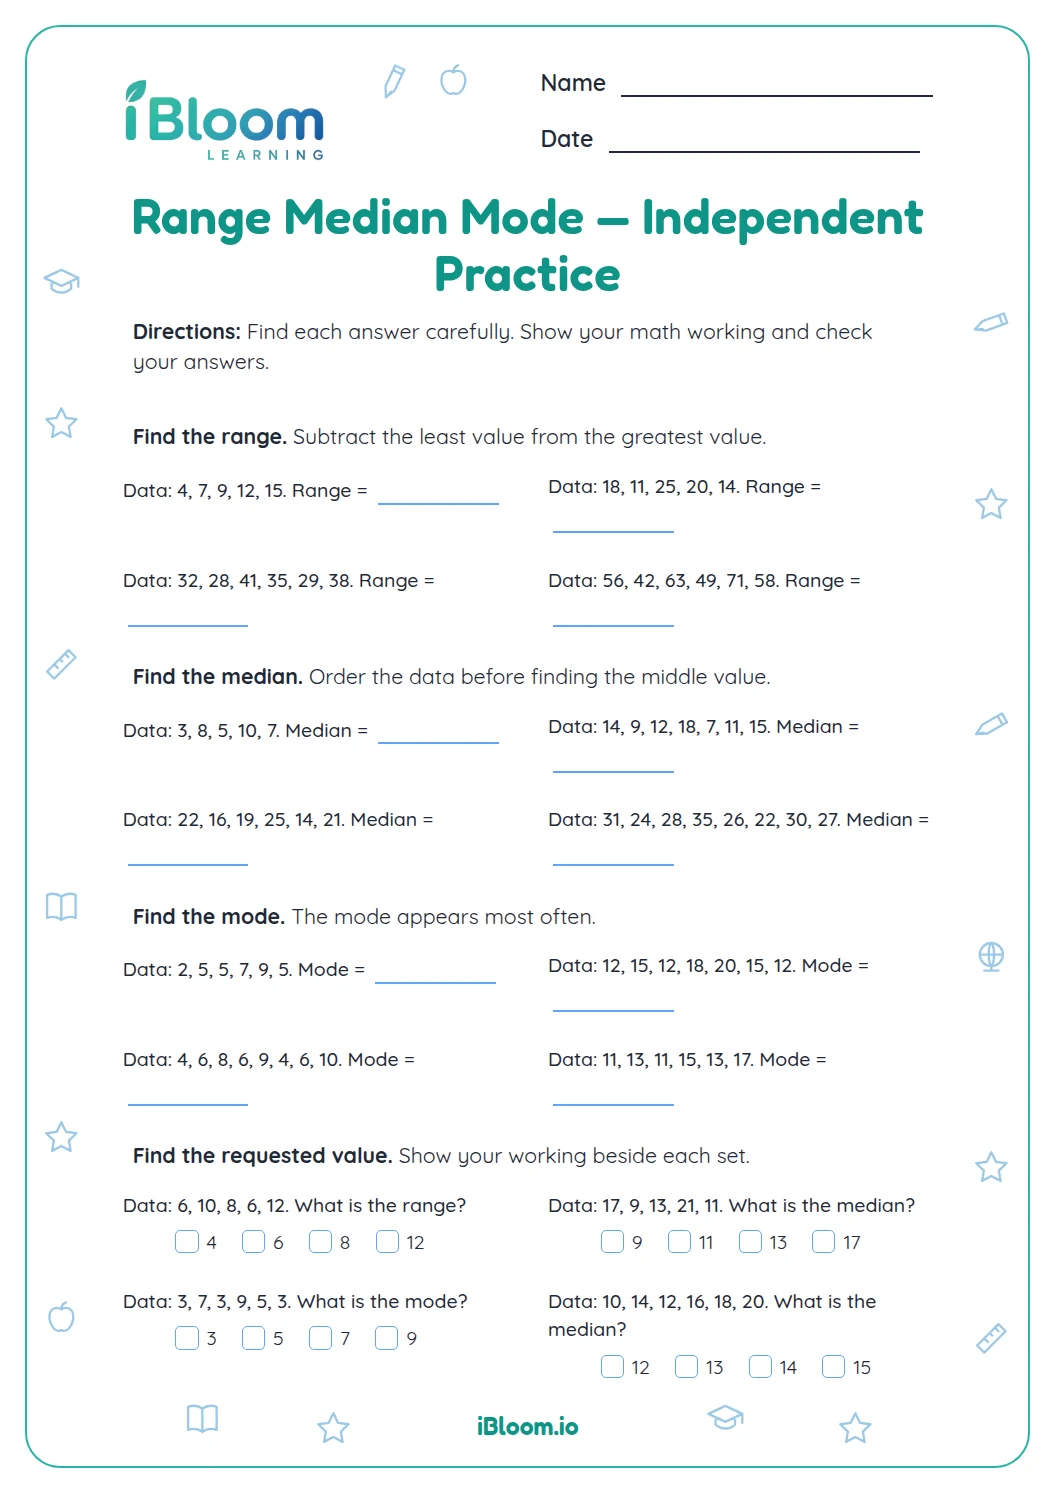
Order the values to find the median. With an even count, average the two middle values. The mode is the value that occurs most often; a set with no repeated value has no mode. Set B has no mode, while Set C has 3 as its mode.
How can I use this worksheet?
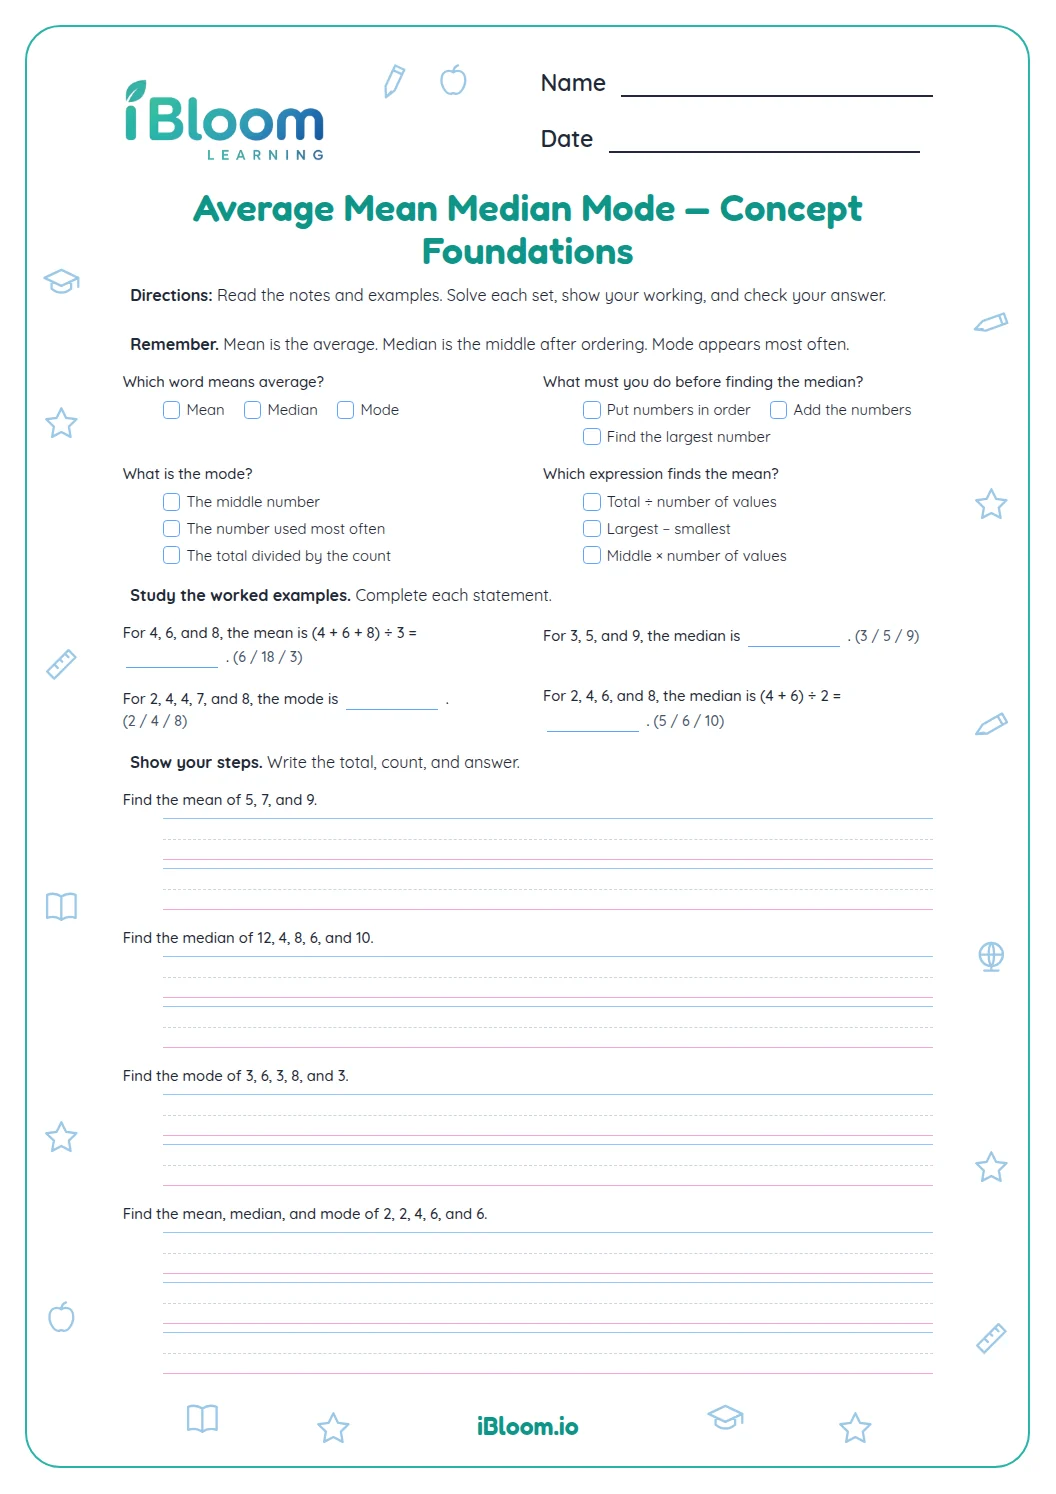
- 1Read the values in the table or the question.
- 2Count every observation, including repeats.
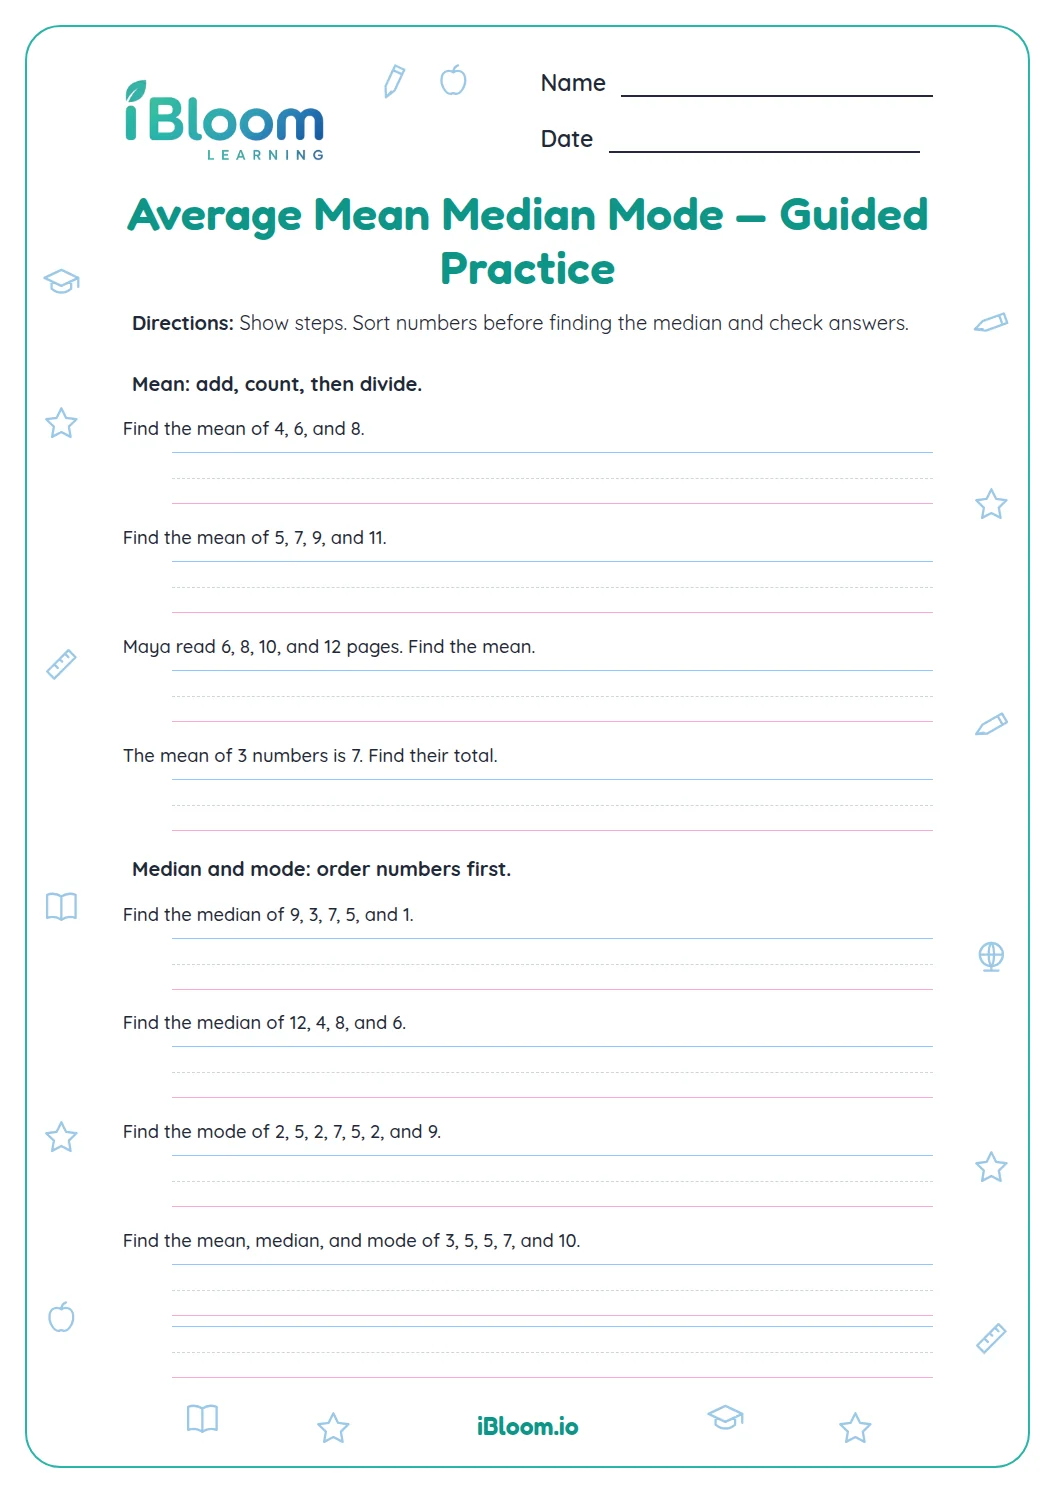
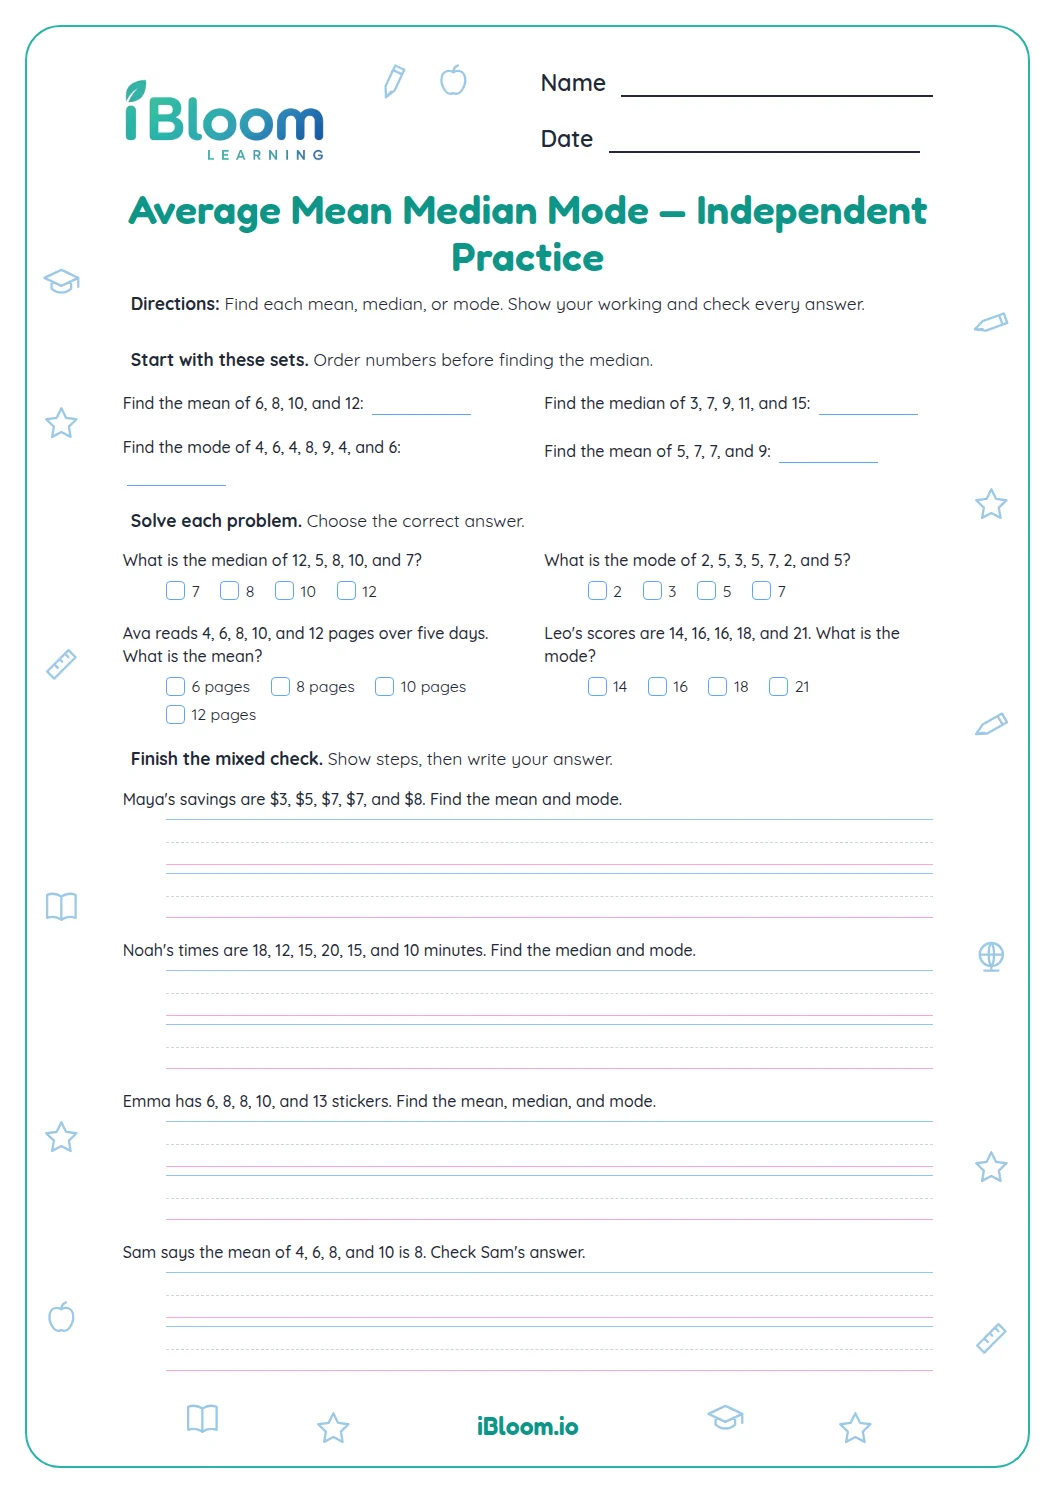
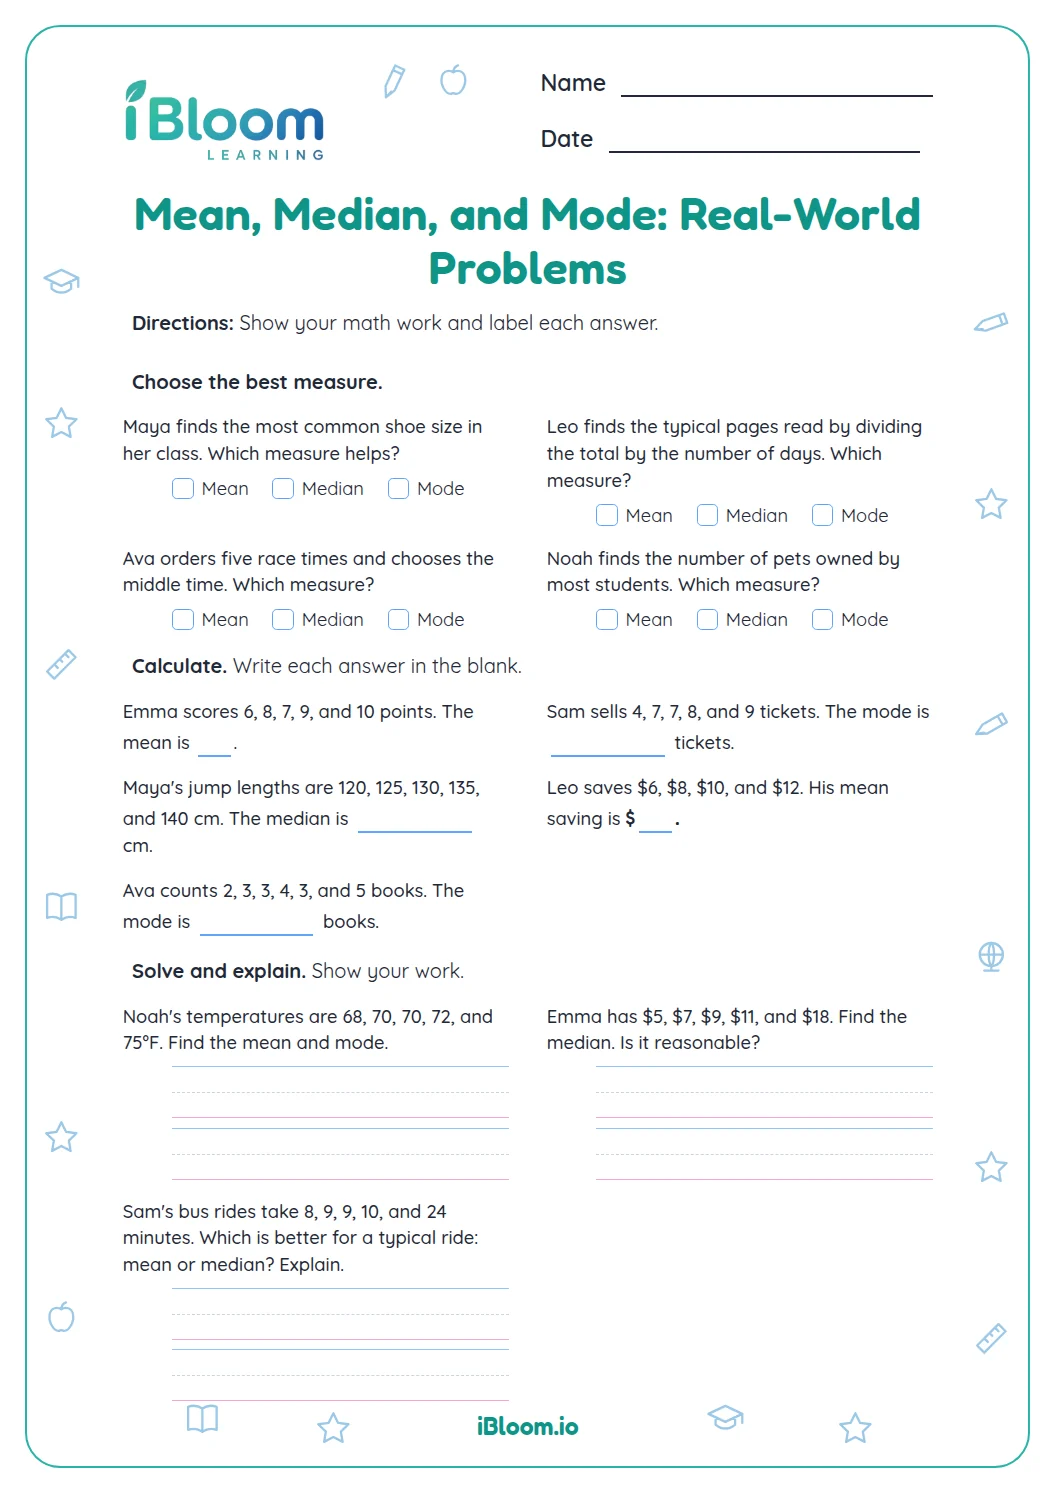
- 3Add the values and divide by the count to find the mean.
- 4Order the values; use the middle value or average the middle pair for the median.
- 5Compare frequencies to find the mode, or write “No mode” when all values occur once.
What should learners check?
The mistake
Leaving repeated values out of the total or count.
The fix
Include every occurrence shown in the data set.
The mistake
Choosing the upper middle value when there are an even number of observations.
The fix
Average the two middle values after ordering the full set.
The mistake
Naming a mode when every value appears once.
The fix
Compare frequencies; if no value repeats, write “No mode.”
What to practice next
Make more practice
Questions parents and teachers ask
What is a numerical data set?
A numerical data set is a group of values collected for a purpose. This worksheet shows one set in a bar graph, two as line plots, and more as ordered lists. Repeated bars or marks represent separate observations, so each occurrence counts when finding a mean, median, or mode.
How many questions are on this worksheet?
There are 14 questions in two parts. The first part uses a bar graph and line plots, then asks learners to compare measures across more data sets. The questions cover four means, four medians, four modes, and two observation counts. A separate key gives the answers for checking.
How do I find the mean?
Add every observation, including repeats, and divide the total by the number of observations. In the bar graph, the values are 1, 2, 3, 3, and 6; their total is 15 and there are five observations. The mean is 15 divided by 5, or 3.
What if a data set has an even number of values?
Order the values from least to greatest, then find the two middle values. Add them and divide by 2 to find the median. For Set B, the middle values are 2 and 3, so its median is 2.5. This gives the exact midpoint.
Can a data set have no mode?
Yes. If every value occurs the same number of times, there is no single most frequent value. Set B and Set D each have values that occur once, so their mode answer is “No mode.” A mode may also have a tie when two values occur most often.
Why are some values repeated in the data sets?
Repeated values show that the same observation occurred more than once. They affect the mean and can determine the mode, so include each repeated bar or line-plot mark when counting and adding. The line plot with values 2, 5, 5, 5, and 8 has 5 as its mode.