
About this worksheet
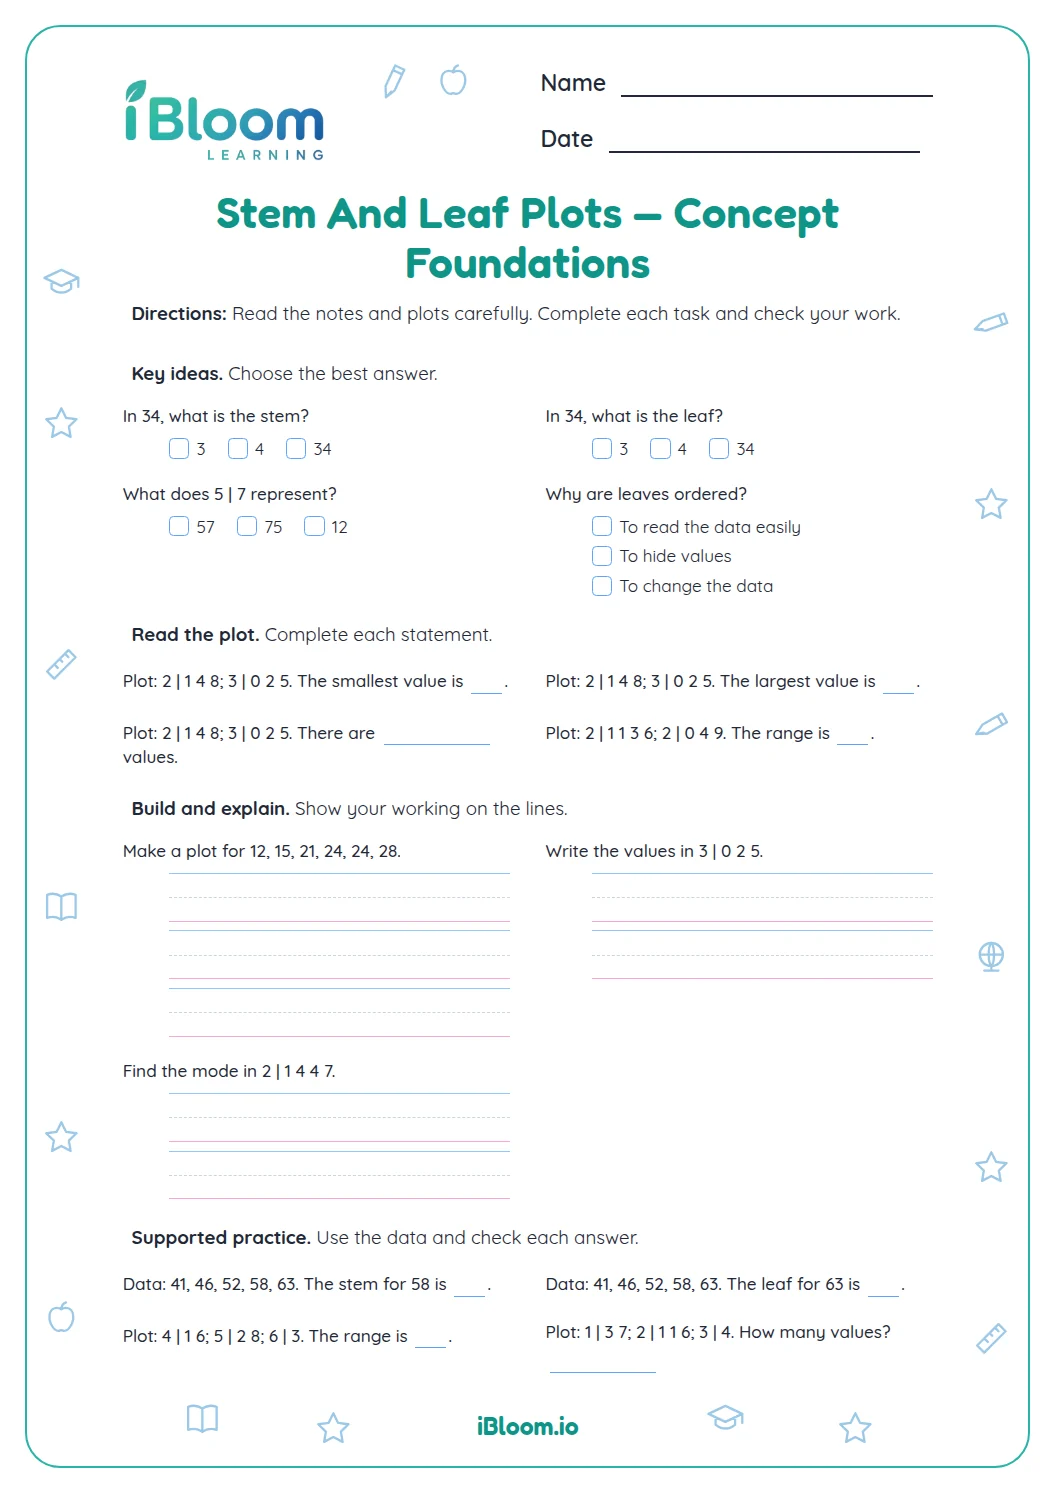
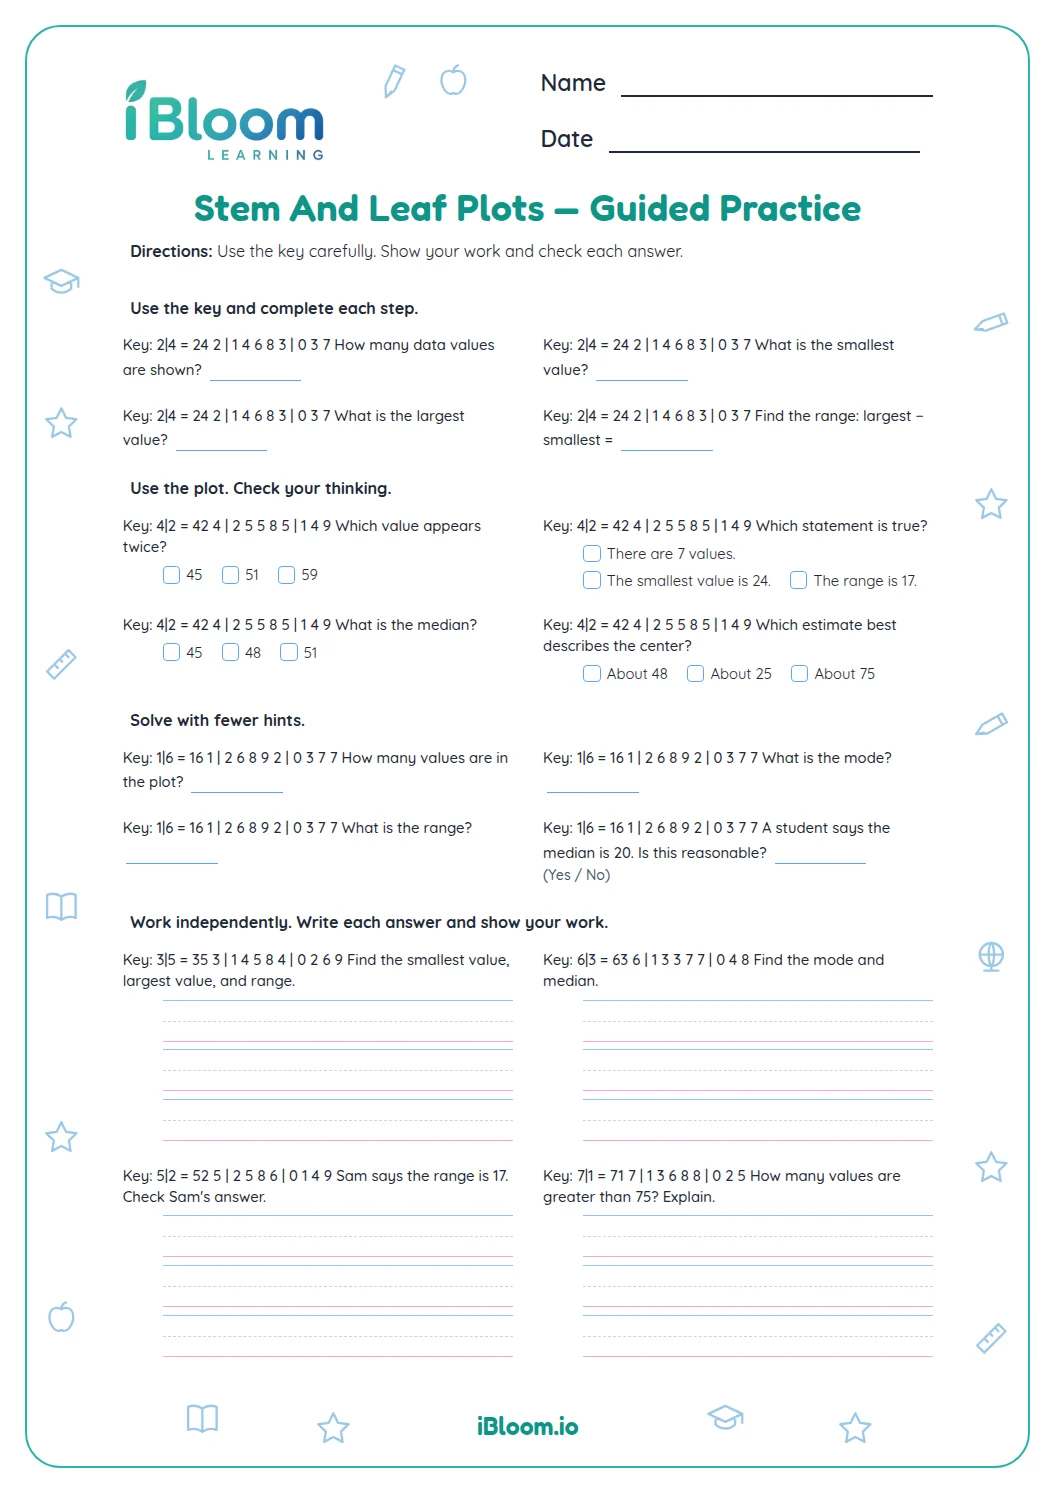
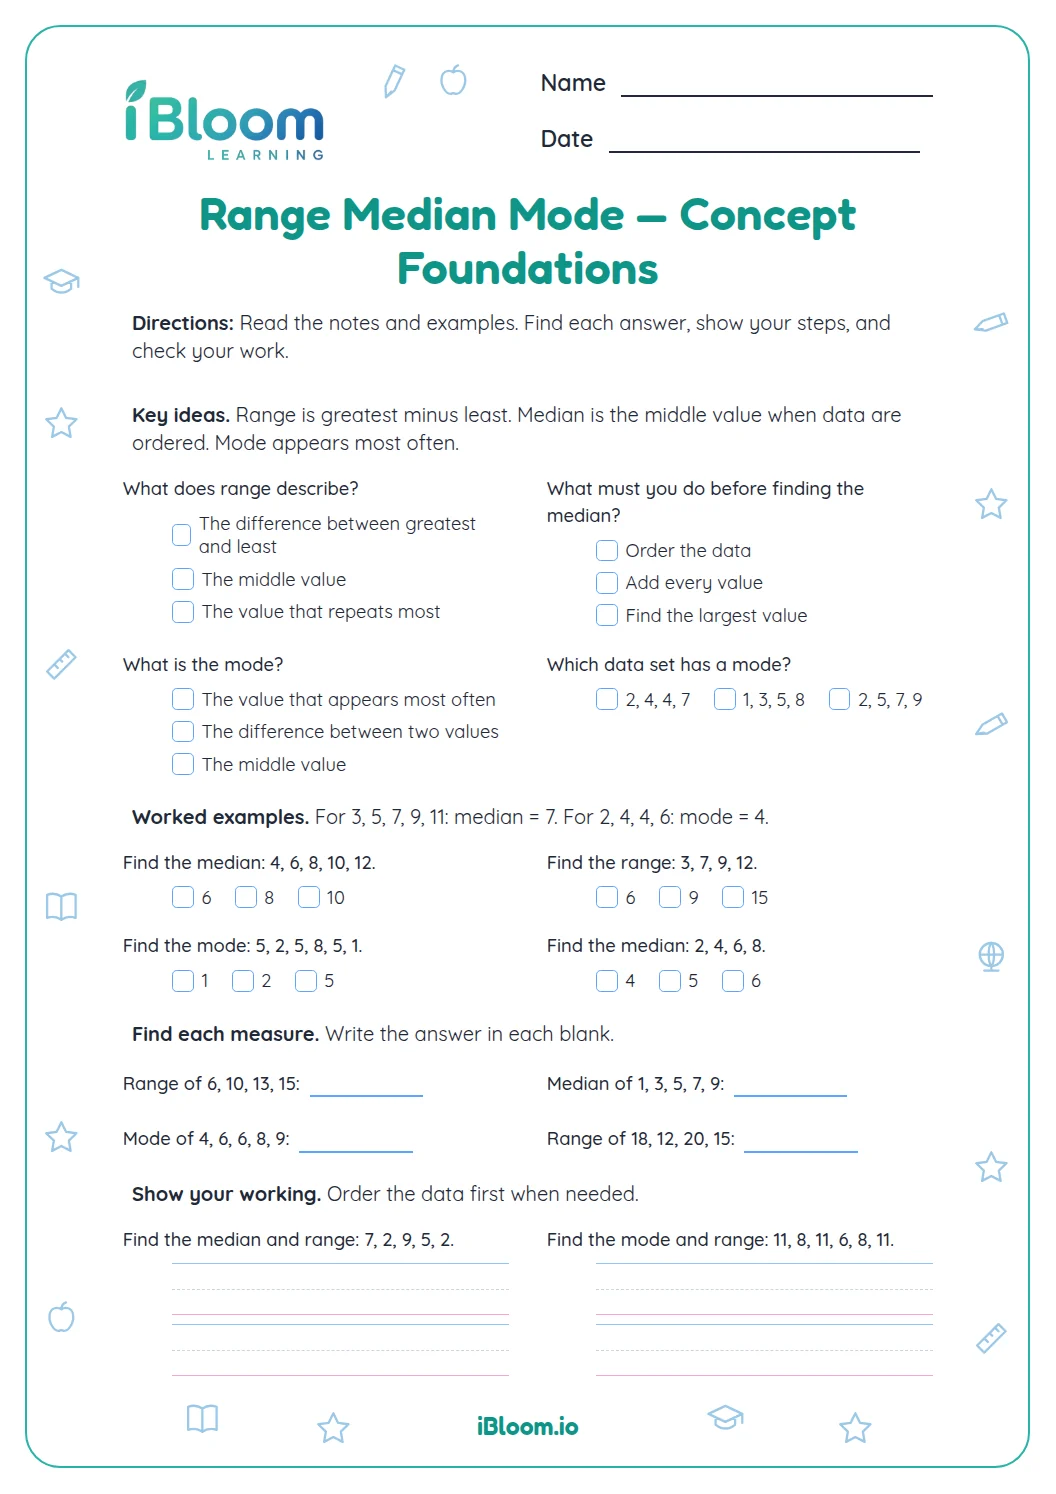
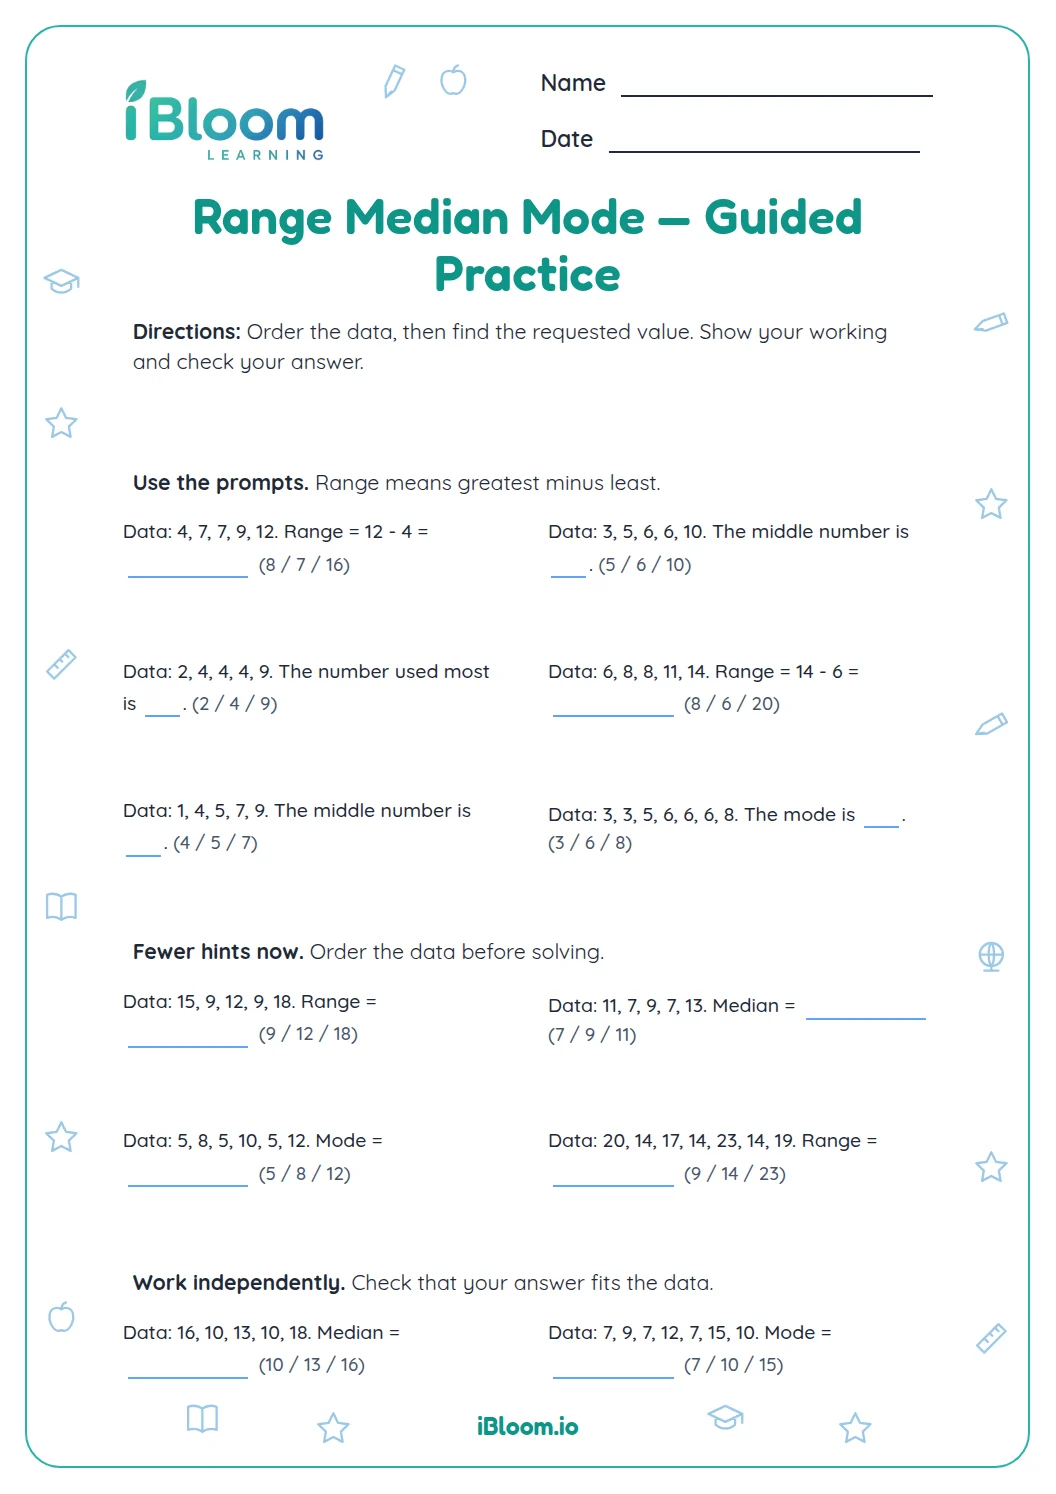
This Grade 5 data worksheet pairs two stem-and-leaf models with 14 questions. Students read plant heights and pages-read values, then interpret counts, greatest and least values, median, mode, and range. Each key explains how a stem and leaf combine into one whole-number value. A separate answer key makes it easy to check each reading and calculation.
How does a stem-and-leaf key work?
The key tells what each stem and leaf represent. In the height model, 2 | 3 means 23 cm: the stem gives the tens digit and the leaf gives the ones digit. Each leaf is one measurement.
- 1Key: 2 | 3 = 23 cm
- 2The stem 2 and leaf 3 make 23 cm.
How can the data show a median or mode?
Count the leaves to find how many values are recorded. Read the values in order to find the middle one (the median); a repeated value can be the mode. For an even count, average the two middle values.
How do you find the range?
Find the greatest and least values by reading the outer stems and leaves. Subtract the least from the greatest. In the height model, 35 − 12 = 23 cm.
How can you use this worksheet?
- 1Read the key to see what each stem and leaf represent.
- 2Combine a stem with one leaf at a time to read every value.
- 3Count leaves to find the number of data points.
- 4For median, list values in order; for mode, look for a repeated value.
- 5Subtract the least value from the greatest to find range.
Mistakes to watch for
The mistake
Combining all leaves in a row into one number.
The fix
Each leaf is its own value paired with the stem.
The mistake
Reading 2 | 3 as 2.3.
The fix
The key shows it is a whole-number value, 23.
The mistake
Choosing the middle row as the median.
The fix
List all observations in order and locate the middle value.
What to practice next
Make more practice
Questions parents and teachers ask
How do I read a stem-and-leaf plot?
Use the key to join one stem with one leaf. In the plant-height model, 2 | 3 means 23 cm, and 2 | 8 means 28 cm. Each leaf represents one measurement, including repeated leaves when a value occurs more than once.
How do students find the median?
Read the values in order from least to greatest, then locate the middle. With an odd number of values, choose the single middle value; with an even number, average the two middle values. Listing values first helps keep their positions clear.
What is the mode in a stem-and-leaf plot?
The mode is the value that occurs most often. Find a repeated leaf in its stem row, then combine that stem and leaf to name the repeated data value. A row can contain more than one repeated value in some data sets.
How is range calculated?
Subtract the least value from the greatest value. For the plant heights, the least is 12 cm and the greatest is 35 cm, so the range is 23 cm. Range describes the difference between those two endpoints. Students can use the displayed values to verify the subtraction.
How many questions and models are included?
There are 14 multiple-choice questions using two stem-and-leaf models: plant heights and pages read. The questions cover individual values, counts, median, mode, and range. The answer key is printed separately across two pages. Students can work through one model at a time before checking the key.