
About this worksheet
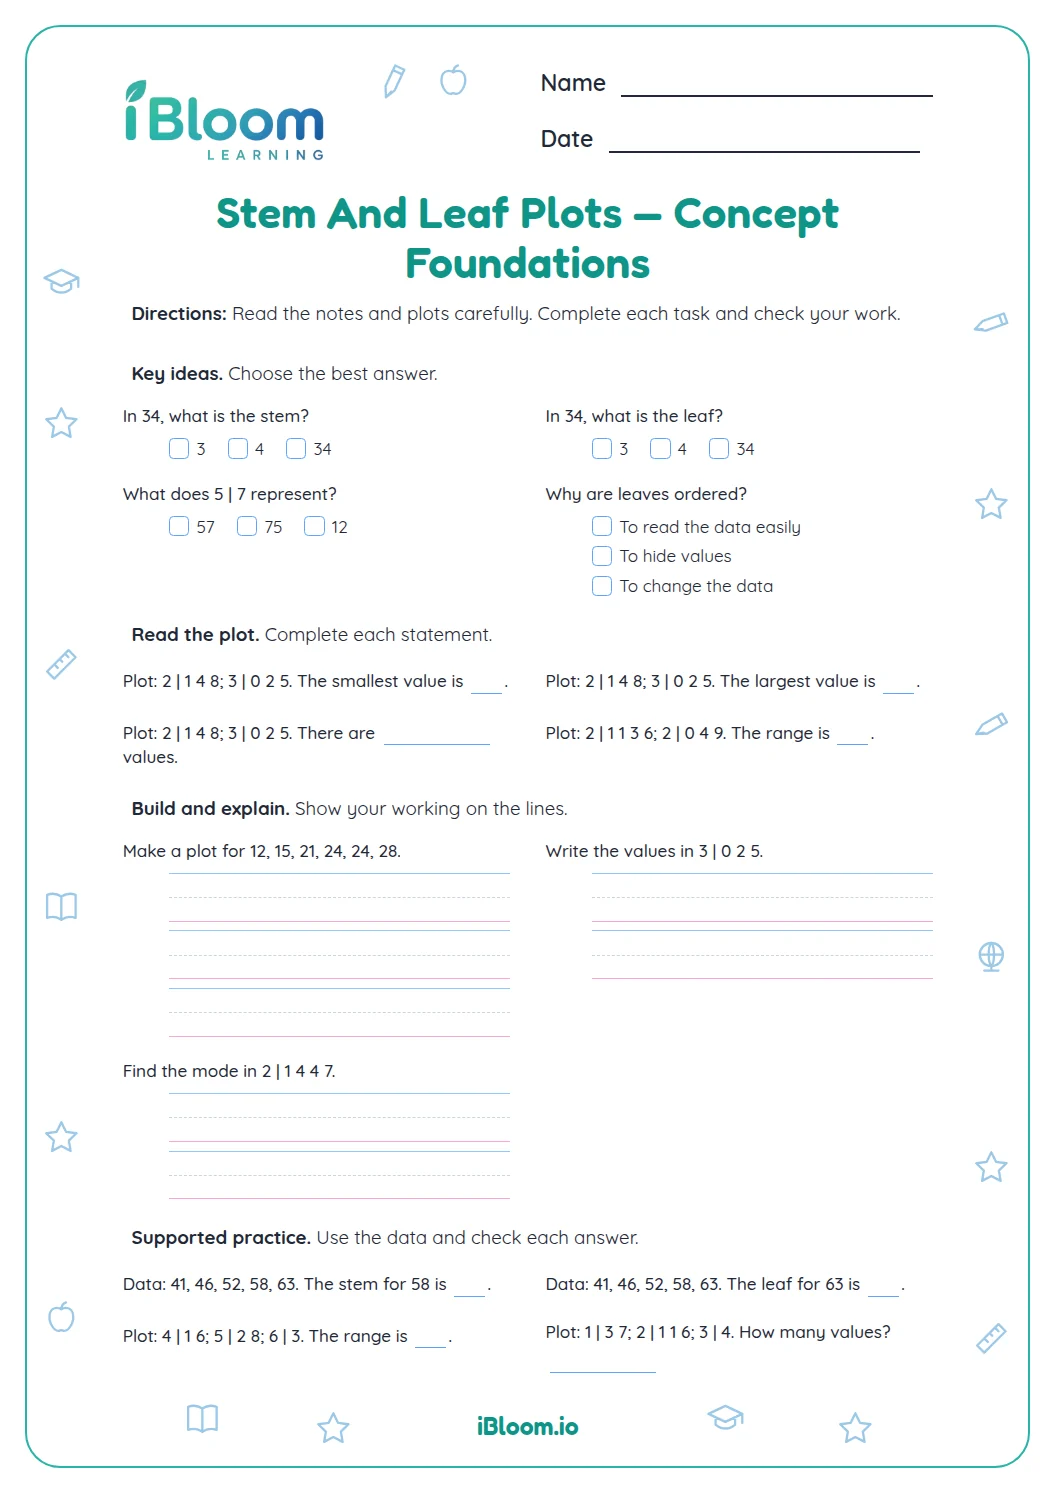
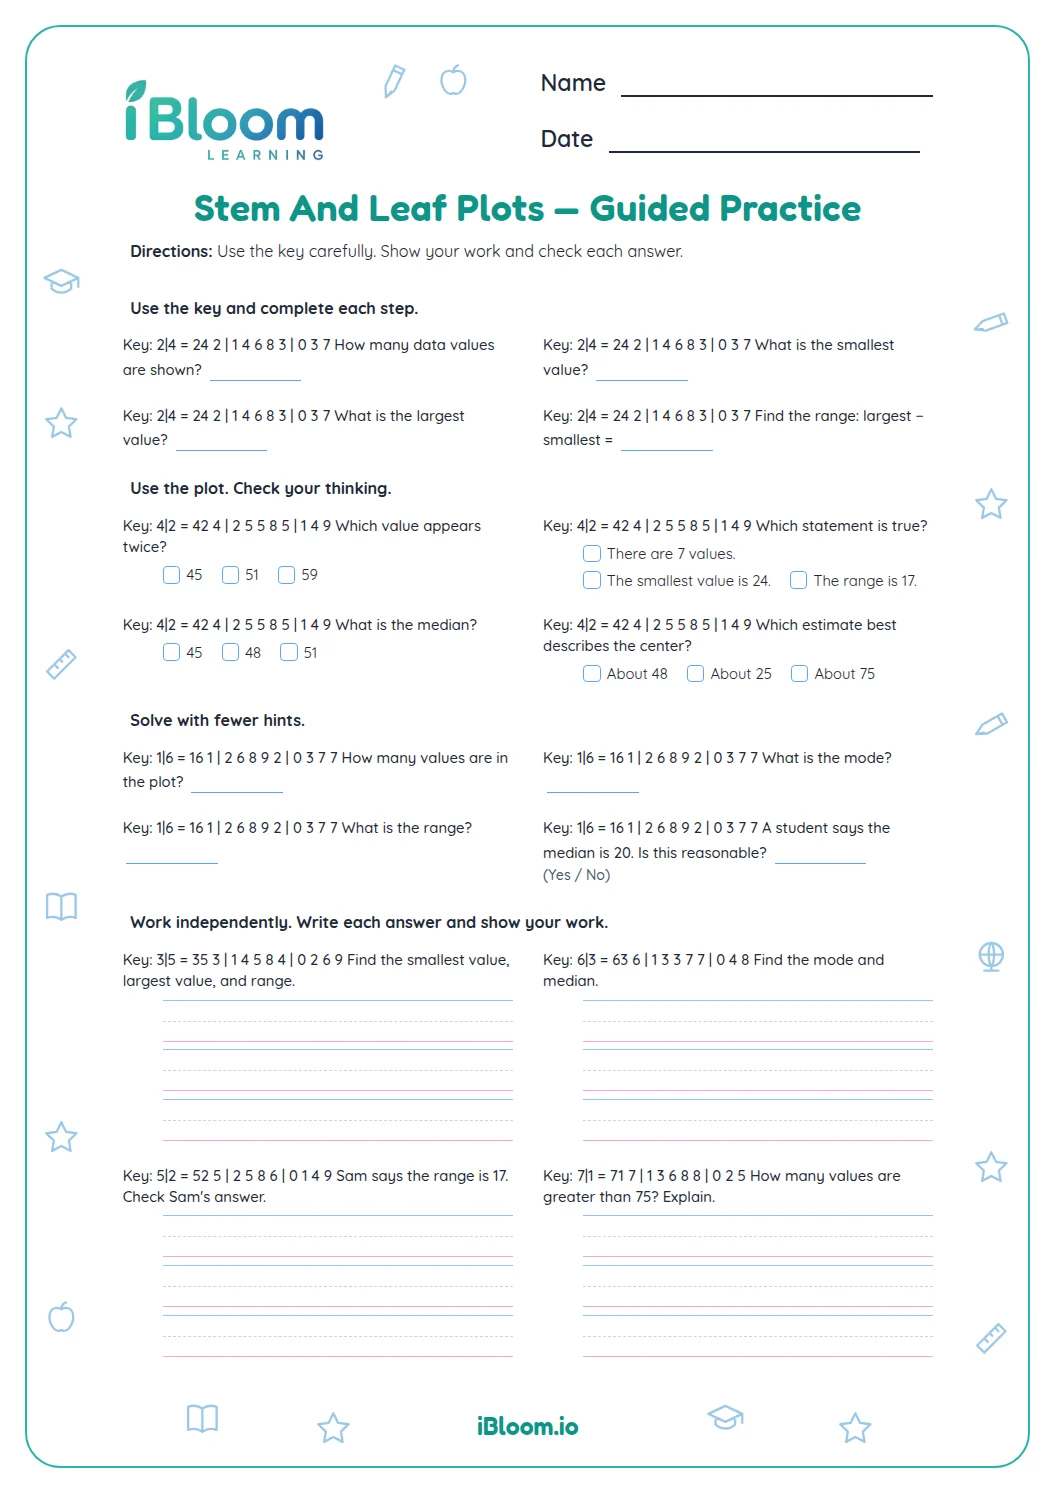
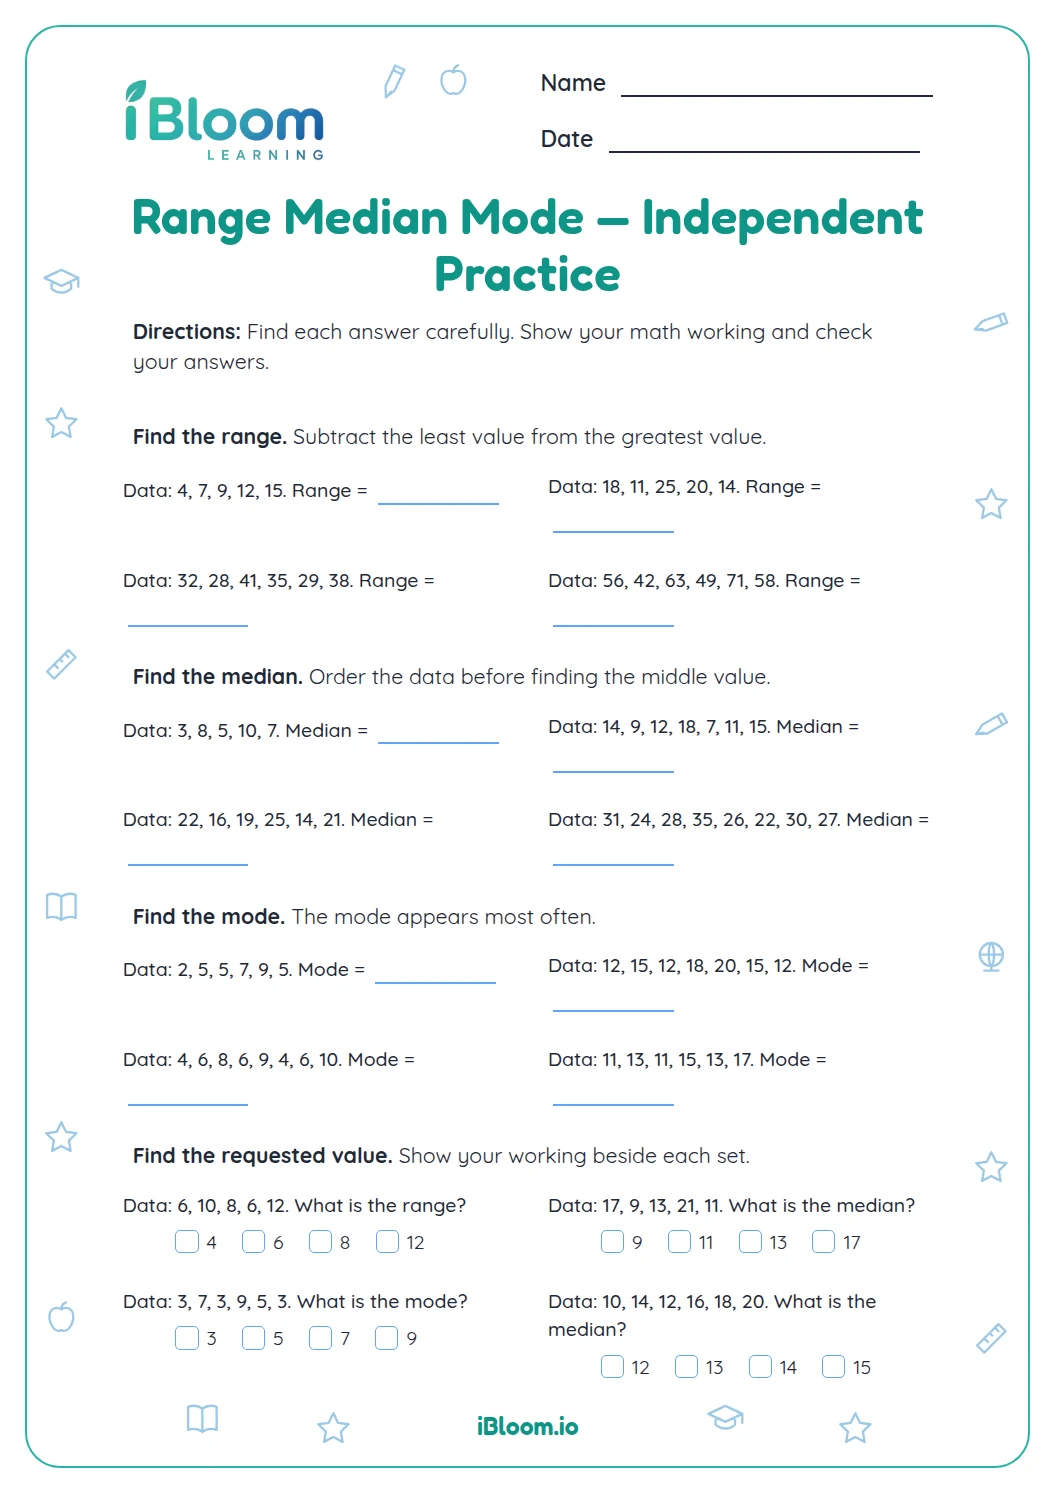
This free Grade 5 worksheet uses small real-world data sets to practice reading stem-and-leaf plots. Learners use a key such as 1|2 = 12, then find least and greatest values, count data, and compare values. Later questions ask for range, median, mode, or a count that meets a condition. The 16 short-answer questions appear in three parts, and a separate answer key supports checking.
How do you read a stem-and-leaf plot?
Use the key to combine each stem and leaf into a number. In question 1, the key 1|2 = 12 means the leaves 2, 5, and 8 beside stem 1 represent 12, 15, and 18. The smallest value is 12.
- 1Key: 1|2 = 12; the first row is 1|2 5 8.
- 2Combine stem 1 with leaf 2 to get 12.
- 3The least value is 12.
What can the values tell you?
Questions ask learners to find a greatest value, count the data points, or find the range by subtracting the least value from the greatest. Read every leaf, including repeated leaves, because each one represents a data value.
- Part A: read values and find least, greatest, count, and range.
- Part B: interpret more plots, including a median.
- Part C: use conditions to find a median, count, or mode.
How can learners check a median or mode?
For a median, list the data values in order and locate the middle. With an even number of values, average the two middle values. A mode is the value that appears most often; if no value repeats, there is no mode.
How to use this worksheet
- 1Read the plot key before interpreting any row.
- 2Write each stem-and-leaf pair as a number.
- 3Count repeated leaves as separate data values.
- 4For range, subtract the least value from the greatest.
- 5For median, order the values; for mode, look for the most frequent value.
- 6Check the result against the answer key and the original plot.
Mistakes to watch for
The mistake
Reading 1|2 as 1.2 or 2.1.
The fix
Use the key: 1|2 = 12, so the stem is the tens digit.
The mistake
Skipping a repeated leaf while counting.
The fix
Count each leaf once, even when its digit repeats.
The mistake
Finding the median before ordering values.
The fix
Write the values from least to greatest before locating the middle.
What to practice next
Make more practice
Questions parents and teachers ask
What does the key 1|2 = 12 mean?
It means stem 1 and leaf 2 combine to make 12. The stem shows the tens digit, and the leaf shows the ones digit. Use the key printed with each plot because the place value depends on that key. The same method helps decode every row.
How many questions are on this printable?
There are 16 short-answer questions arranged in three parts, with four worksheet pages and four answer-key pages. Learners read a plot and answer one focused question at a time. The questions include least and greatest values, range, median, mode, and simple comparisons.
Does the answer key come with the worksheet?
Yes. The printable includes a separate answer key. Have the learner decode the plot and solve each item first, then use the key to check. If an answer differs, go back to the stem, leaf, or ordered list and find the source of the difference.
How do you find the range in a stem-and-leaf plot?
First read the smallest and largest data values from the plot. Subtract the least value from the greatest value to find the range. For example, a plot with least 12 and greatest 35 has a range of 23. The worksheet includes several range questions.
How do you find the median when there are an even number of values?
Put the values in order and identify the two middle numbers. Add those two numbers and divide the sum by 2. For instance, the middle values 19 and 20 have a median of 19.5. Some questions on this sheet use even-sized data sets.