
About this worksheet
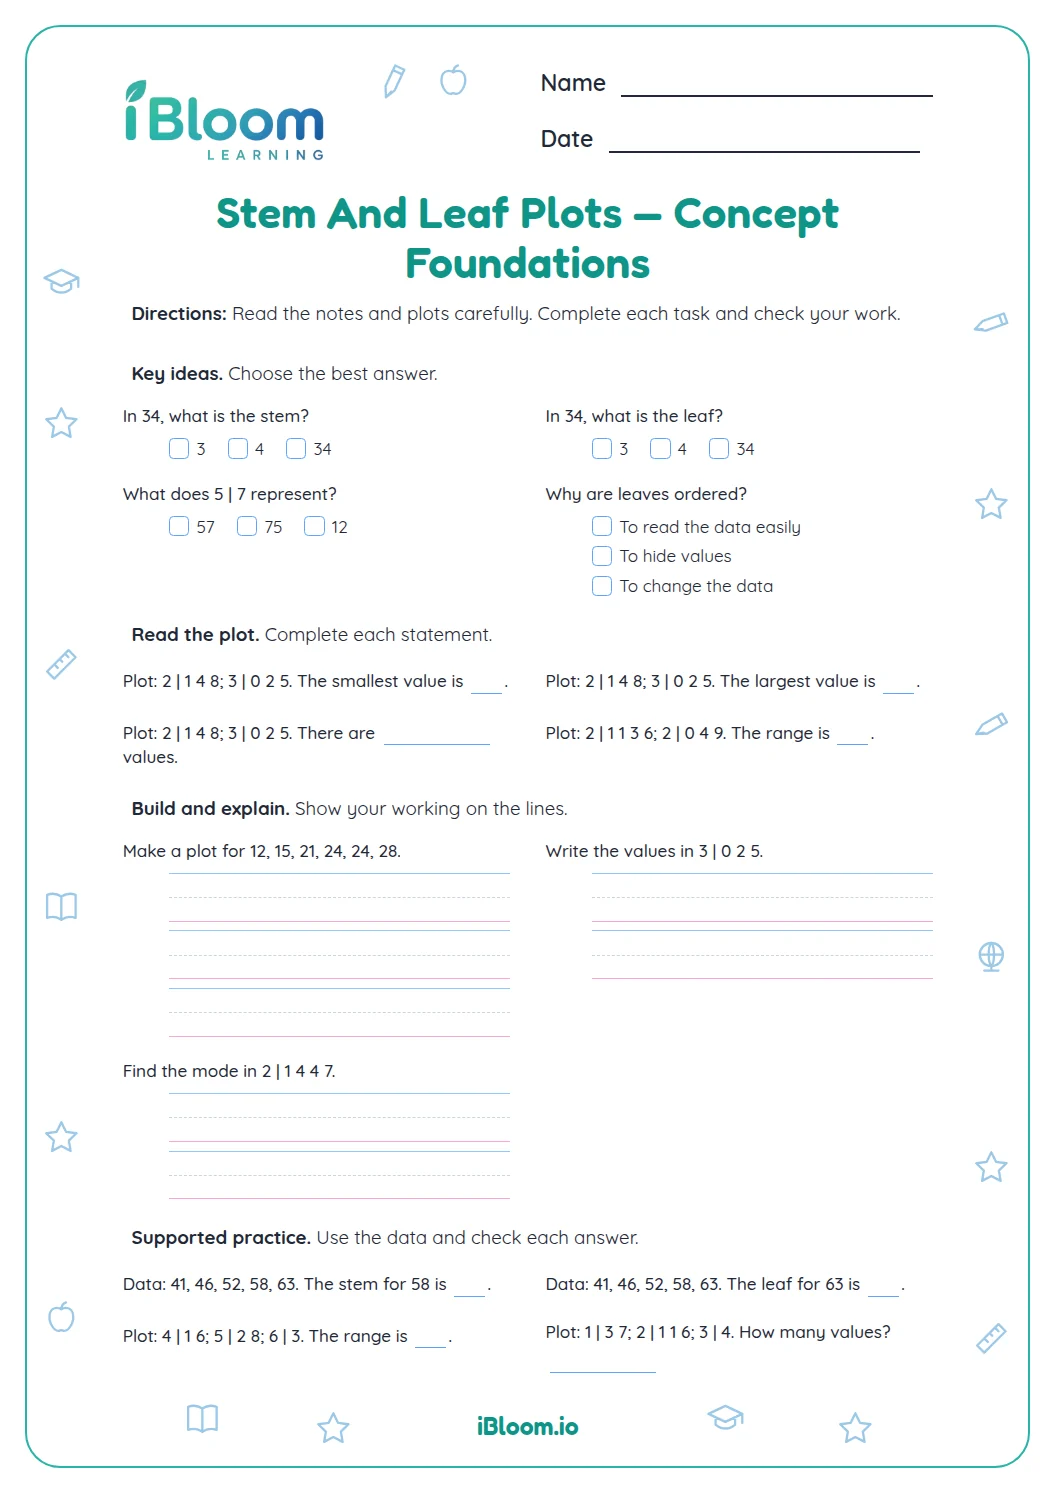
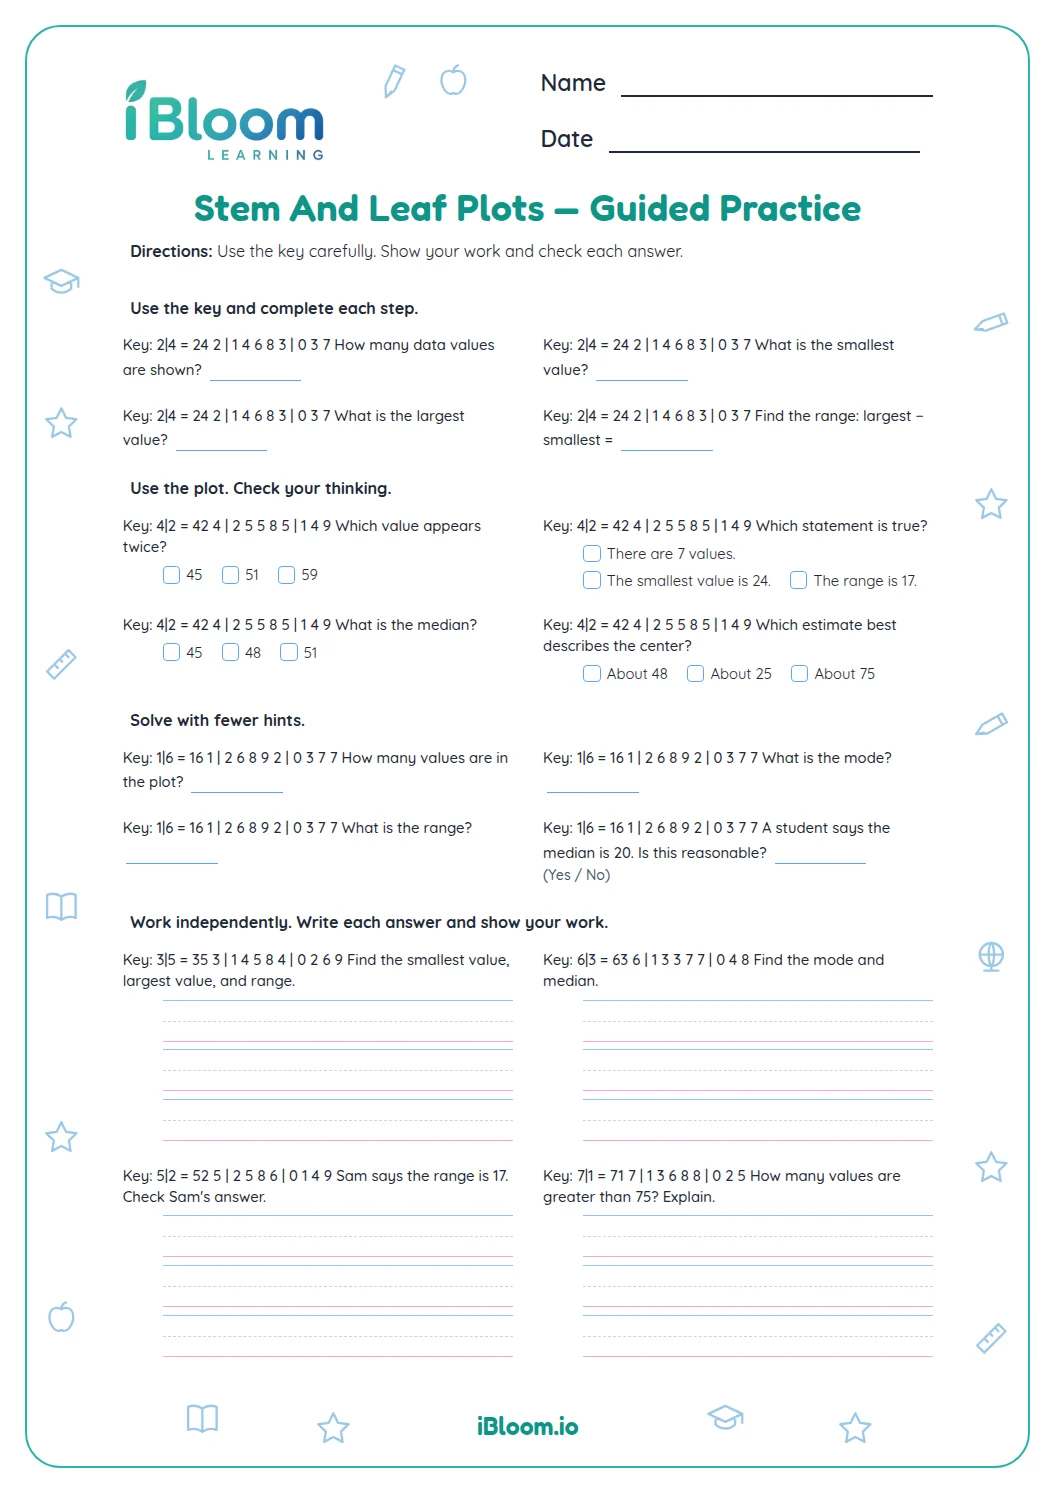
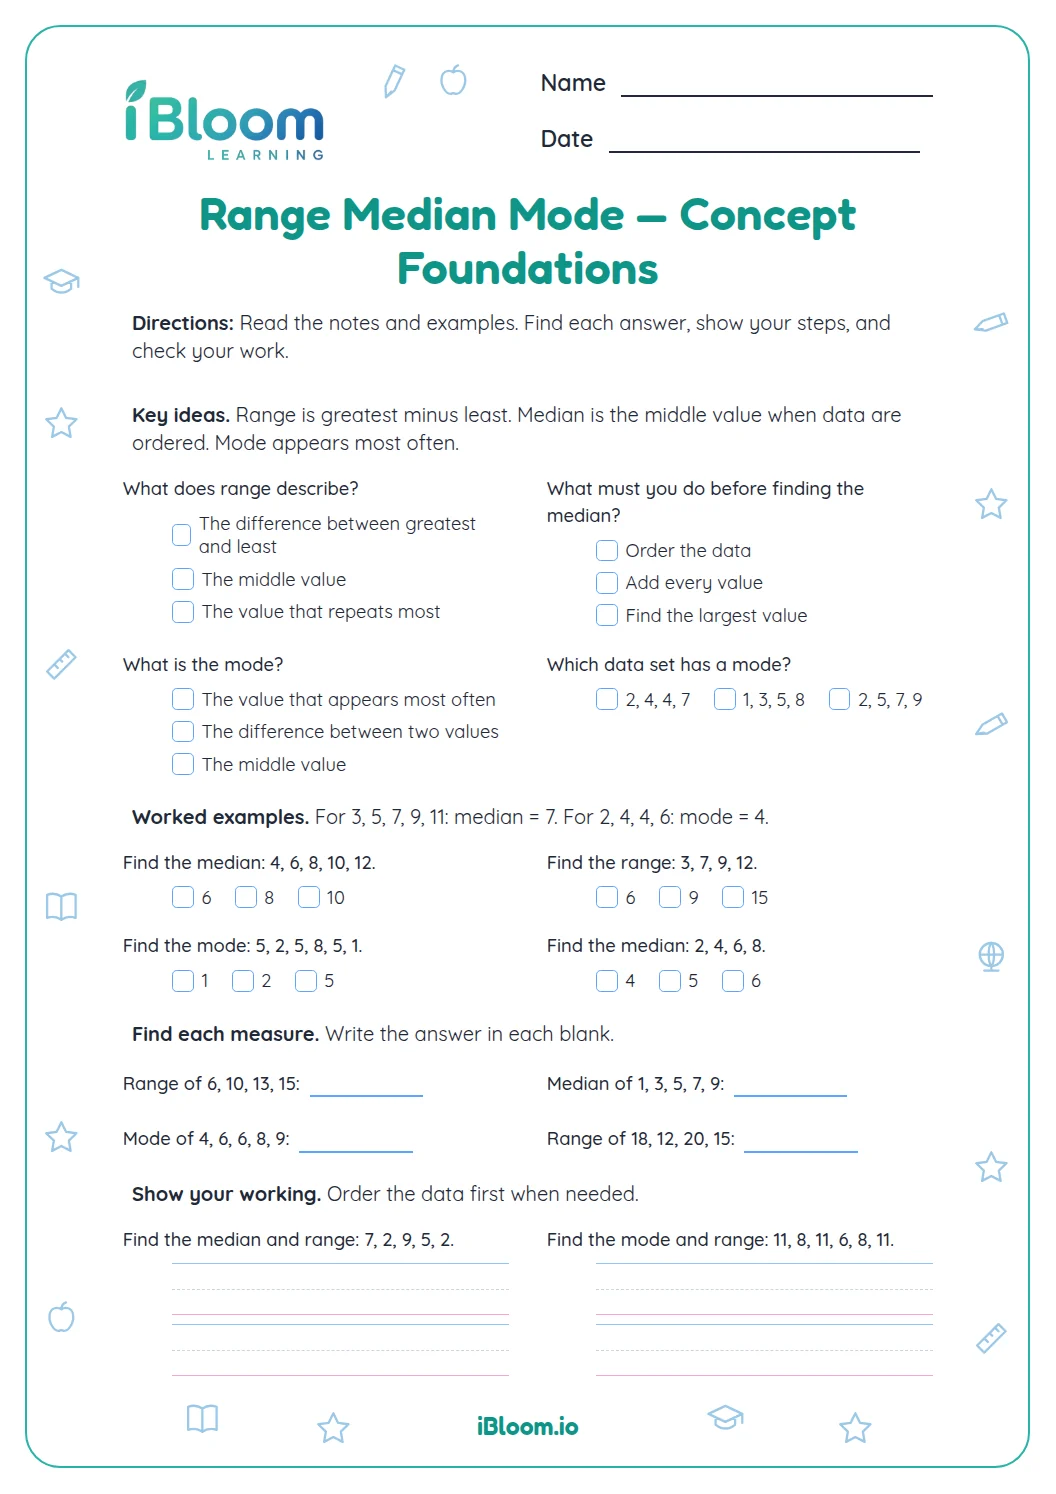
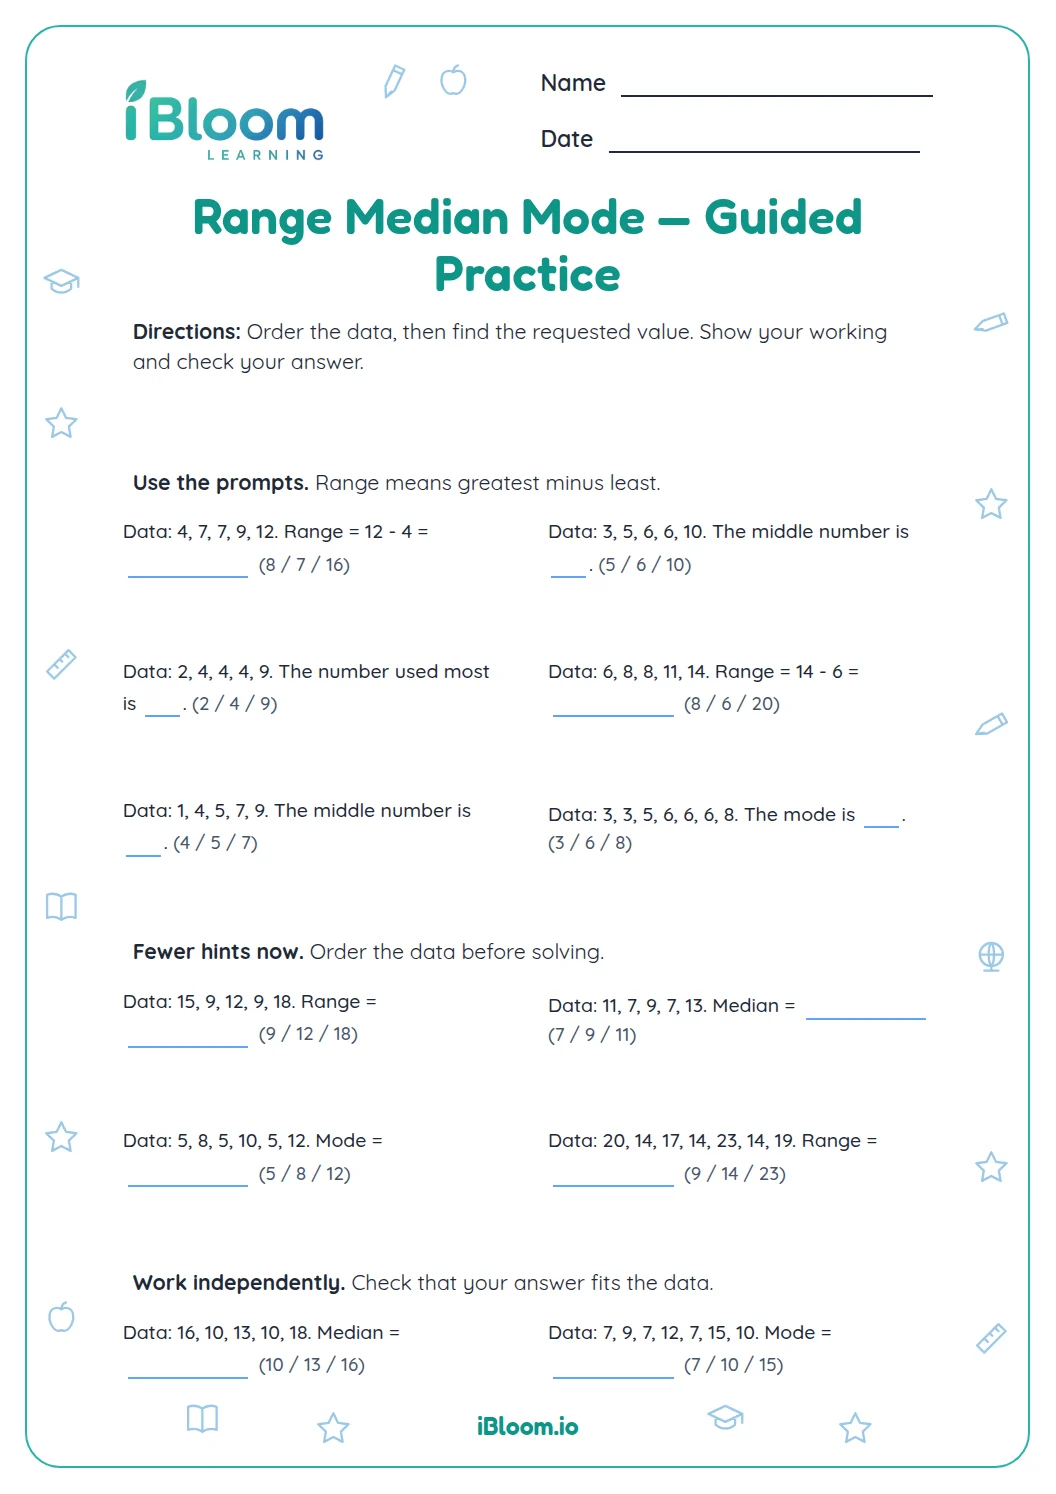
This Grade 5 math worksheet uses stem-and-leaf plots to practice reading values, identifying range, median, and mode, and explaining what a plot shows. Students interpret plots, organize a small data set, and solve reasoning questions. A separate answer key gives sample responses for written explanations.
What does the worksheet ask students to do?
Part A asks students to read plot values and reason about range, median, and mode. Parts B and C use written plot descriptions and a small data set to practice counting, ordering, and explaining conclusions.
- 1Question 1: 12, 14, 18, 21, 23, 23, 27, 31, 35, 39. What does 2 | 3 mean?
- 2Answer: 23; the stem is tens and the leaf is ones.
How can students work through each question?
Read a stem-and-leaf key first: in 2 | 3, the stem 2 and leaf 3 make 23. Count each leaf as one value. For an even number of values, average the two middle values to find the median.
How should families review the answers?
Check that leaves are in increasing order within each stem and repeated leaves remain in the plot. When explaining a result, point to the value or repeated leaf that supports the conclusion.
How to use this worksheet
- 1Read the direction for the first part together.
- 2Work through each question in order.
- 3Reread the prompt before writing an answer.
- 4Use the answer key to check each response.
Common mistakes and quick fixes
The mistake
Reading 2 | 3 as 2.3.
The fix
Use the key: stem is tens and leaf is ones, so it means 23.
The mistake
Dropping a repeated leaf.
The fix
Keep every leaf; repeated values count as separate data points.
The mistake
Finding a median without ordering values.
The fix
List values least to greatest before locating the middle.
What to practice next
Questions parents and teachers ask
What does a stem-and-leaf plot show?
It organizes data by place value. In the key 2 | 3 = 23, the stem represents the tens digit and the leaf represents the ones digit. Each leaf stands for one observation, including when a value repeats. This notation lets students recover the original data while keeping each observation visible.
How many questions are included?
There are 14 questions in three parts. Students interpret listed data and plot descriptions, then answer questions about range, median, mode, and value counts. The final items ask them to list or organize data and explain a result. In the even case, averaging the middle pair gives the value halfway between those observations.
How do students find the median?
First list the values from least to greatest. If there are an odd number, use the middle value; if there are an even number, average the two middle values. Question 6 has eight values, so its median is the mean of 24 and 27. The key uses the same tens-and-ones interpretation for every plot description on the page.
What should students do with repeated leaves?
Keep every repeated leaf because each one represents a separate data value. For example, a plot with 5 | 0 2 2 represents 50, 52, and 52. The repeated 52 affects both the count and the mode. Each repeated mark represents another observation, so removing it would change the data set.
Does the answer key accept other explanations?
Yes. The key gives sample responses for written reasoning, so students may use different wording when it answers the question accurately. For instance, a median explanation can describe the ordered values and identify the two middle numbers. Students should refer to the listed stems and leaves when they explain their answer.