
About this worksheet
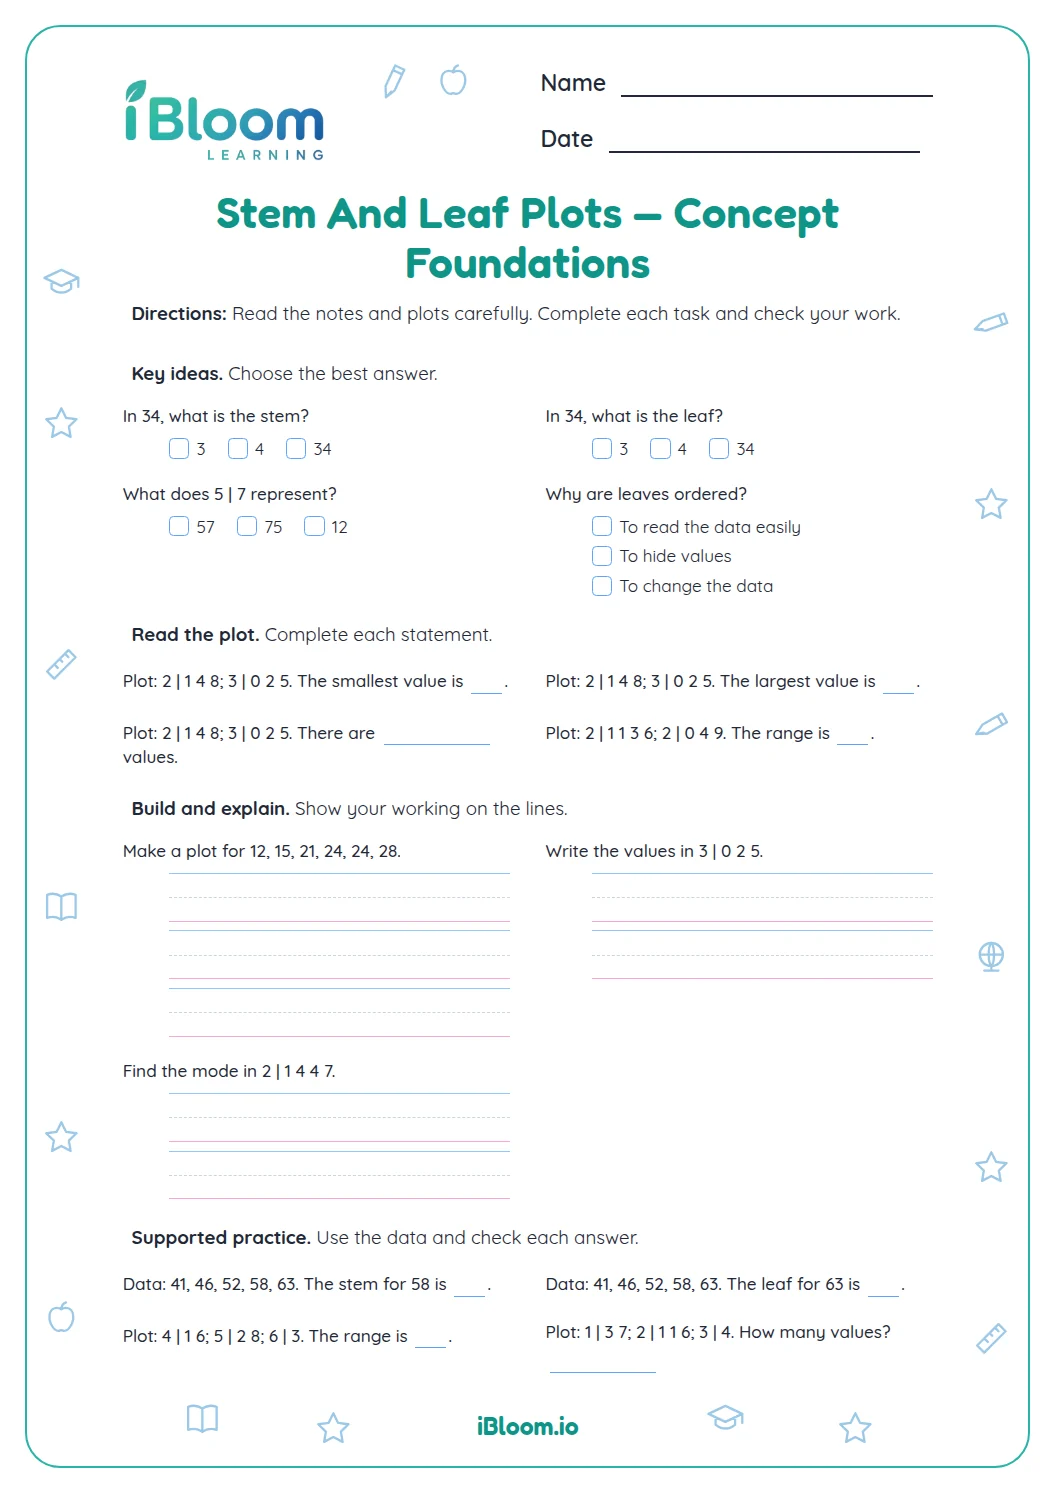
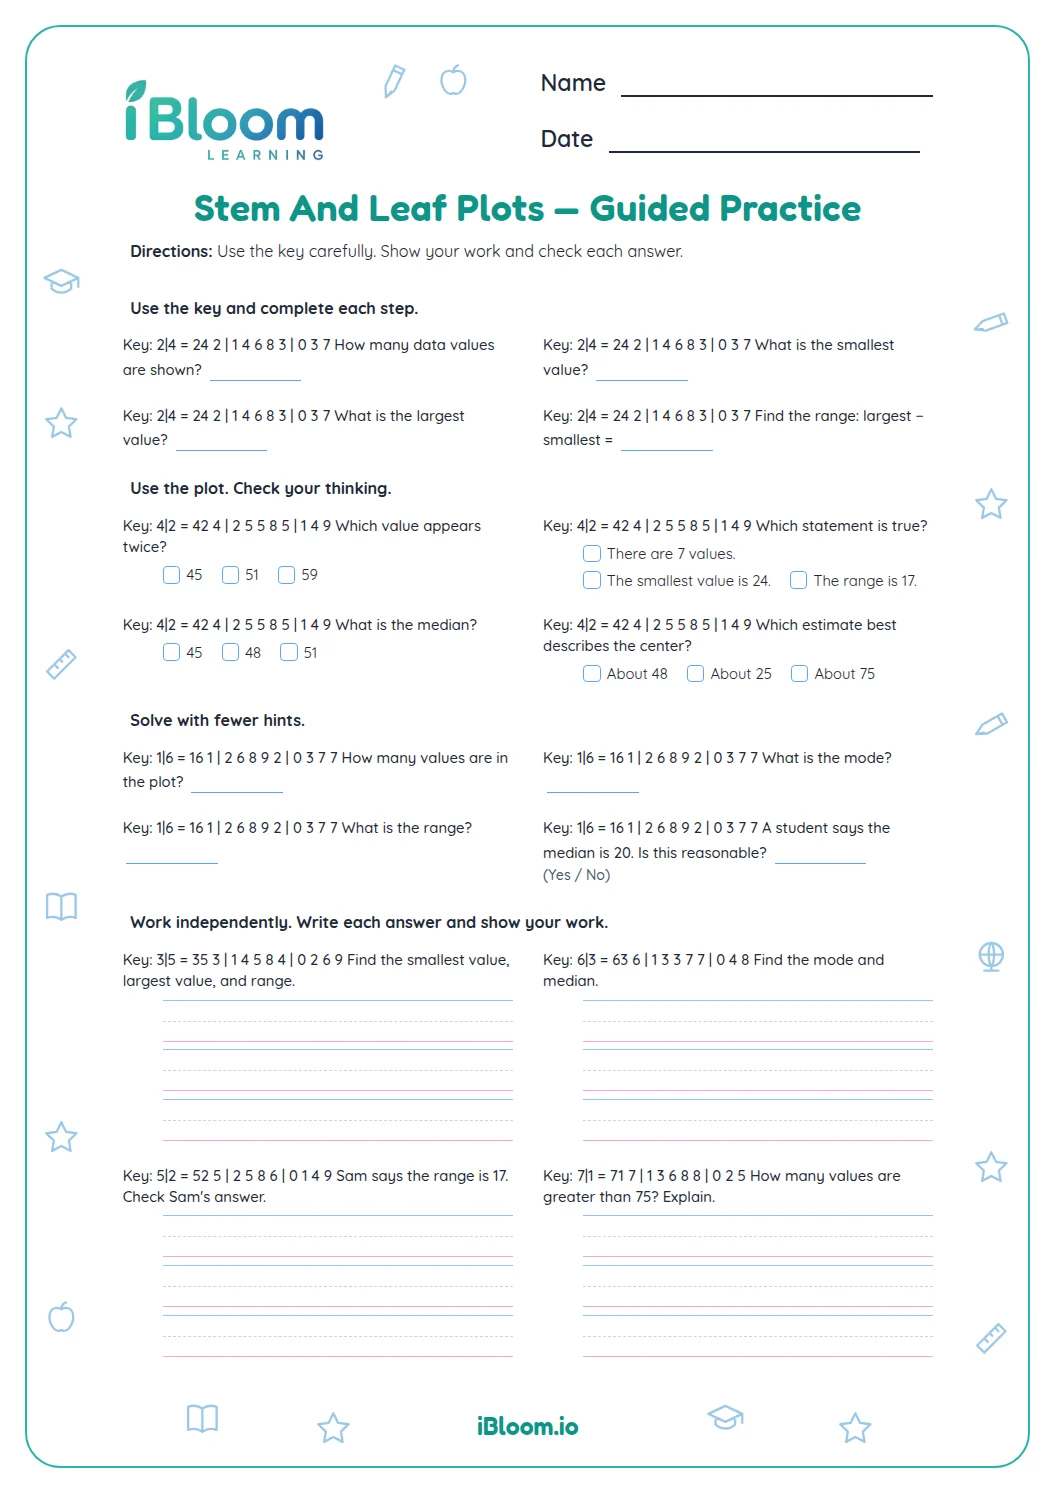
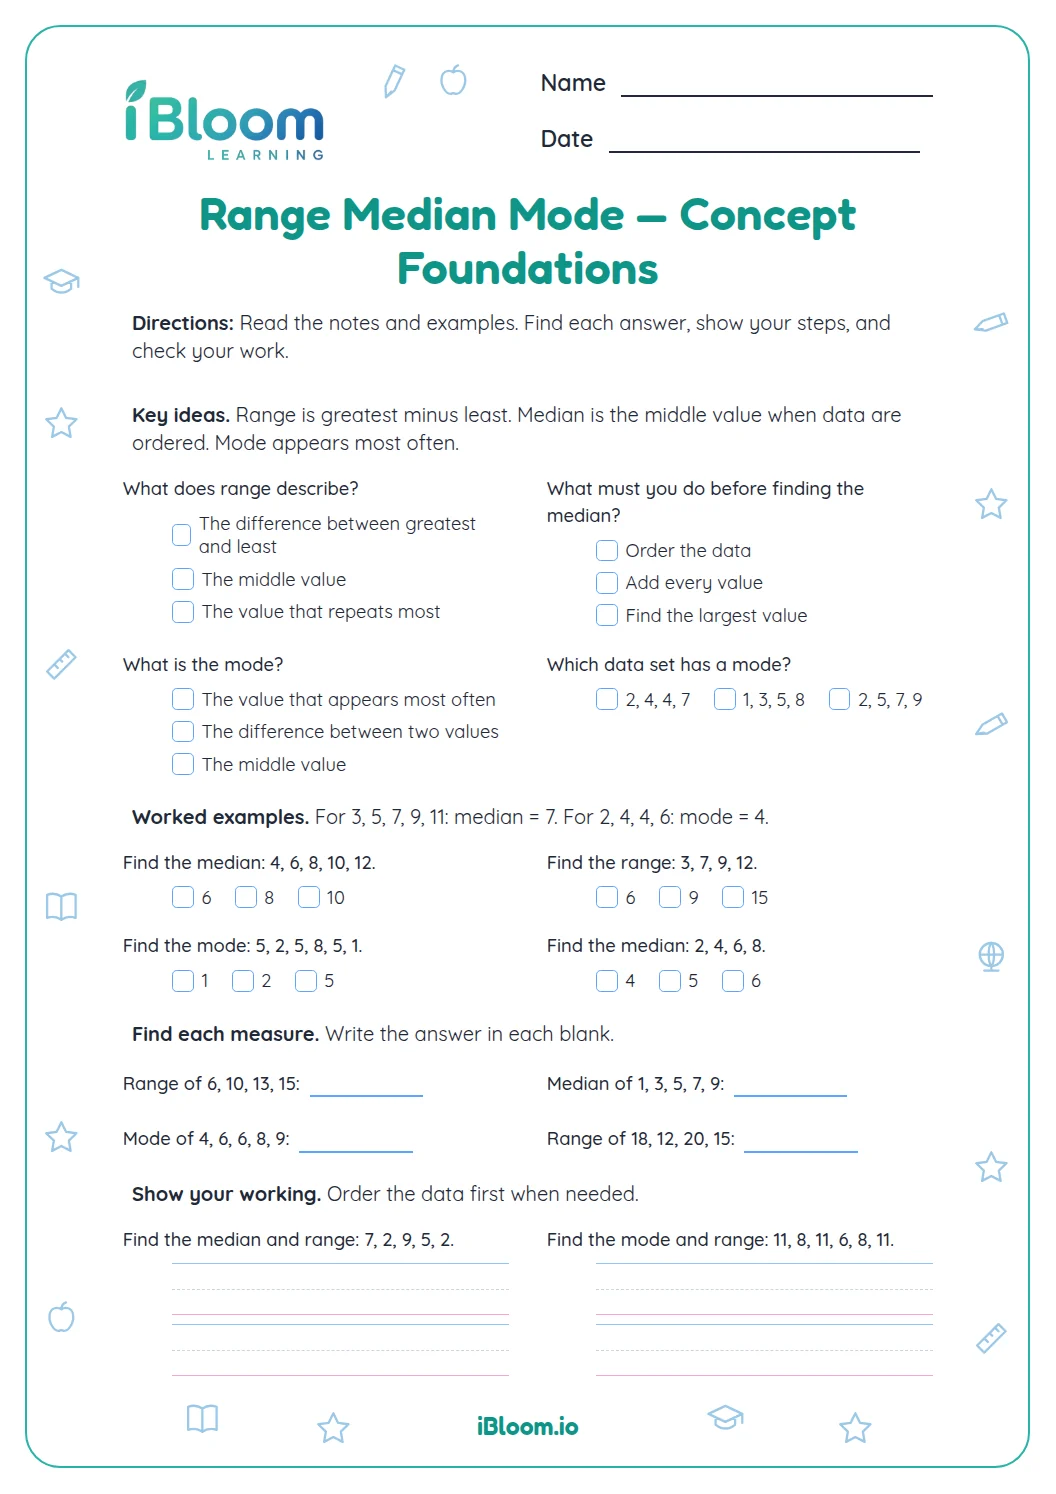
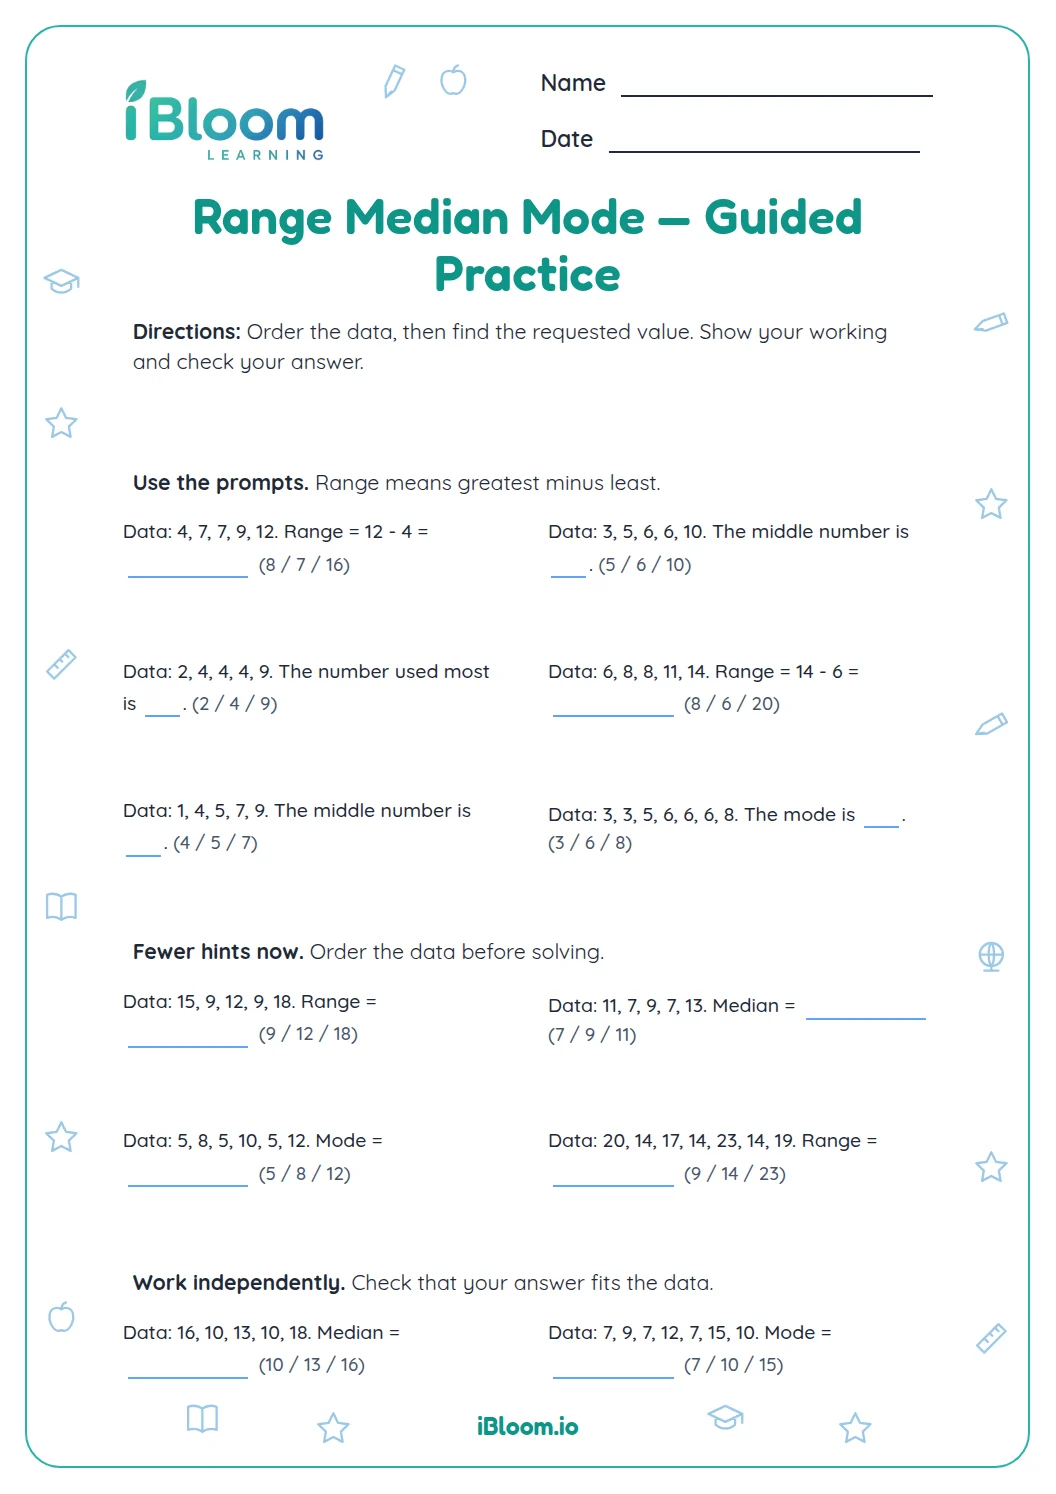
This Grade 5 worksheet gives students practice reading and creating stem-and-leaf plots with two-digit whole-number data. Students identify stems and leaves, sort values into a plot, and answer questions about the range, median, and counts in a data set. The examples use a clear tens-and-ones key and include a separate answer key.
How do stems and leaves work?
Each stem represents the tens digit, and each leaf represents a ones digit. The key 3 | 8 = 38 tells how to read every row.
How do students build a plot?
Students sort a small set of scores, then write the leaves in increasing order beside each stem.
How can a plot answer questions?
The ordered values make it possible to find a least or greatest value, count observations, and calculate the range or median.
- 1Plot: 4 | 2, 5, 8; 5 | 0, 3
- 2Values: 42, 45, 48, 50, 53
- 3Range = 53 − 42 = 11
How to use this worksheet
- 1Read the key aloud: 3 | 8 means 38.
- 2For each row, combine the stem and each leaf to name the values.
- 3When building a row, list all leaves from least to greatest.
- 4For range, subtract the least value from the greatest.
- 5For an even number of values, average the two middle values to find the median.
Mistakes to watch for
The mistake
Reversing stem and leaf to get 83 instead of 38.
The fix
Read the key first and say the tens digit before the ones digit.
The mistake
Leaving leaves unsorted.
The fix
Put the ones digits in increasing order so the row reads clearly.
The mistake
Finding the range by subtracting the stem digits only.
The fix
Use the complete greatest and least values, including their leaves.
What to practice next
Make more practice
Questions parents and teachers ask
What does the key 3 | 8 = 38 mean?
The stem 3 names the tens digit, and the leaf 8 names the ones digit. Read them together to make 38. The key gives the rule for every row on this worksheet. Have students say the complete value before they count, compare, or order values.
Why are leaves written in order?
Ordering leaves from least to greatest keeps each row readable. For example, stem 2 with leaves 1, 4, and 8 represents 21, 24, and 28. Ordered values also make it easier to locate the least and greatest values and find the middle value.
How do you find a range in a stem-and-leaf plot?
Read the smallest and largest complete values in the plot, then subtract the smaller from the larger. In question 10, the values run from 42 to 53, so the range is 11. Using both digits prevents confusing the range with the difference between stems.
How do students find the median?
First read all values in order. With an odd number of values, the middle one is the median; with an even number, average the two middle values. Question 11 has five values, so the third value, 31, is its median.
Does this printable include an answer key?
Yes. A separate answer key follows the worksheet and gives the answers to all 16 questions. It includes the ordered leaves and data interpretations so an adult can check the work after the student has completed the practice. Add these examples to the student’s own explanation of the display.
How long should students spend on this practice?
About 20 minutes is a reasonable estimate for reading keys, completing plots, and interpreting data. Students who are new to the display may take longer while they combine stems and leaves. Encourage them to check that each listed value matches its row.