


About this worksheet
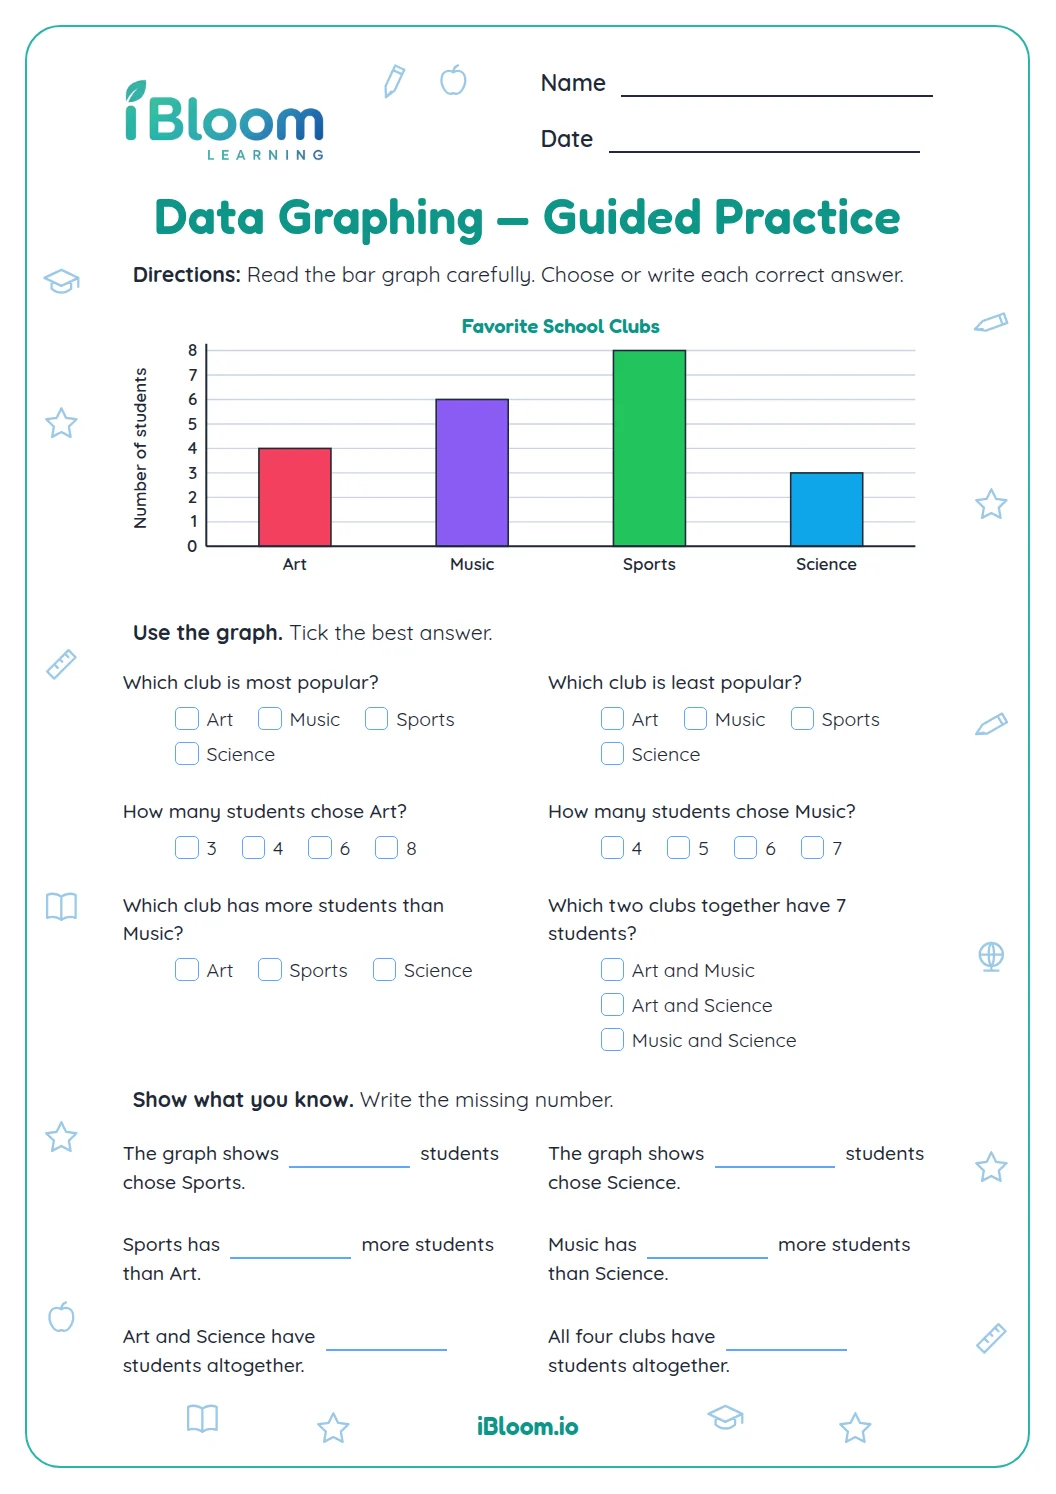
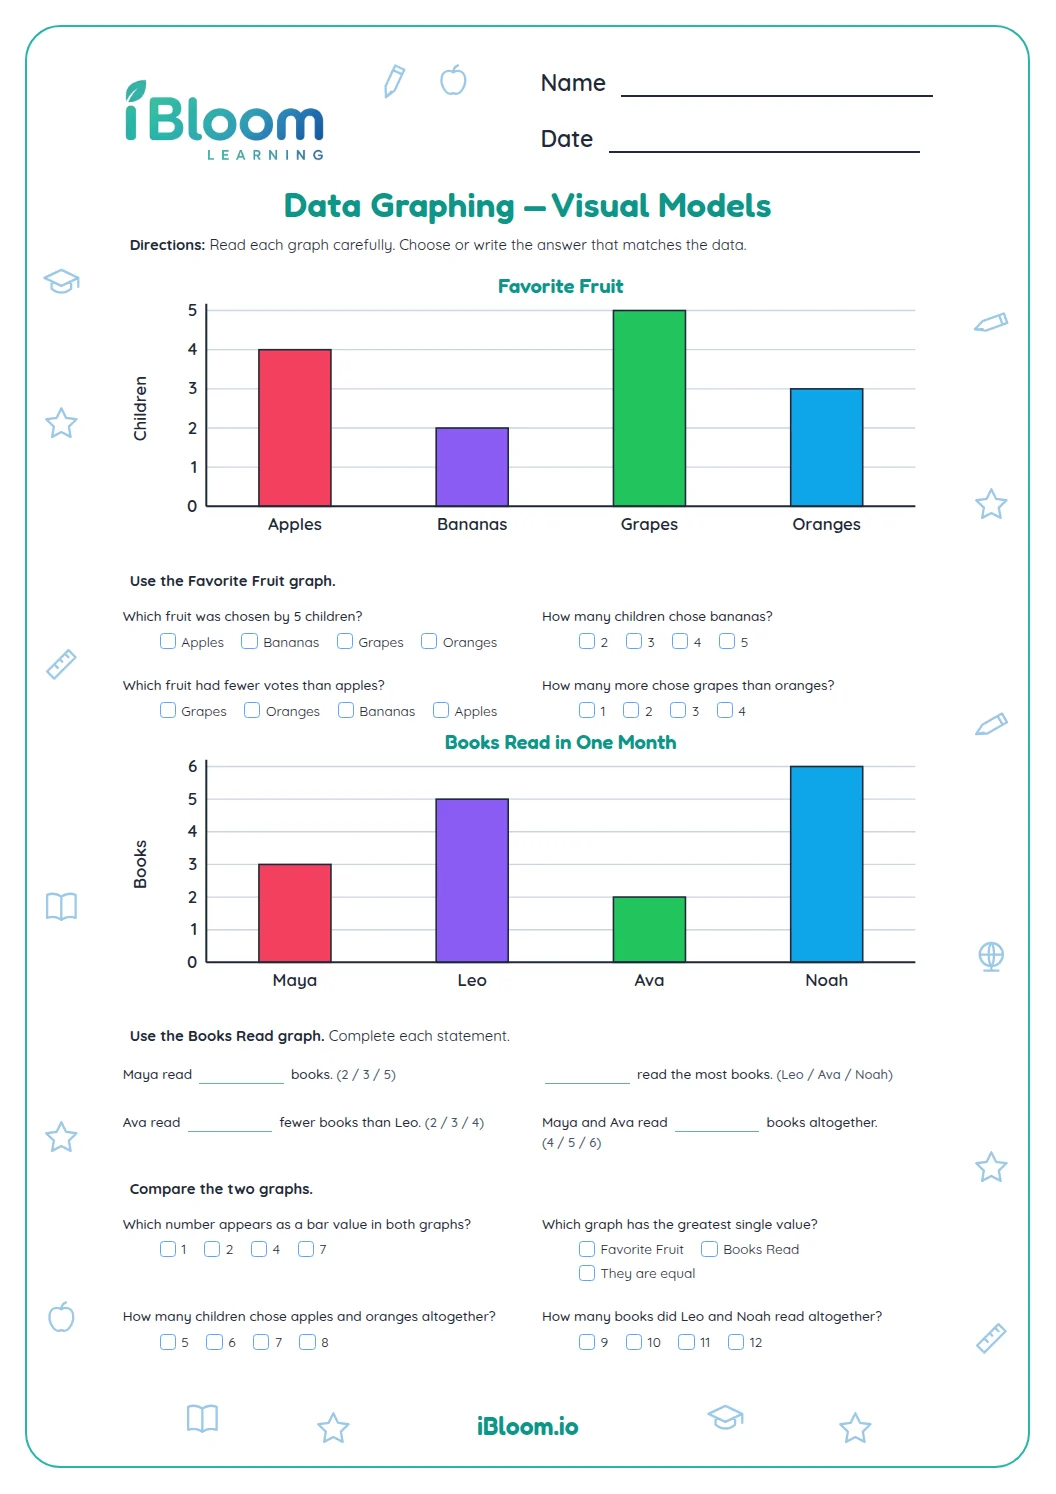
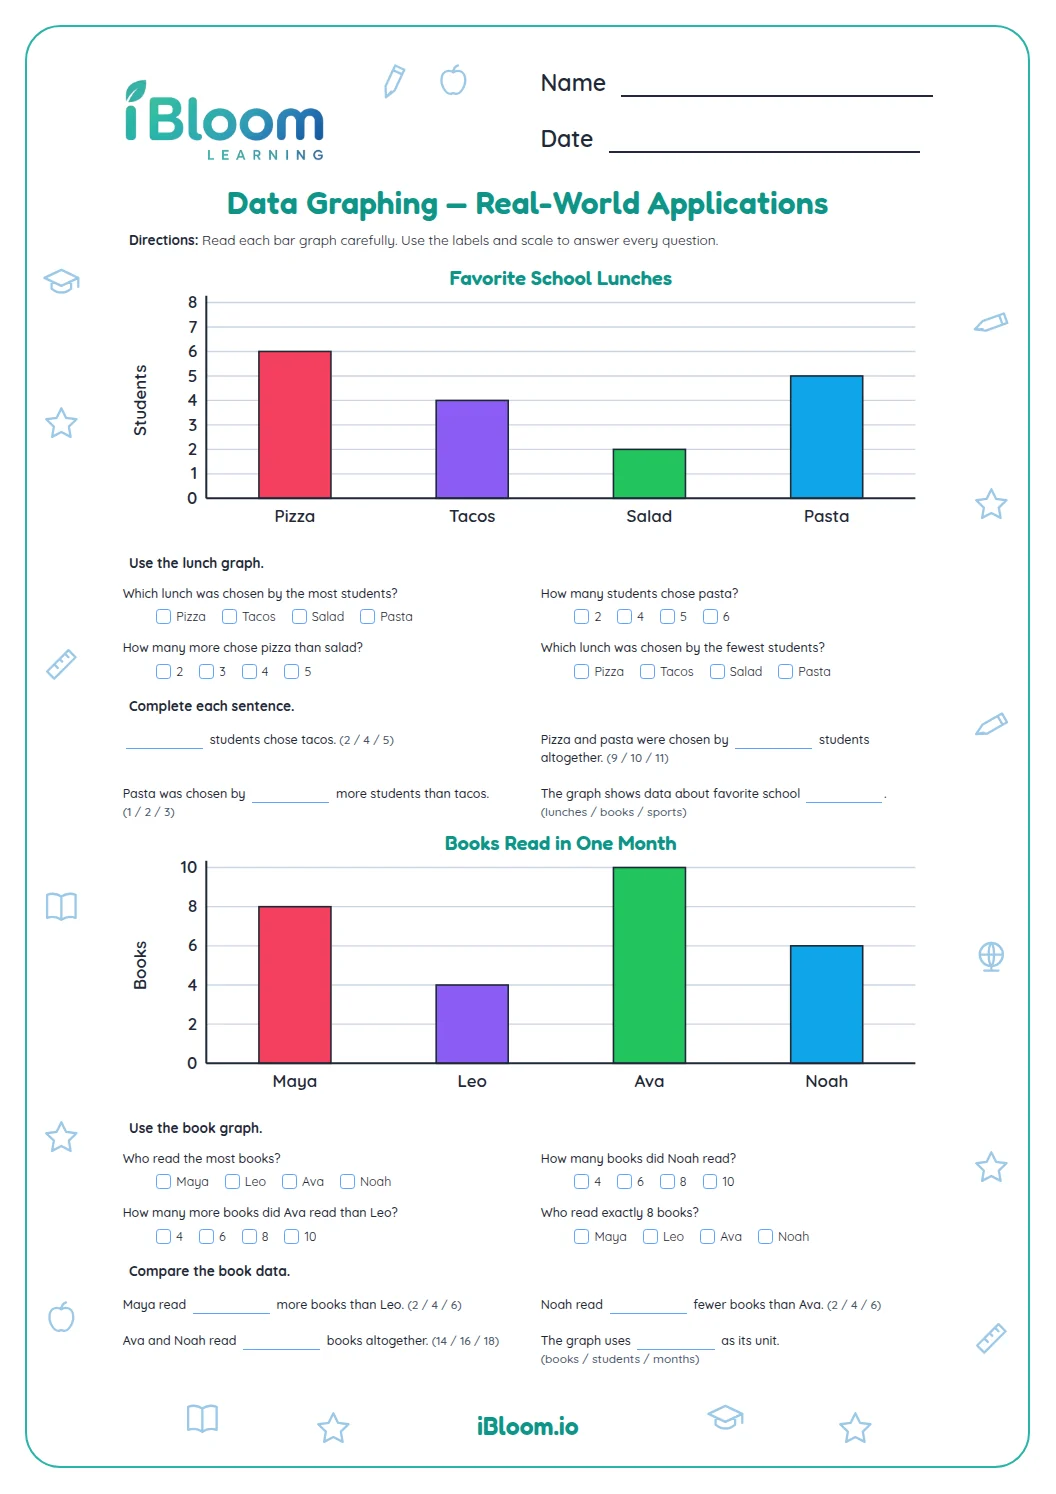
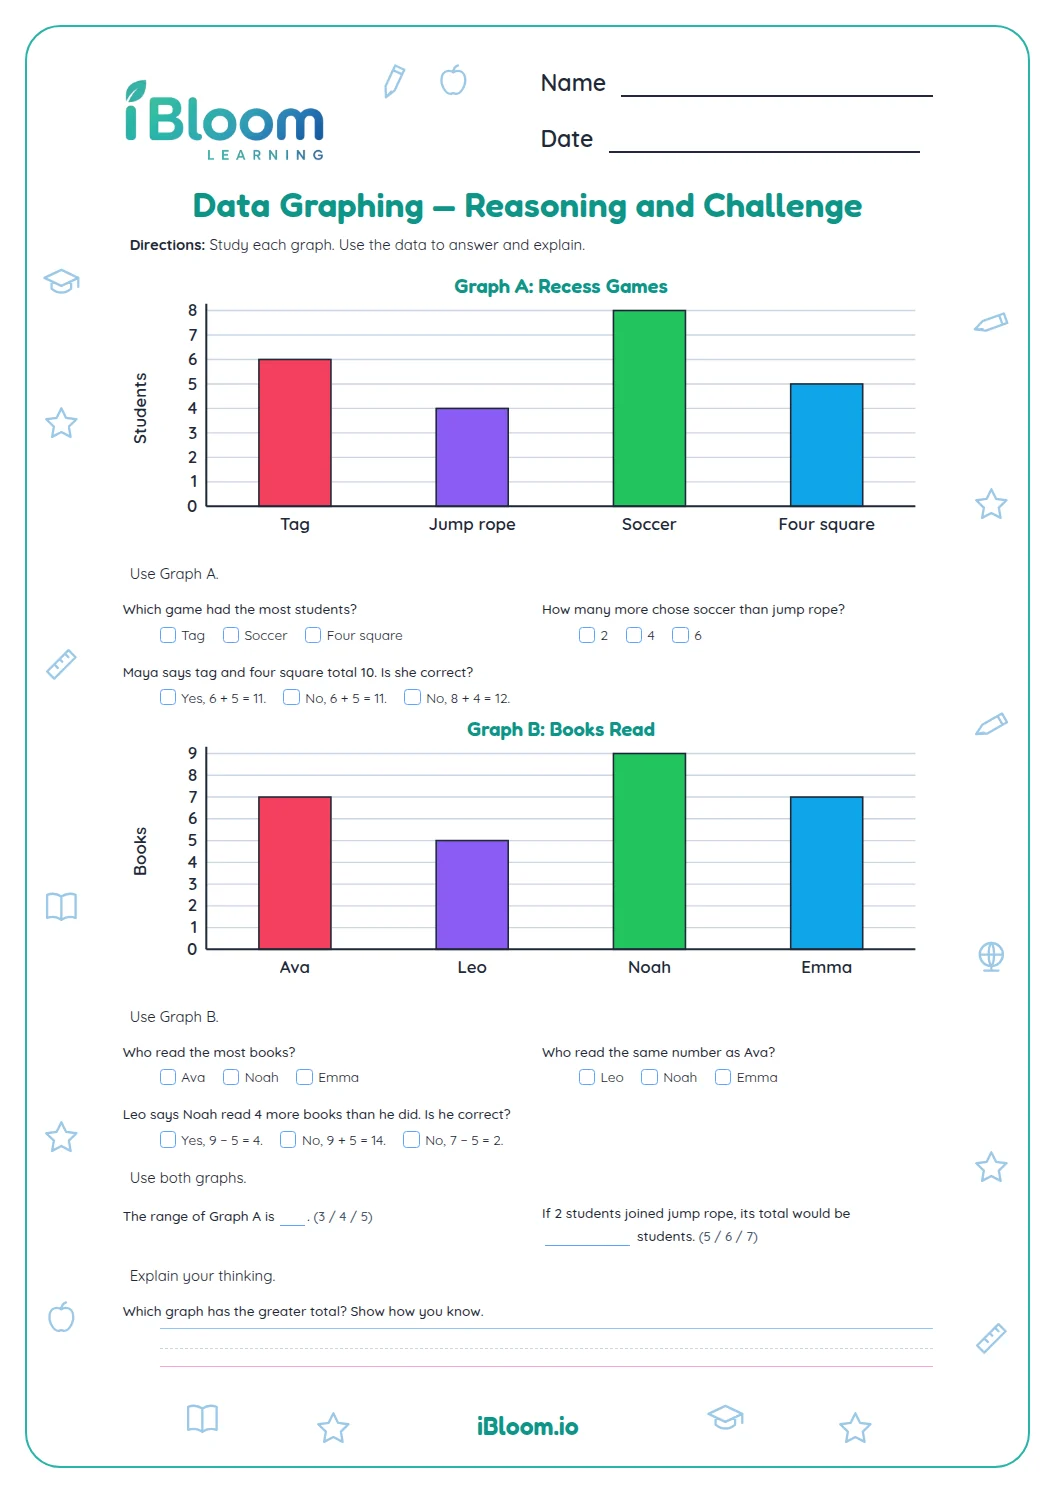
This elementary data-graphing printable has a fruit picture graph and a four-day bar graph of books read. Learners read category values, compare counts, and find totals and differences. The 20-question practice cites CCSS 2.MD.D.10 and includes a separate answer key.
Aligned to 2.MD.D.10
How do you read the fruit picture graph?
Read the row label and count that row’s fruit symbols. The key shows one picture for one vote. Question 1 asks how many apples Ava chose; her row has four apple pictures.
Look at the drawing beside each question so you use the correct fruit row.
- 1How many apples did Ava choose?
- 2Find Ava’s apple row and count its pictures.
- 3Answer: 4.
How do you read the books bar graph?
Match a day label to its bar, then follow the bar to the value axis. The Tuesday bar reaches 5, so five books were read that day.
Each bar-graph question prints the graph alongside the prompt, including the comparison and total questions.
How can graph values answer comparison questions?
For “how many more” or “how many fewer,” compare the two values and find their difference. To find a total, add the named categories or days. Read each graph directly rather than relying on a memorized value.
How to use this worksheet
- 1Read the graph title and category labels.
- 2Check the picture key or value axis.
- 3Find the category named in the question.
- 4Add values for a total.
- 5Subtract the smaller value from the larger for “how many more.”
Common mistakes and quick fixes
The mistake
Skipping the picture-graph key.
The fix
Check how many votes each picture represents.
The mistake
Reading the wrong bar.
The fix
Follow the day label up to its bar before reading the axis.
The mistake
Adding for a “how many more” question.
The fix
Find the difference by subtracting the smaller value from the larger.
Curriculum alignment
This worksheet practices the following Common Core skill.
Interpret picture and bar graphs, then solve compare and total questions from the values.
On this sheet: Learners read picture and bar graphs, compare categories, and solve totals and differences.
Show the official wordingHide the official wording
Draw a picture graph and a bar graph (with single-unit scale) to represent a data set with up to four categories. Solve simple put-together, take-apart, and compare problems using information presented in a bar graph.
What to practice next
Make more practice
Further reading
Questions parents and teachers ask
What does one fruit picture represent?
One fruit picture represents one vote, as shown by the key. To answer a question, find the named person’s row and count the pictures in the requested fruit column. The matching picture graph appears with each question that uses it.
Which fruit received the most votes?
Orange received the most votes: six. Compare the four fruit rows in the picture graph to find the largest count. The graph is printed beside each related question so children can check the labels and key each time.
How many books were read Tuesday?
The Tuesday bar reaches 5, so five books were read. Follow the Tuesday label to its bar and read the value where the top of the bar meets the axis. The worksheet repeats this graph beside its questions.
How do you answer a “how many more” question?
Read both graph values, then subtract the smaller value from the larger. For example, orange has 6 votes and banana has 2, so orange has 4 more votes. Each comparison question includes the graph needed to find its values.
How many questions are on the worksheet?
There are 20 questions about a four-category fruit picture graph, a four-day bar graph, and short data sets. Items ask for values, comparisons, and totals. Graph-reading items print the needed graph beside the question; three final items give data directly. A separate answer key is included.
What should a child check before reading a graph?
Read the graph title, labels, and key or value axis before counting. The fruit graph uses one picture for one vote, while the bar graph uses a numbered axis. These details explain what each symbol or bar value represents.