




About this worksheet
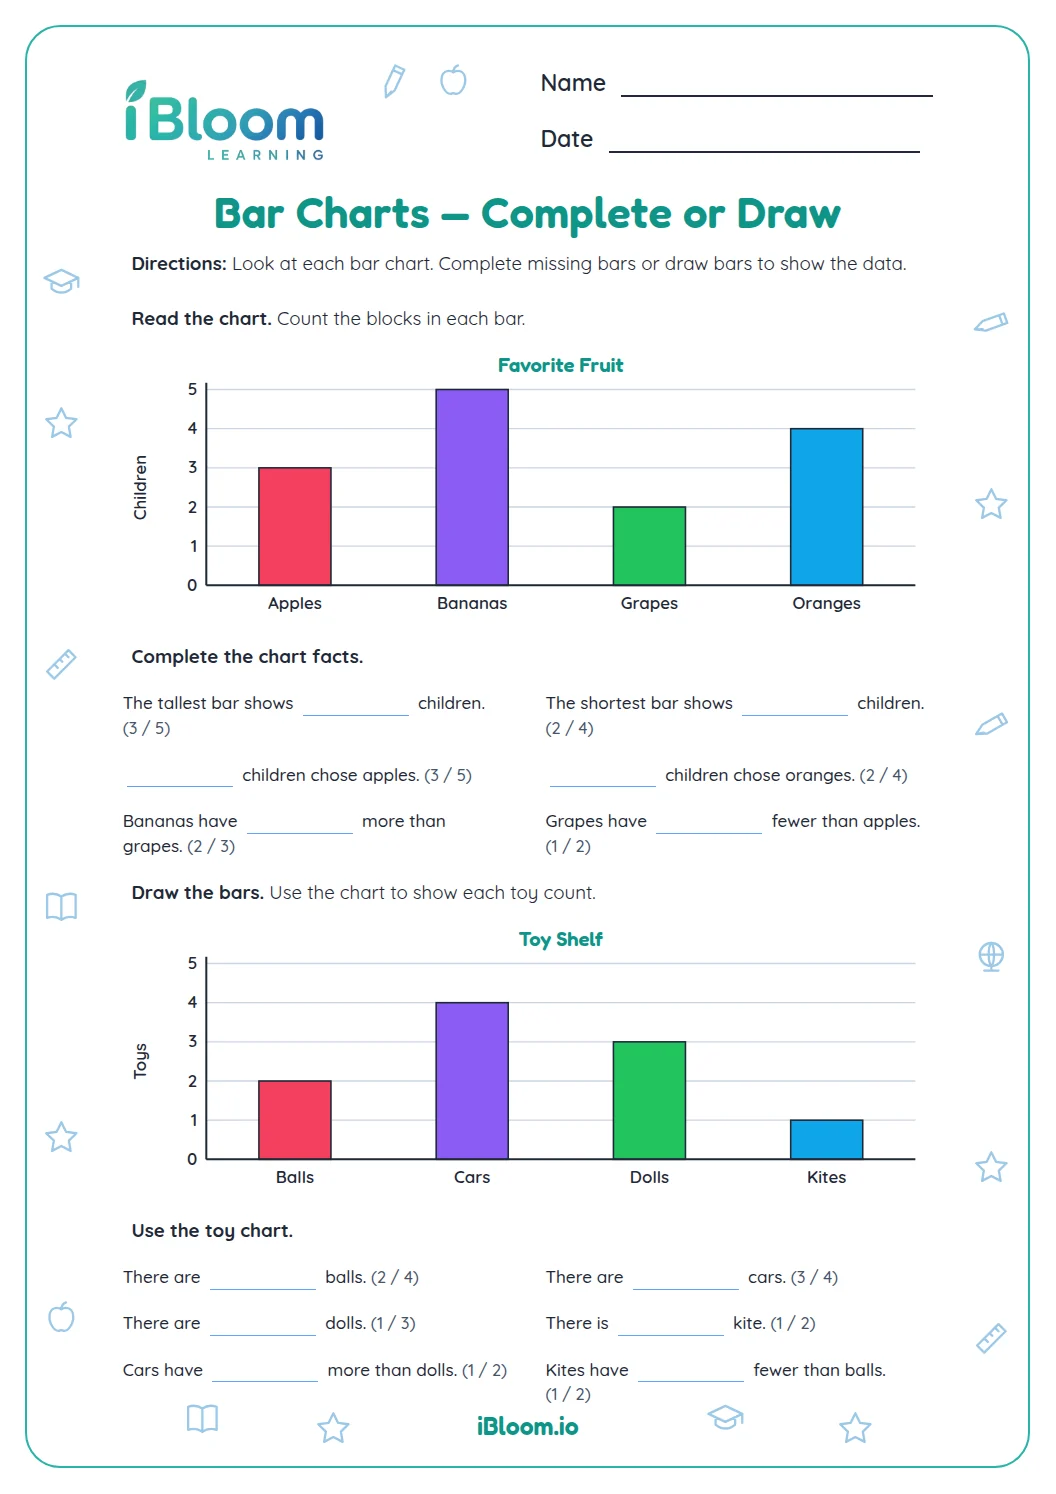
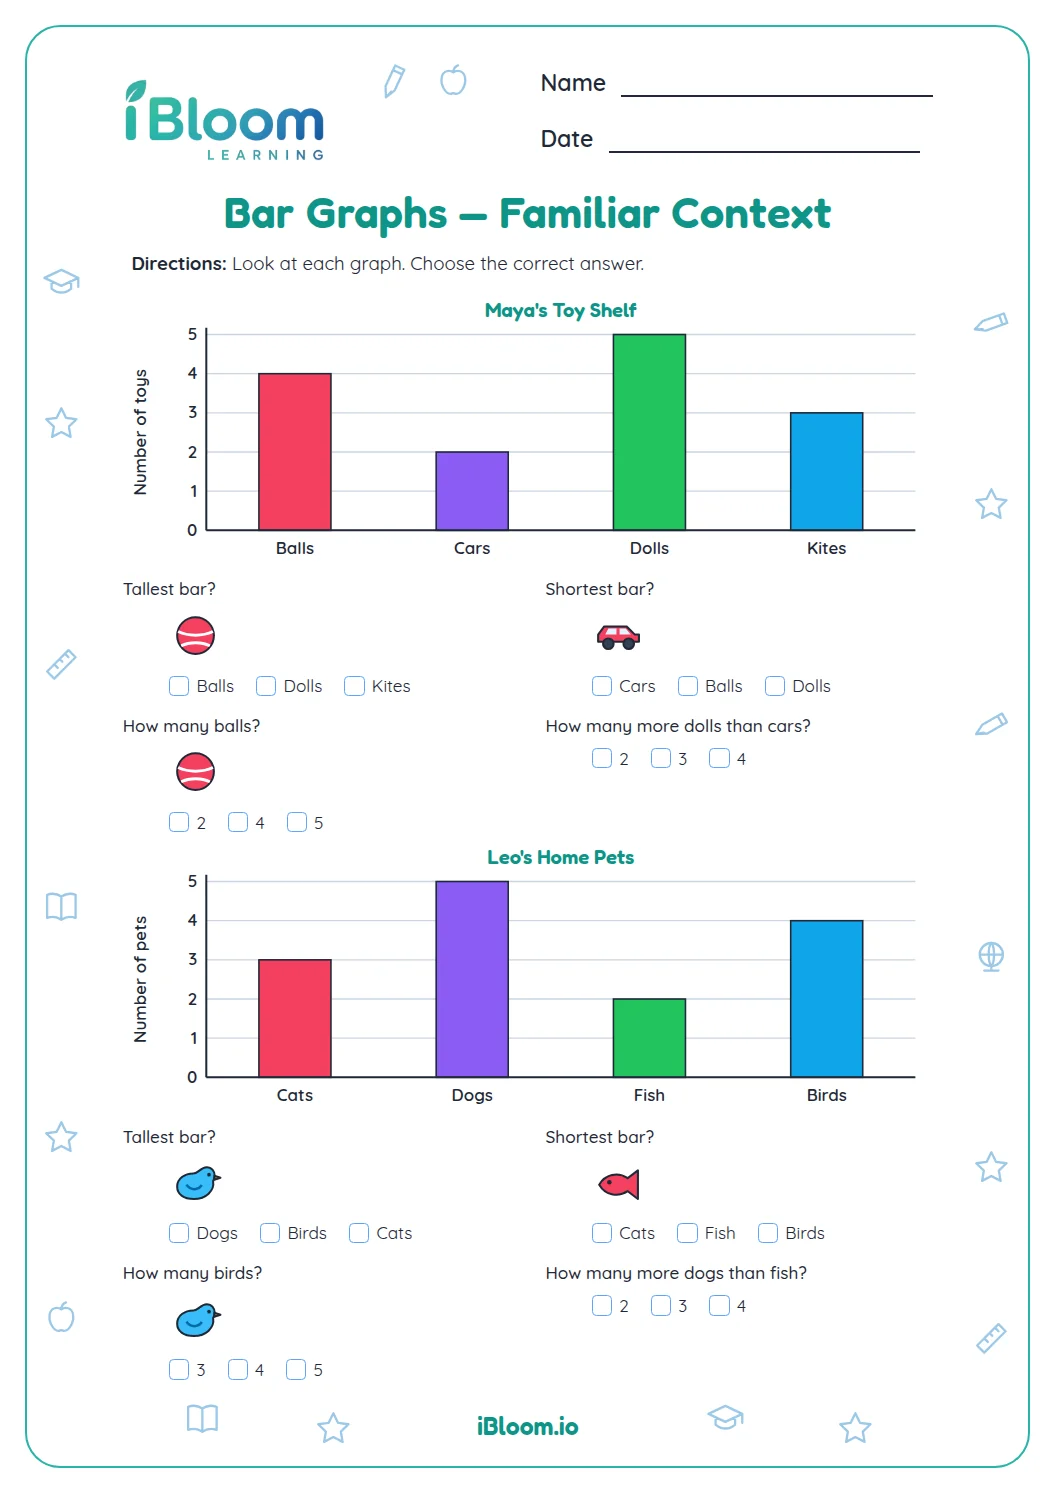
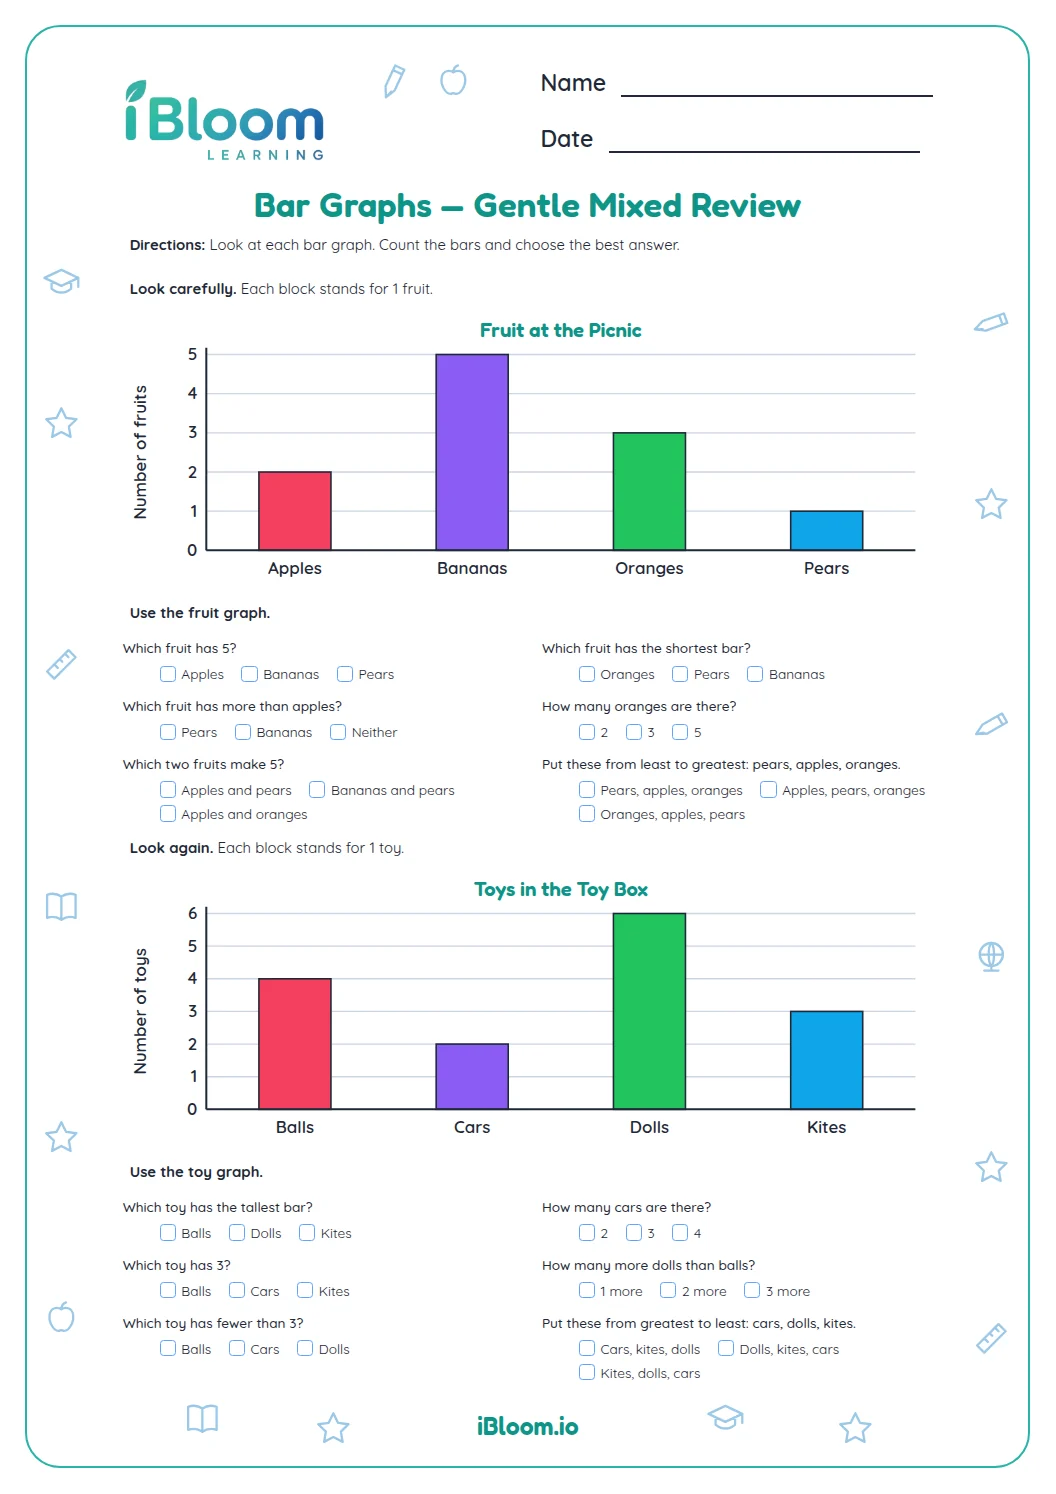
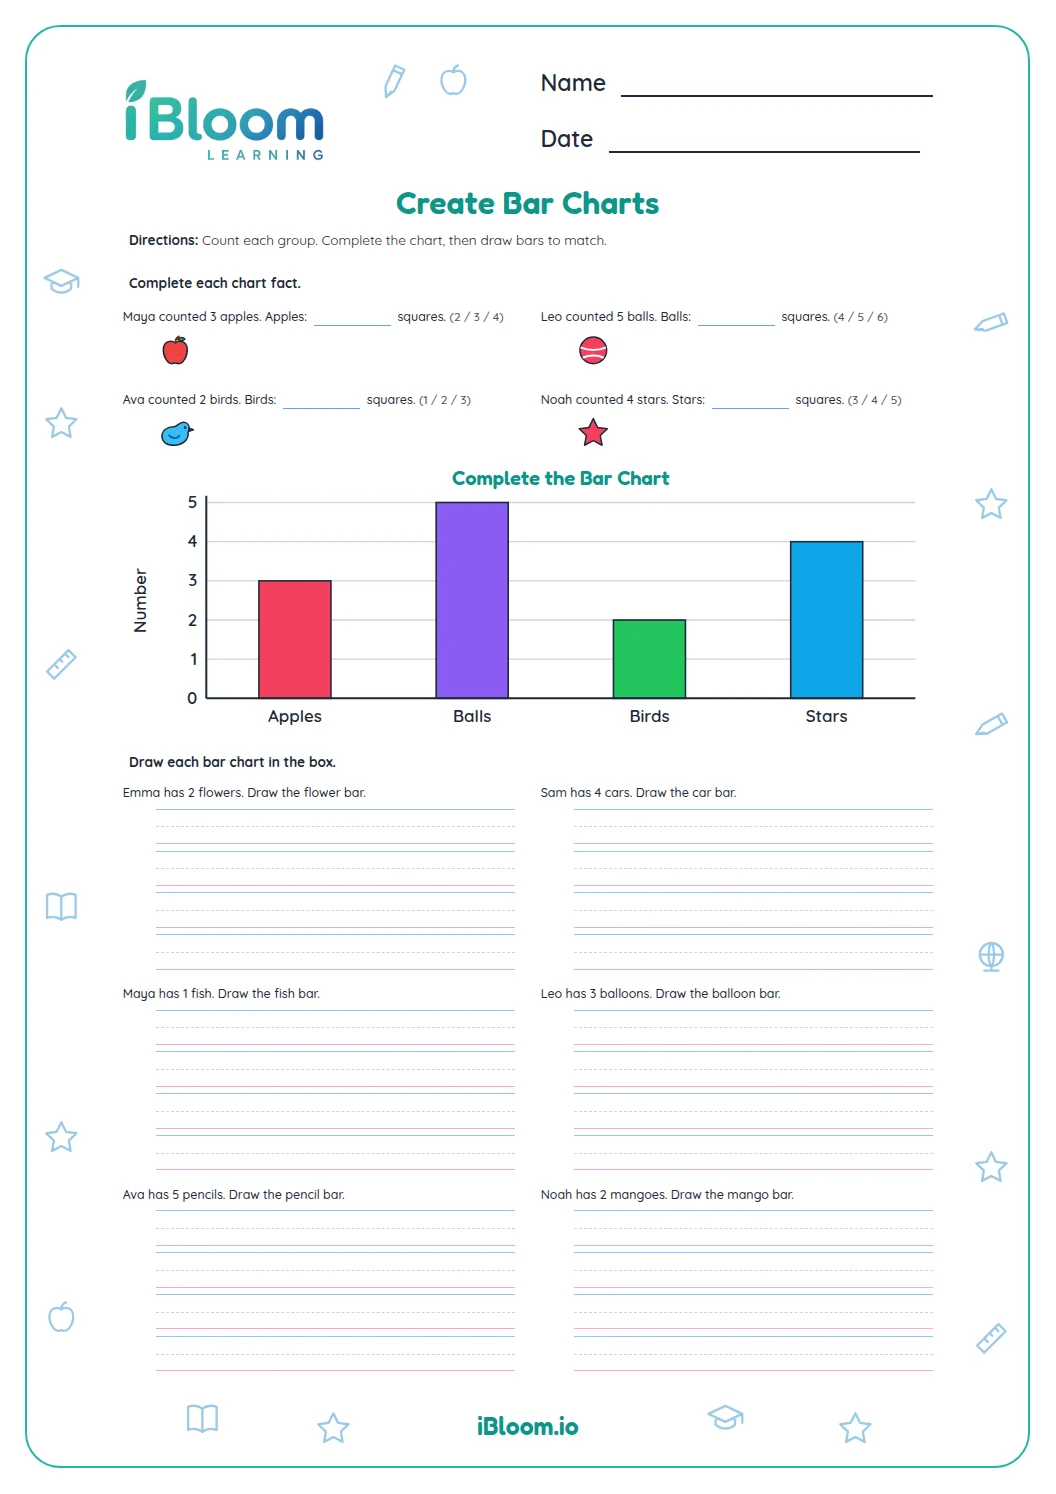
This early graphing worksheet presents two bar graphs and one picture graph about playground rides, classroom pets, and snacks. Across 14 questions, children read category counts, find the most or fewest votes, compare totals, and use a key worth two votes per snack picture. A separate answer key is included.
Aligned to K.MD.B.3
How do children read a bar graph?
Find the category label, then follow its bar to the numbered gridline. On the playground graph, the slide has 4 votes, the swing has 2, and the seesaw has 5. Comparing bar heights shows which choice has more or fewer votes.
- 1Seesaw: 5 votes; swing: 2 votes
- 25 − 2 = 3 more votes
How can children compare categories?
Read each bar’s count before comparing. Add counts when a question asks for a total, or find the difference when it asks “how many more.” The pet graph shows 3 fish votes and 2 turtle votes, for 5 together.
What does each picture mean?
The snack graph key says each picture stands for 2 votes. Count the pictures in the category row, then multiply by 2 to get its vote total. One milk picture represents 2 votes; three cookie pictures represent 6.
- 11 milk picture × 2 votes = 2 votes
How to use this graphing worksheet
- 1Name the category in the question.
- 2Point to its label and find the matching bar or picture row.
- 3Read a bar at the value axis, or count pictures and use the key.
- 4Add counts for “altogether” questions and compare counts for “how many more.”
- 5Check the response with the answer key.
Common mistakes and quick fixes
The mistake
Reading the wrong category label.
The fix
Point to the label first, then follow only its bar or row.
The mistake
Counting grid spaces instead of reading the numbered axis.
The fix
Use the number beside the bar’s top to find its vote total.
The mistake
Counting each picture as one vote.
The fix
Check the picture key; each snack picture stands for two votes.
Common Core alignment
This worksheet gives students practice with K.MD.B.3 through the questions on the sheet.
Count items in categories and compare categories by their counts.
On this sheet: Count items in categories and compare categories by their counts.
Show the official wordingHide the official wording
Classify objects into given categories; count the numbers of objects in each category and sort the categories by count.
What to practice next
Make more practice
Further reading
Questions parents and teachers ask
How do children read a bar graph?
Start with the category label, then trace its bar to the value axis. The playground graph shows 4 slide votes, 2 swing votes, and 5 seesaw votes. Children can point to the label and gridline before saying the count. The graph labels and numbers provide the information needed.
What does each picture stand for?
In the snack graph, one picture represents 2 votes. Count the pictures in a row and multiply by 2 to find the total. The milk row has one picture, so it represents 2 votes; the cookie row has three, or 6 votes.
How can children find how many more votes?
Read the two category totals and subtract the smaller from the larger. In the ride graph, the seesaw has 5 votes and the swing has 2, so 5 − 2 = 3 more votes for the seesaw. This comparison uses the counts shown by the two bars.
Can an adult read the questions aloud?
Yes. An adult can name a category while the child points to its bar or picture row and counts the votes. This keeps the focus on connecting the labels with quantities. The answer key lets an adult check the child’s response.
How many graphs and questions are on the sheet?
The printable includes two bar graphs, one picture graph, and 14 questions. Children identify most and fewest categories, read counts, combine votes, compare two categories, and use the picture graph’s two-vote key. The three graphs use small, whole-number vote totals.