


About this worksheet
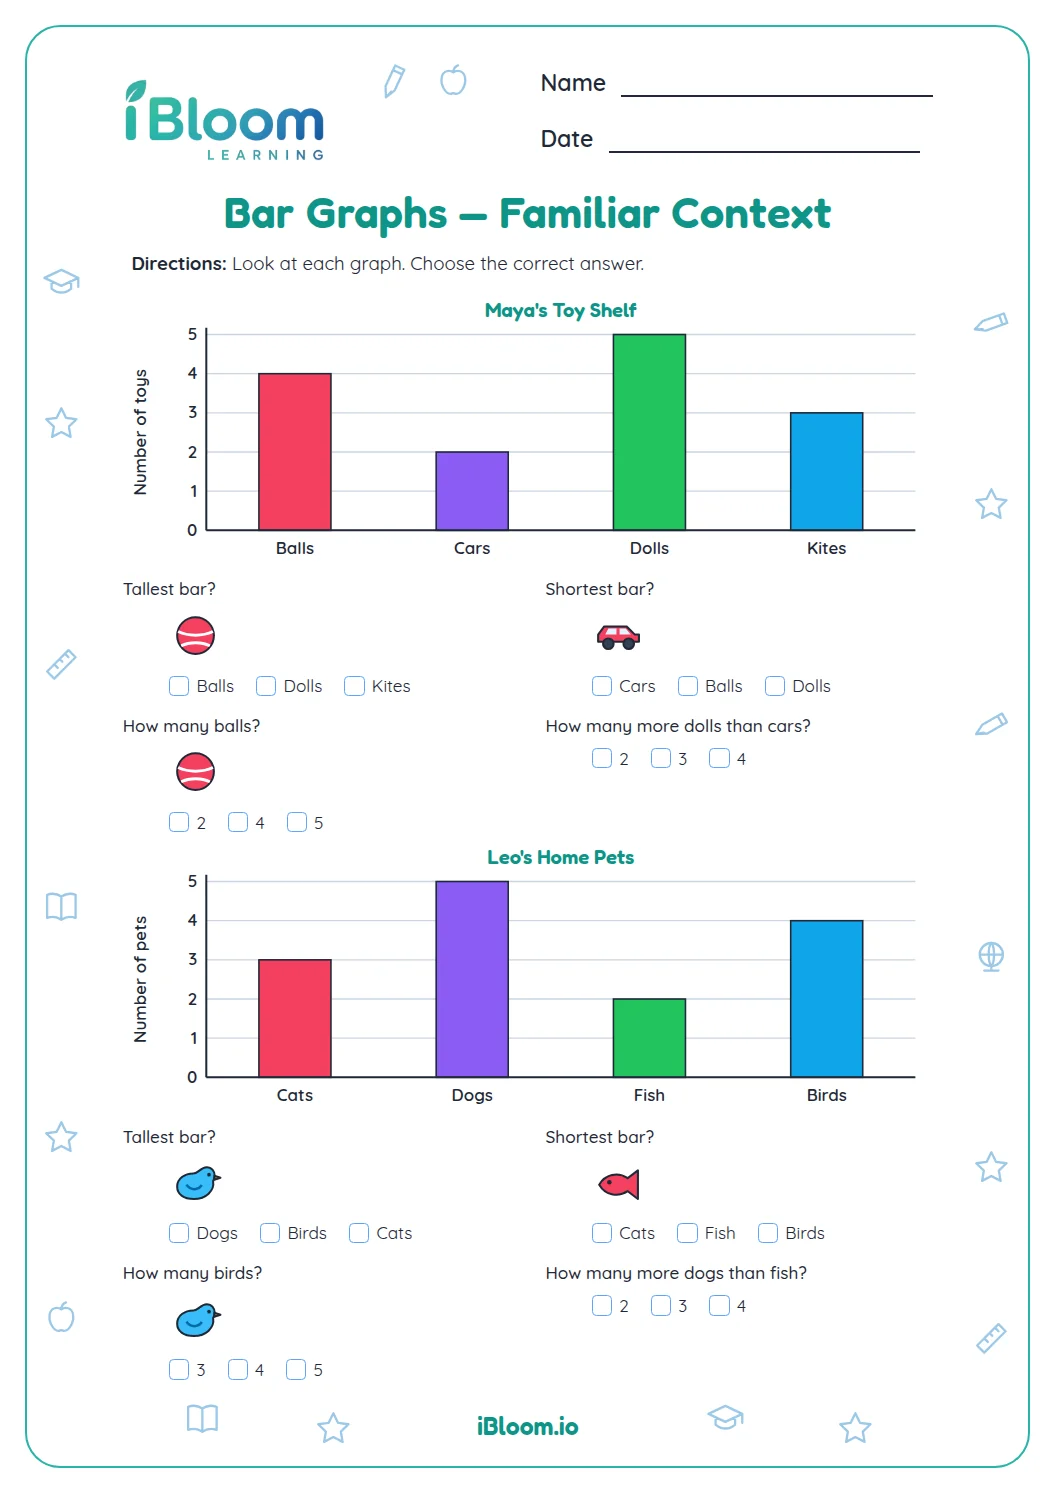
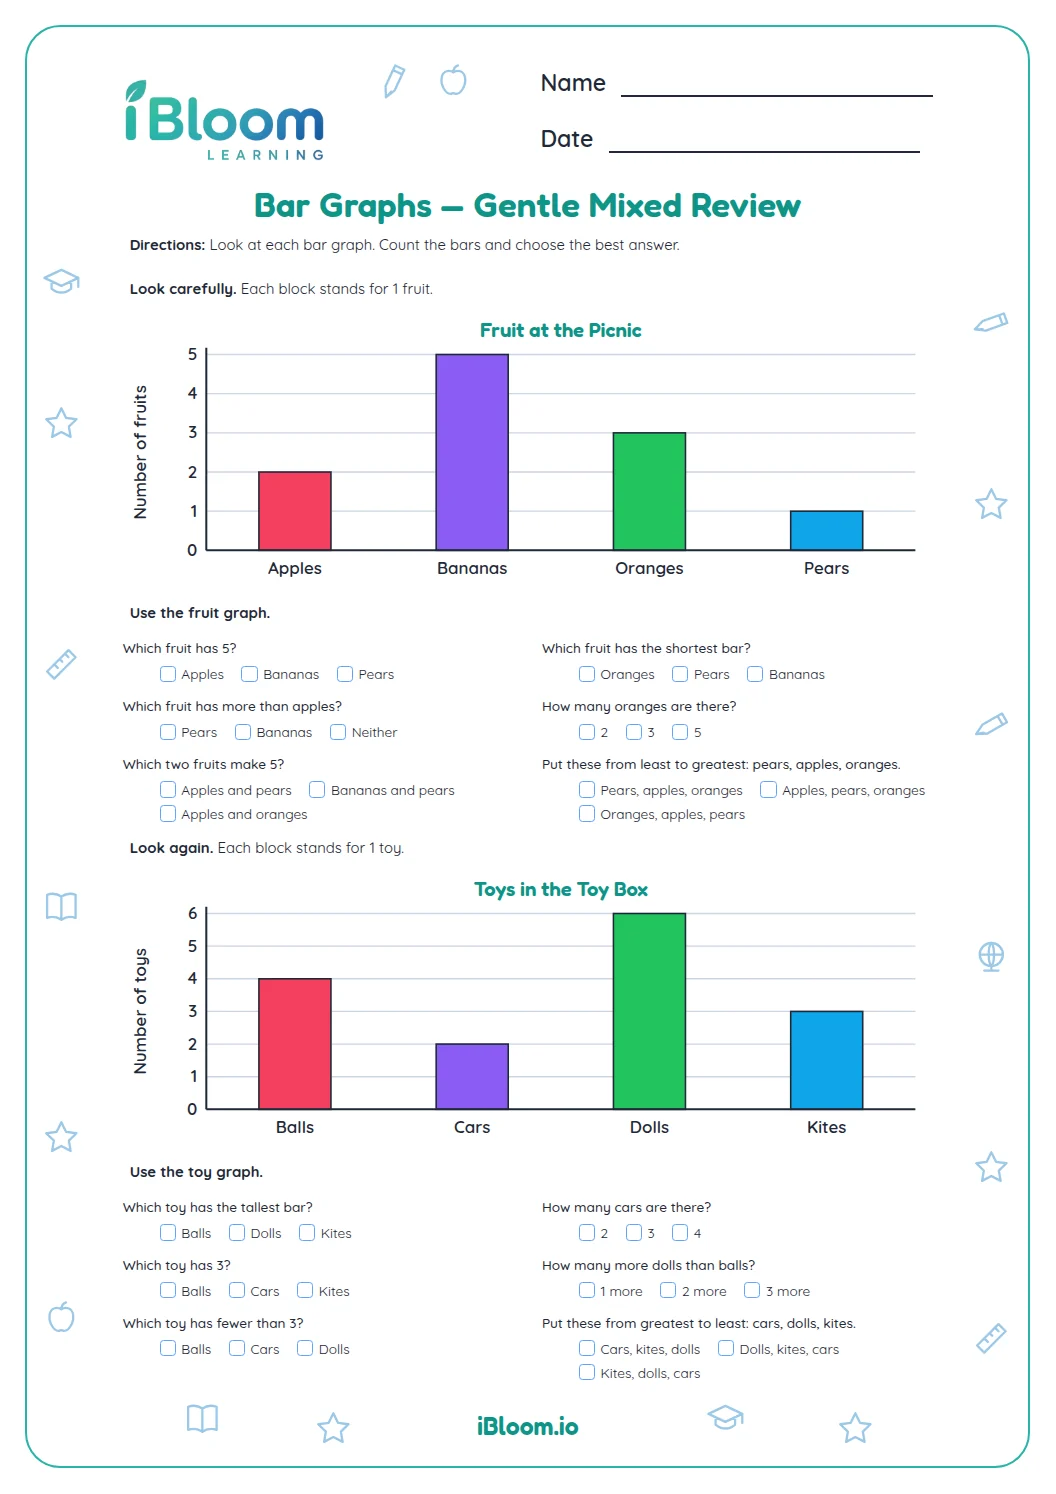
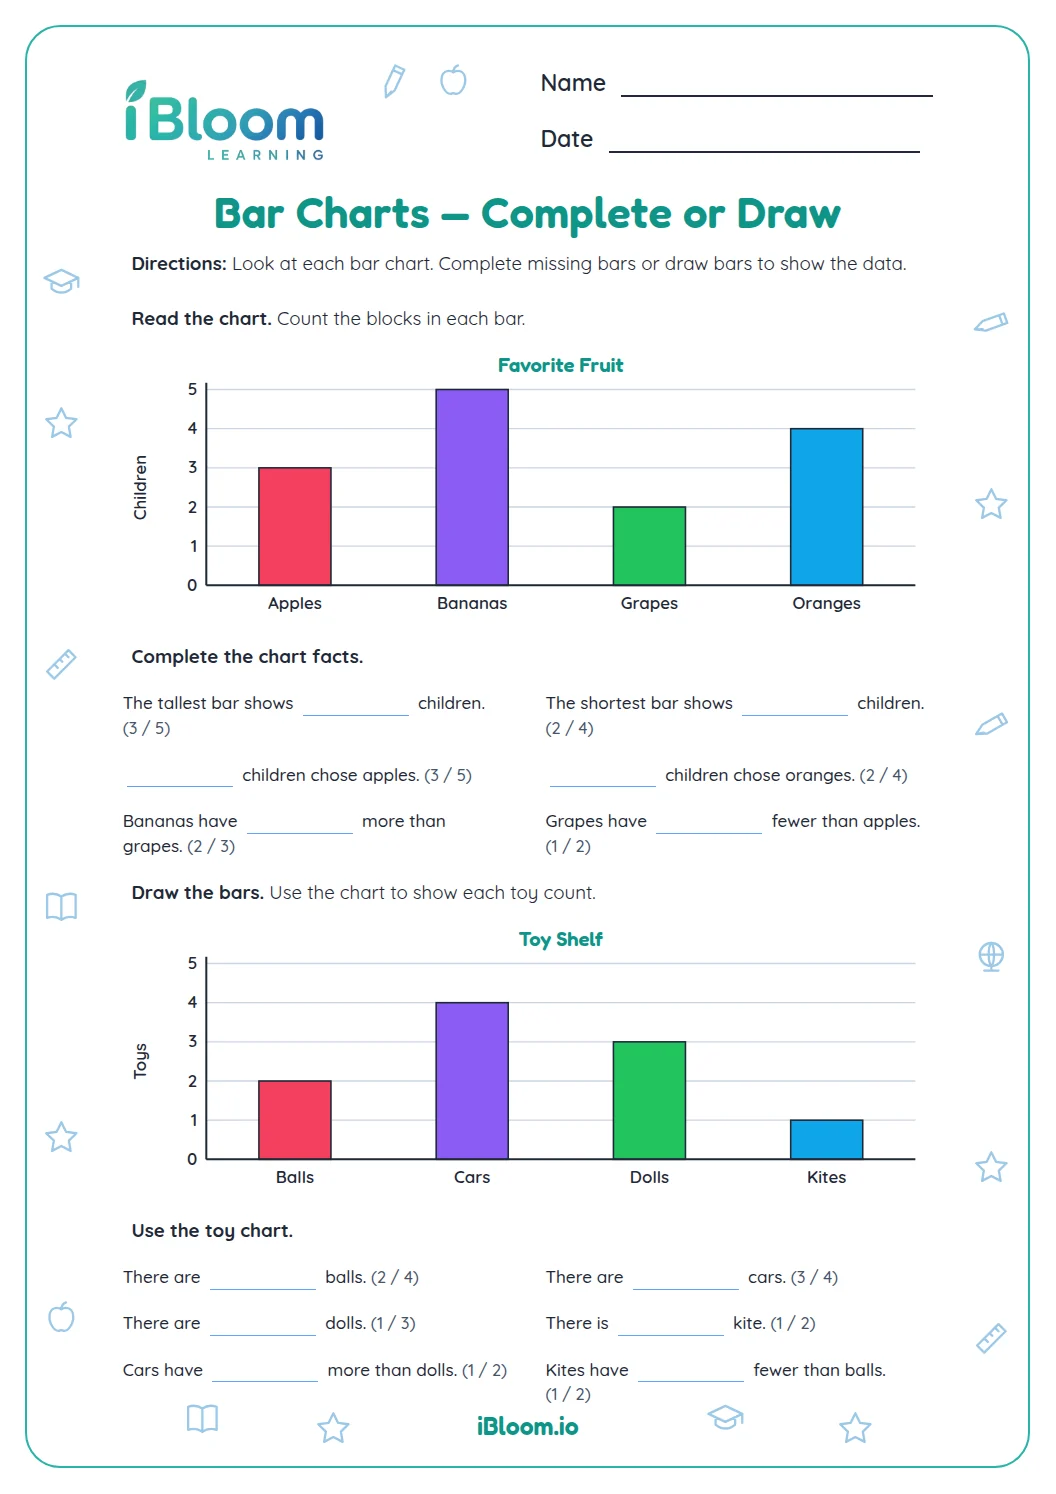
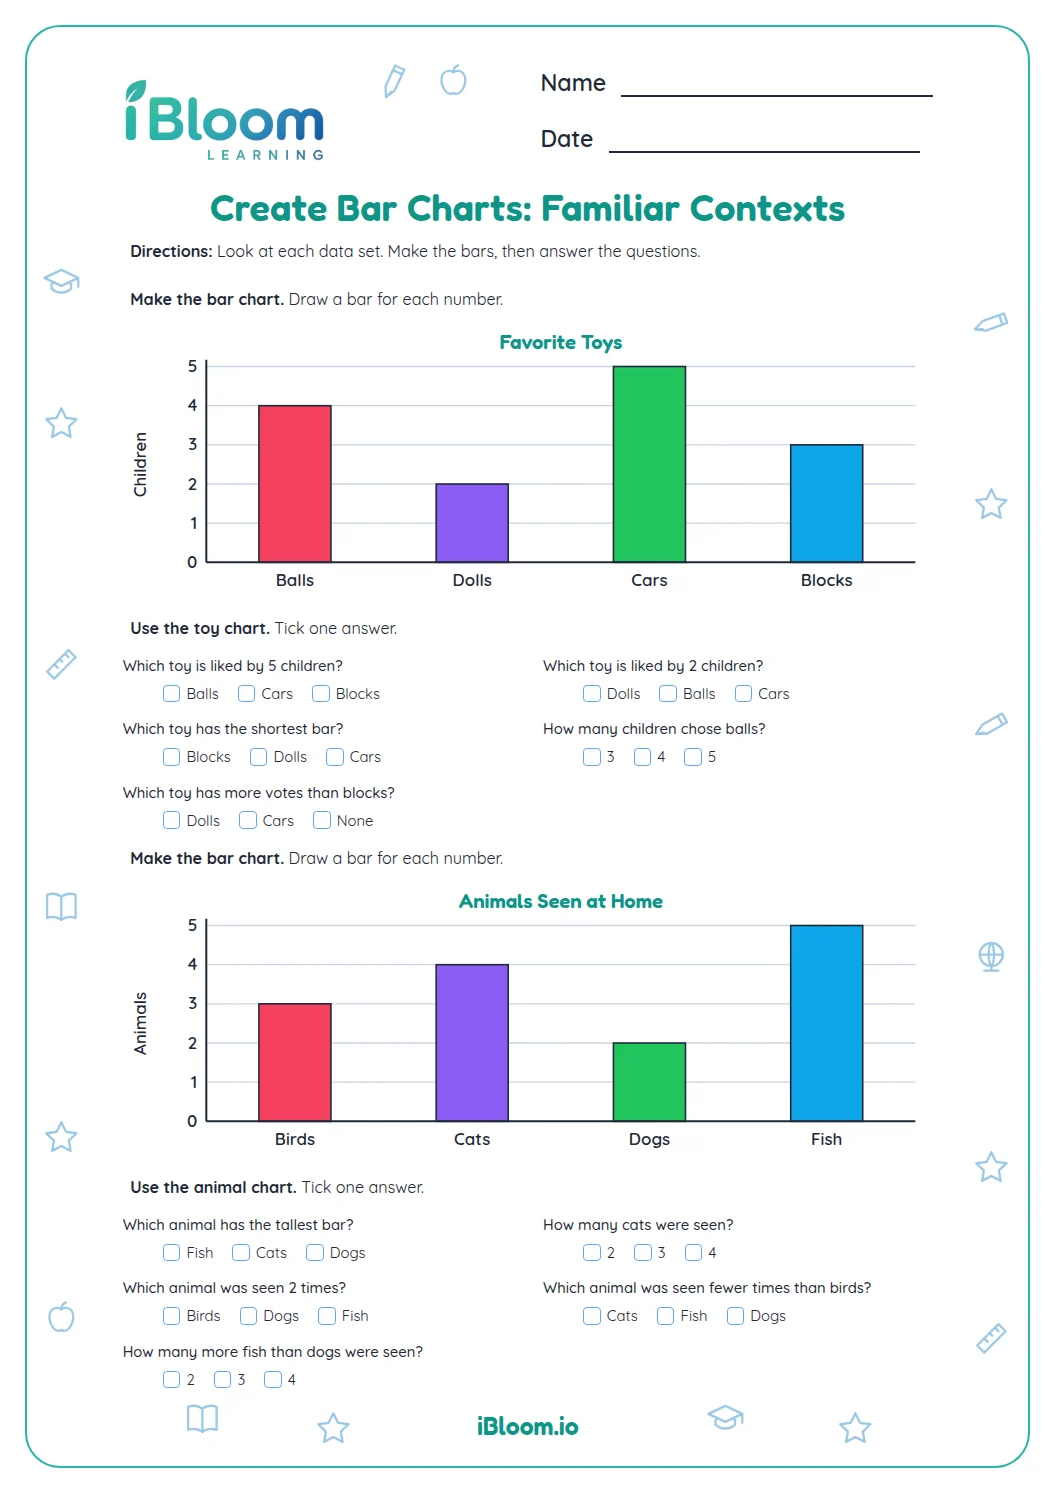
This printable Kindergarten worksheet has one Favorite Pets bar graph, 13 fill-in questions, and one short graph-drawing task. Learners read category counts, compare bars, find totals, and draw bars from vote totals. The separate answer key lists responses and sample bar heights. The practice connects to CCSS K.MD.B.3.
Aligned to K.MD.B.3
How do children read a bar graph?
Find a category name, then follow its bar to the numbered value axis. Favorite Pets shows 4 dog votes, 2 cat votes, 3 fish votes, and 5 bird votes. The tallest bar has the most votes.
How can a graph answer a comparison question?
Question 5 compares Dogs and Cats. Dogs has 4 votes and Cats has 2, so 4 − 2 = 2 more dog votes. Read both bar heights before subtracting.
- 1Dogs: 4 votes; Cats: 2 votes
- 24 − 2 = 2
- 3Dogs has 2 more votes.
How can you find a total from the bars?
For a combined total, read the named categories and add their values. Dogs and Cats have 4 + 2 = 6 votes altogether.
What should the drawn graph include?
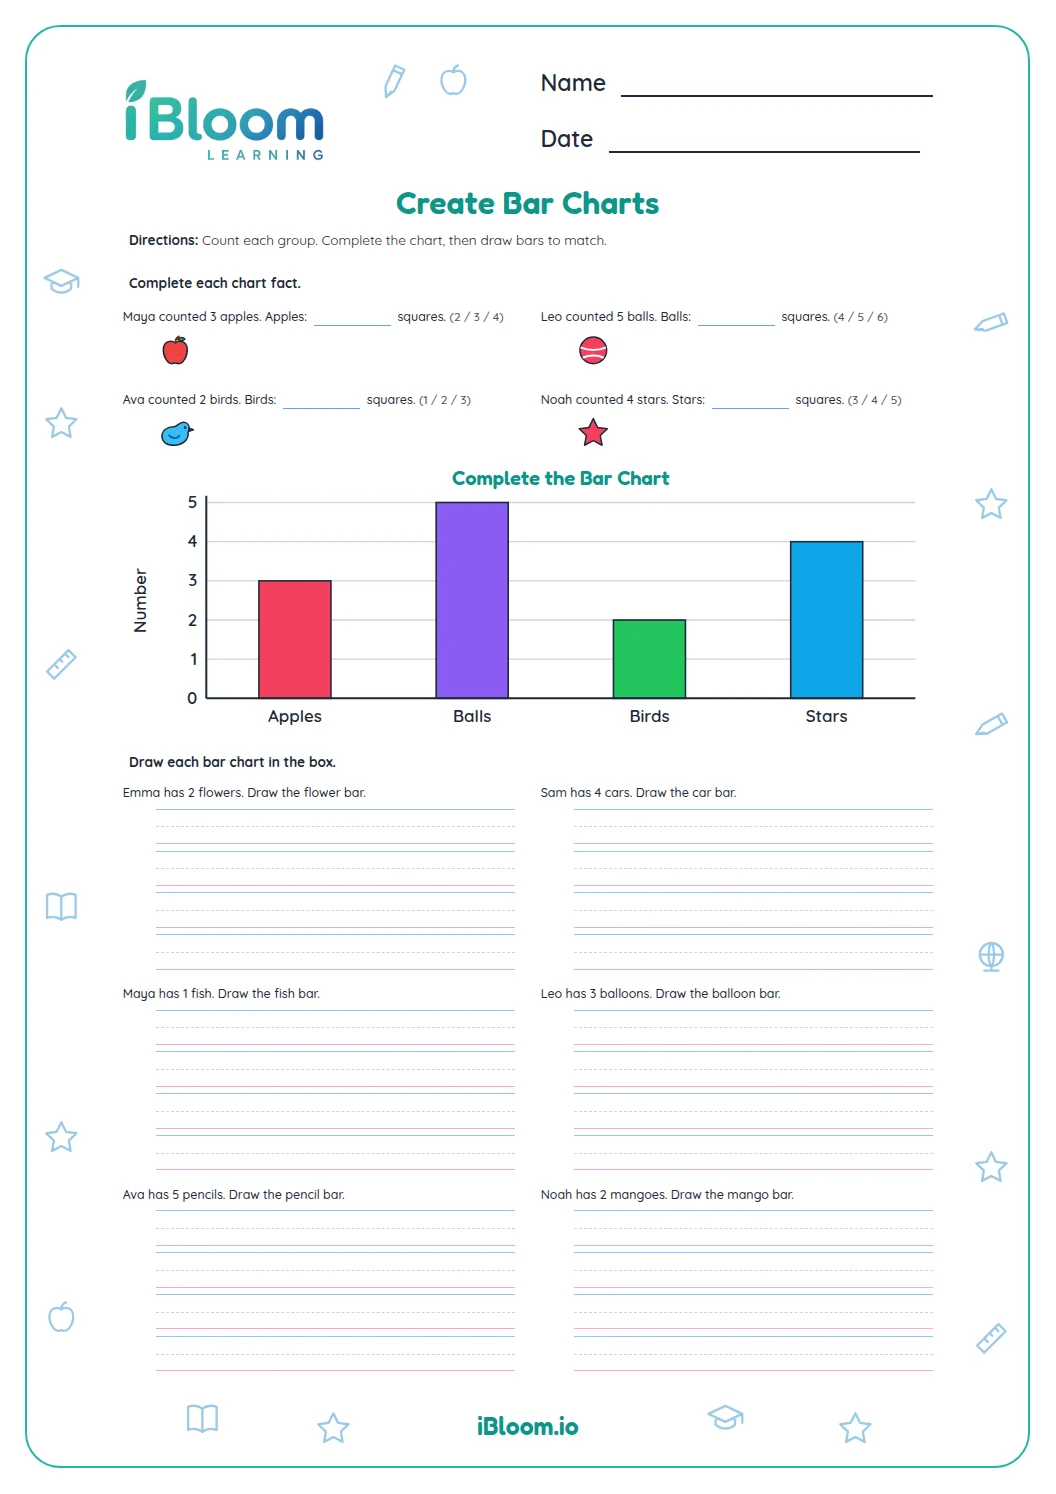
The final task asks for three labeled bars: Birds reaches 2, Cats reaches 4, and Dogs reaches 3. Use one square for each vote and keep all bars on the same scale.
How to use this worksheet
- 1Read the graph title and category labels.
- 2Follow a bar to the numbered value axis.
- 3For a total, add the values named in the question.
- 4For how many more or fewer, subtract the smaller count.
- 5Check each response with the answer key.
Common mistakes and quick fixes
The mistake
Reading the label of the tallest bar as its number.
The fix
Follow the bar to the numbered axis; the label names the category.
The mistake
Adding the wrong categories for a total.
The fix
Point to each category named in the question before adding its value.
The mistake
Making every drawn bar the same height.
The fix
Use the vote total for each pet as its height on one shared scale.
Common Core alignment
This worksheet gives learners practice with the following Common Core skill.
Count and compare category totals represented in the graphs.
On this sheet: Learners count graph categories, compare totals, and sort categories from most to fewest.
Show the official wordingHide the official wording
Classify objects into given categories; count the numbers of objects in each category and sort the categories by count.
What to practice next
Make more practice
Further reading
Questions parents and teachers ask
How many graphs are on the worksheet?
One printed graph shows four favorite-pet categories. Children use its bars to answer 13 questions about counts, combined totals, and comparisons, then draw a second graph from three vote totals. The separate answer key lists each response and sample bar heights.
What does the tallest bar mean?
The tallest bar represents the category with the greatest count. In Favorite Pets, Birds has 5 votes, more than Dogs with 4, Fish with 3, and Cats with 2. Read the value from the numbered axis. An adult can read the prompt aloud and review the choices with the learner.
How many questions and pages are included?
There are 14 questions: 13 fill-in graph-reading questions and one graph-drawing task. They use the Favorite Pets graph for counts and comparisons, then ask children to draw bars for a new set of votes. The answer key gives sample bar heights.
How do children find how many more votes a pet received?
Read both bar values and subtract the smaller count from the larger one. For Dogs and Cats, compare 4 with 2: 4 − 2 = 2. “How many more” asks for the difference, not the combined total. An adult can read the prompt aloud and review the choices with the learner.
What is the answer for all four pet votes?
Add the four category values: Dogs 4, Cats 2, Fish 3, and Birds 5. The total is 4 + 2 + 3 + 5 = 14 votes. The worksheet includes this as one of its graph-reading questions. An adult can read the prompt aloud and review the choices with the learner.
Can an adult read the graph title aloud?
Yes. An adult can read the title and category labels, then invite the child to follow each bar to the value axis. After the child answers, use the key to review how the bars show counts and comparisons. An adult can read the prompt aloud and review the choices with the learner.