Free printable practice
Charts Graphs Practice Activities
Grade 2 weather worksheets for reading, organizing, and discussing data in charts, tally tables, pictographs, and simple bar graphs.
Free printable worksheet PDFs
Preview every available page, then download the free worksheet PDF for home, homeschool, tutoring, or classroom practice.
Preview the exact activity before downloading it.
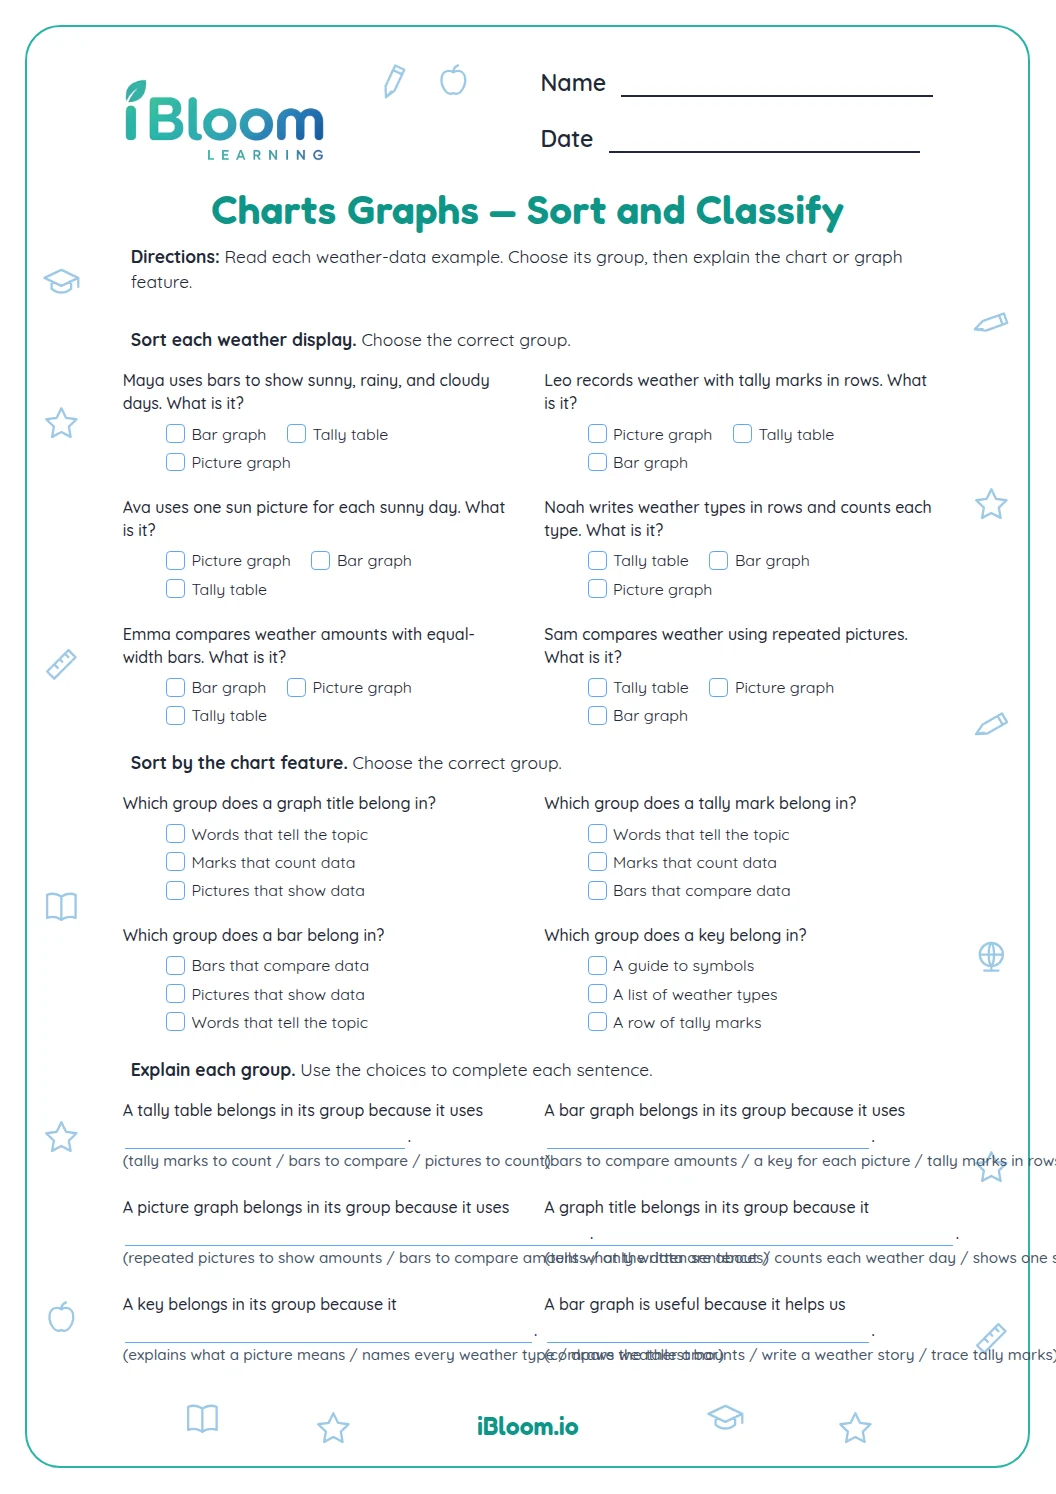 Charts Graphs — Sort and ClassifyGrade 2 weather worksheets for reading, organizing, and discussing data in charts, tally tables, pictographs, and simple bar graphs. This sort and classify worksheet provides a distinct, age-appropriate way to practise the same lesson.Grade 2Free PDF preview8 pages
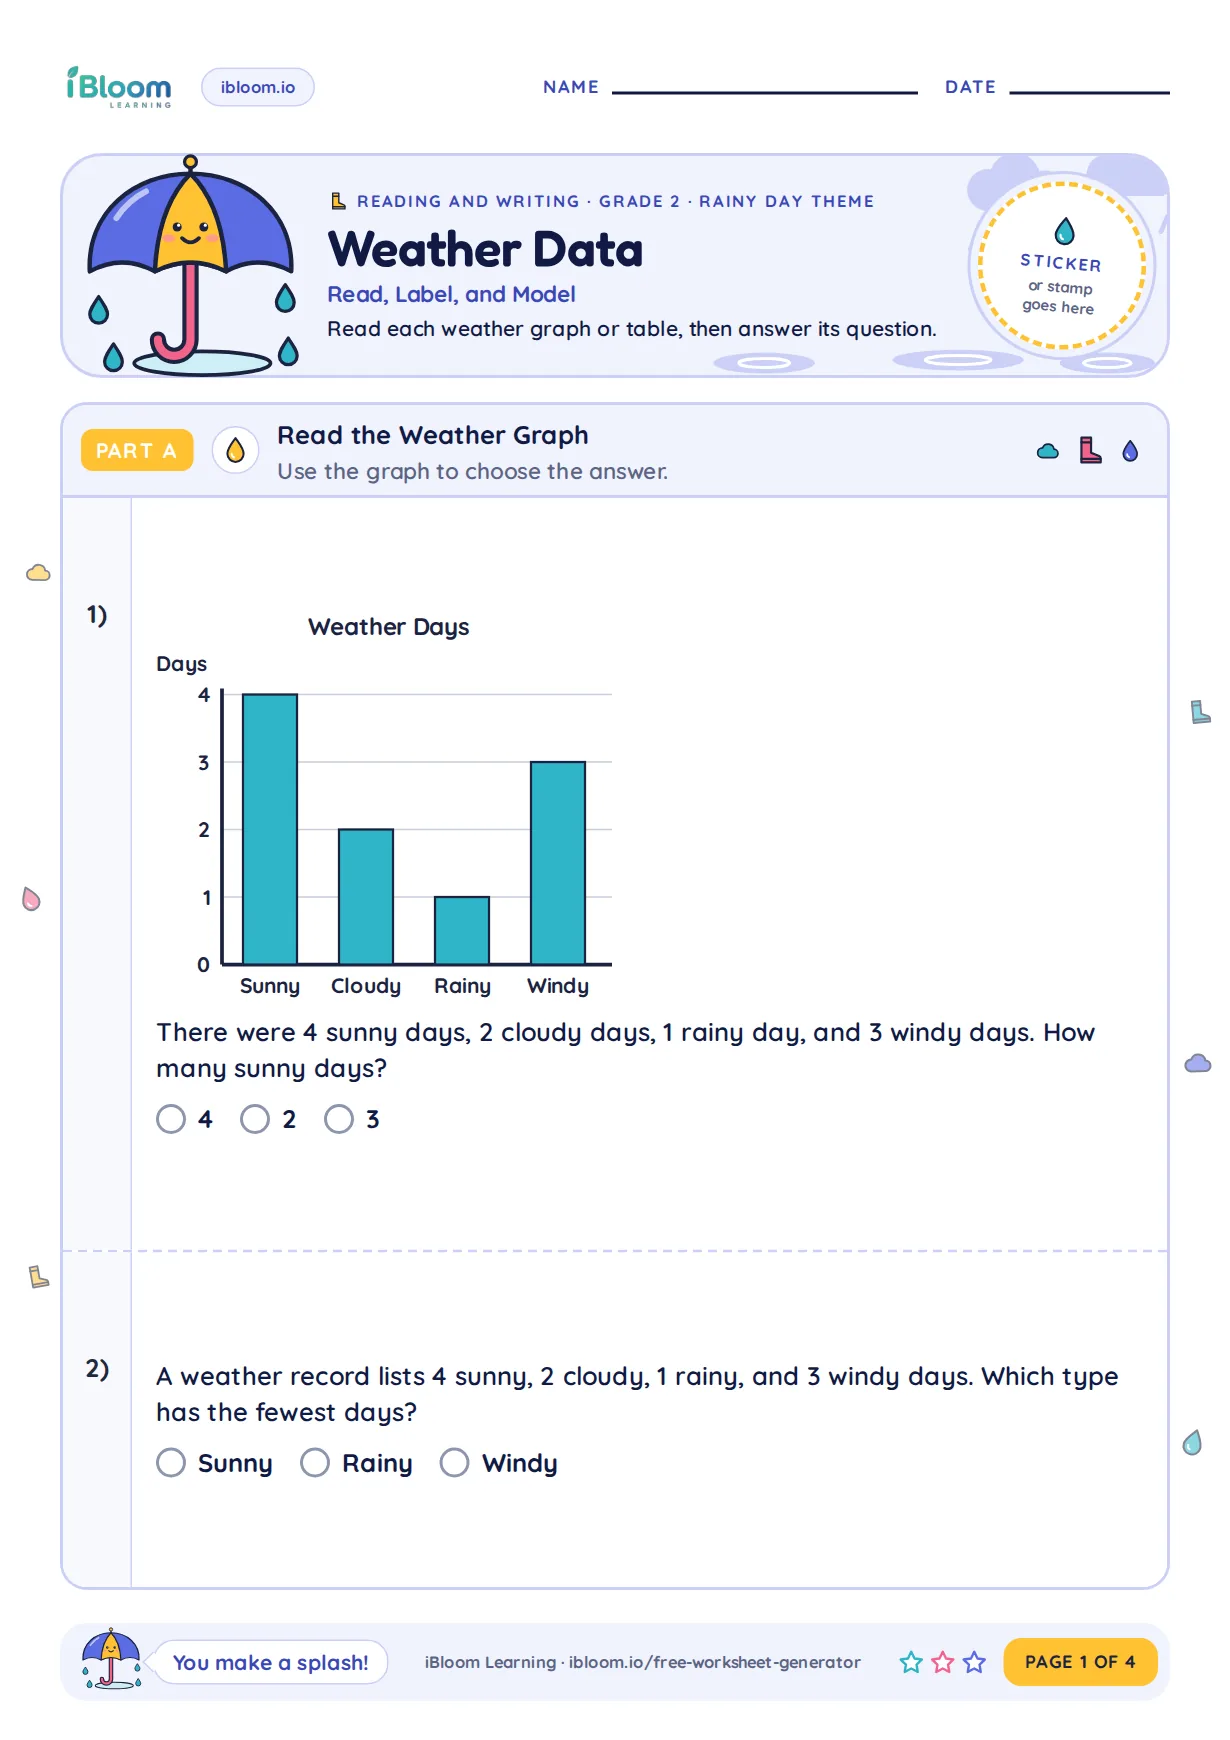 Charts Graphs — Label and ModelGrade 2 weather worksheets for reading, organizing, and discussing data in charts, tally tables, pictographs, and simple bar graphs. This label and model worksheet provides a distinct, age-appropriate way to practise the same lesson.Grade 2Free PDF preview
 Charts Graphs — Explain Cause and EffectGrade 2 weather worksheets for reading, organizing, and discussing data in charts, tally tables, pictographs, and simple bar graphs. This explain cause and effect worksheet provides a distinct, age-appropriate way to practise the same lesson.Grade 2Free PDF preview
 Charts Graphs — Apply Science IdeasGrade 2 weather worksheets for reading, organizing, and discussing data in charts, tally tables, pictographs, and simple bar graphs. This apply science ideas worksheet provides a distinct, age-appropriate way to practise the same lesson.Grade 2Free PDF preview6 pages
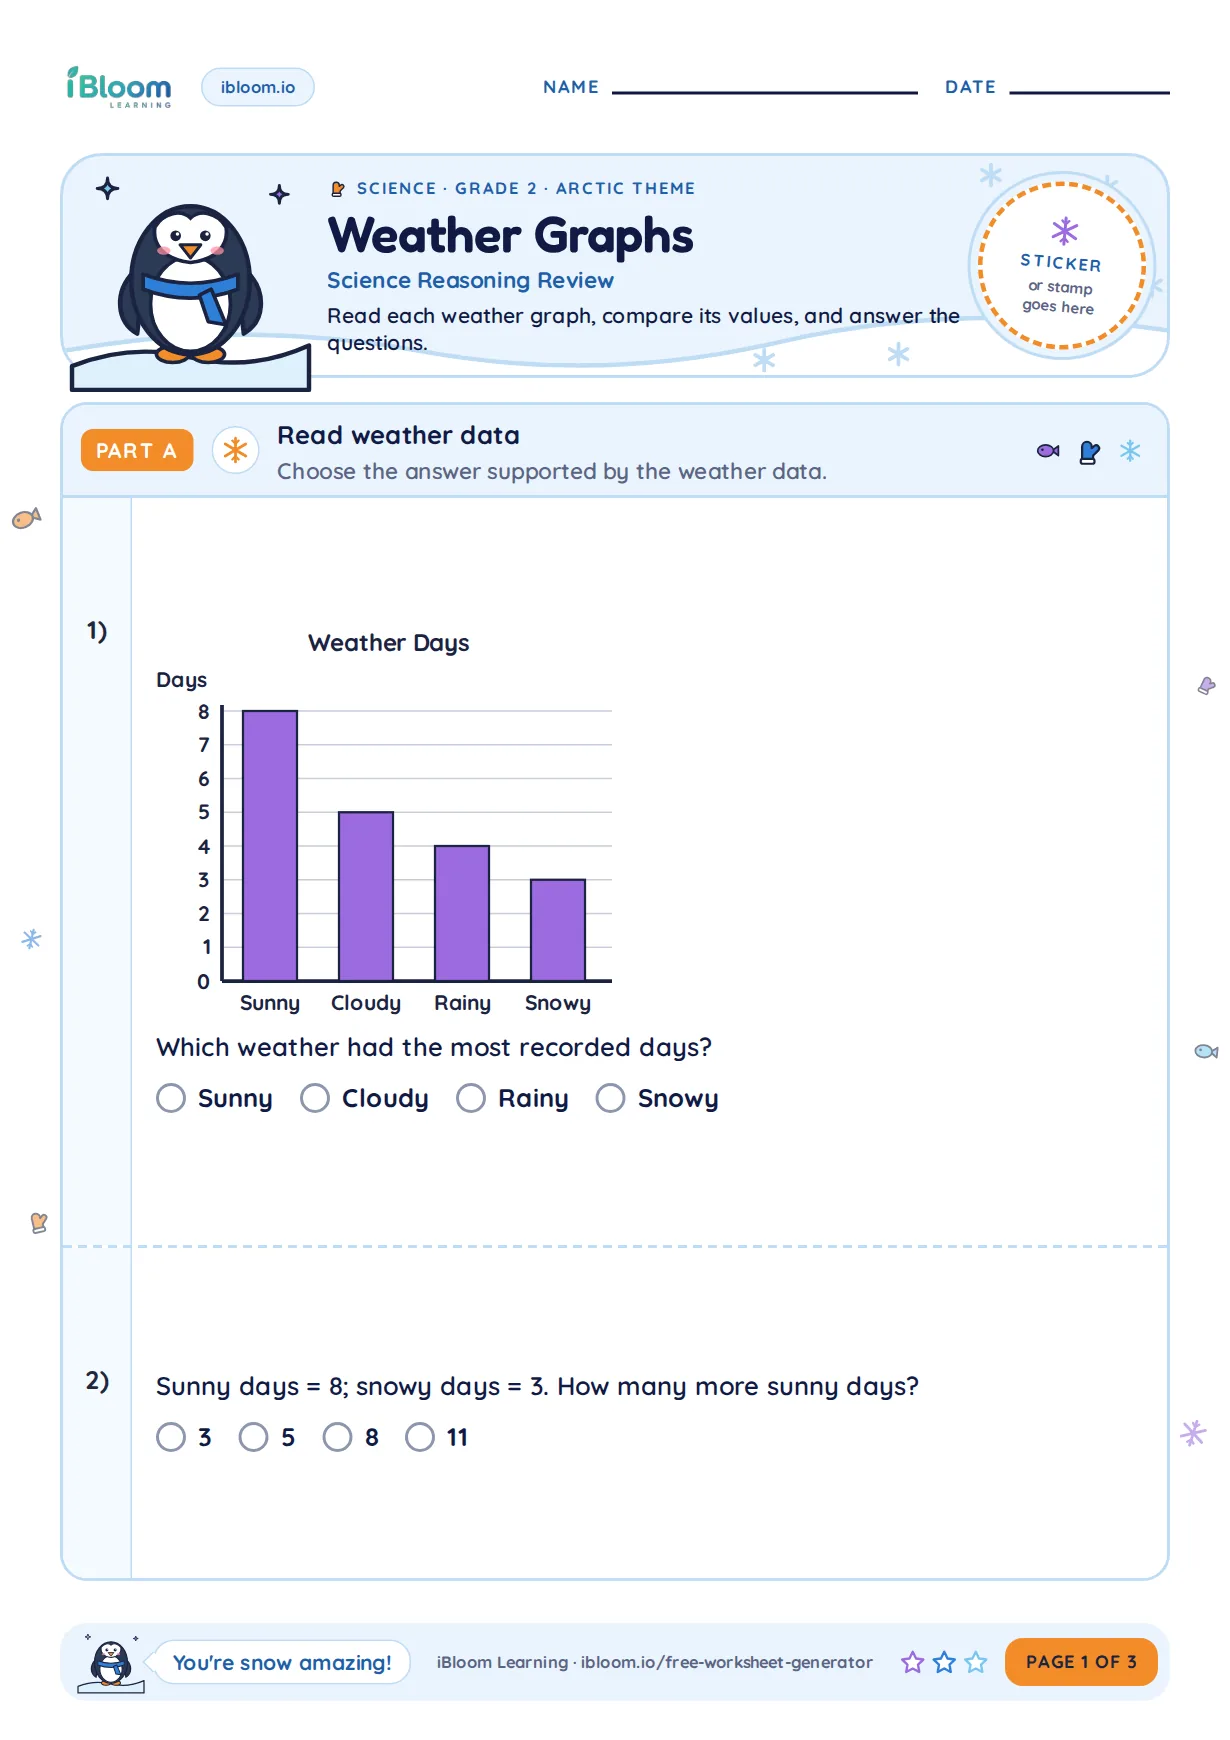 Charts Graphs — Science Reasoning ReviewGrade 2 weather worksheets for reading, organizing, and discussing data in charts, tally tables, pictographs, and simple bar graphs. This science reasoning review worksheet provides a distinct, age-appropriate way to practise the same lesson.Grade 2Free PDF preview
Practice that builds confidence
Reading weather data
These Grade 2 science worksheets help children make sense of weather information by reading and creating simple charts and graphs. Students practice noticing patterns in sunny, cloudy, rainy, windy, or snowy days and connecting data displays to real weather observations.
The printable activities include weather tables, tally charts, pictographs, and bar graphs with child-friendly questions. Children count, compare, label, and explain what the data shows so they build both science vocabulary and early data skills.
Charts and graphs give second graders a clear way to organize weather observations. In these worksheets, children may look at a weekly weather chart, count how many days had each type of weather, or compare categories such as sunny and rainy. They learn that a title tells what the data is about, labels name the categories, and numbers or symbols show how much.

From observations to displays
The skill grows from simple recording to interpretation. A child might begin with a weather table, turn the information into tally marks, then answer questions from a pictograph or bar graph. This progression helps students see that the same weather data can be shown in more than one way. Useful vocabulary includes data, chart, graph, tally, symbol, label, category, most, least, more than, and fewer than.
Parent practice routine
At home, choose one regular moment each day to check the weather together. Ask your child to mark the day as sunny, cloudy, rainy, snowy, or windy on a small calendar. At the end of the week, have them count each type and make a quick bar graph with colored blocks or crayons. Finish with two questions: “Which weather happened most?” and “How many more sunny days than rainy days?”

Classroom uses
Teachers can use these printables during a Grade 2 weather unit, science centers, morning meeting, or math-data connection lessons. They work well after students observe outdoor conditions, read a class weather chart, or discuss seasonal changes. The worksheets also support partner talk because children can explain evidence from the graph instead of guessing.

Common errors to watch for
Some children count the pictures in a pictograph but forget to check what each symbol means. Others compare bar heights without reading the scale or mix up “more” and “fewer.” Encourage students to point to the title, labels, and key before answering. If a question asks for a difference, they should subtract or count on, not simply name the larger group.
Free printable PDF download
Use this grade 2 weather charts and graphs worksheet page to preview the activity, print it, or download it as a PDF for quick practice. It works well for homework, homeschool lessons, tutoring, morning work, revision, and classroom centers.
Answers and answer key support
After the child completes the worksheet independently, parents and teachers can use the answer support or answer key information to check the work, review mistakes, and choose the next practice step.
Why iBloom worksheets help
The activities keep the focus on real weather contexts while gently building data literacy. A child-friendly strategy is: read the title, check the labels, count carefully, then say what the graph shows in a full sentence. This helps children move beyond filling in boxes to explaining weather patterns with evidence.
Helpful answers
Frequently asked questions
What weather graph skills do these Grade 2 worksheets practice?
They practice reading and completing weather tables, tally charts, pictographs, and simple bar graphs, then answering questions about most, least, more, fewer, and differences.
Do children need to know advanced graph scales first?
No. The activities are designed for early data work. Children focus on titles, labels, categories, counting symbols or bars, and explaining what the weather data shows.
How can I connect these worksheets to real weather observations?
Have your child record the daily weather for a week, then use the worksheet style to count each category and make a chart or graph from the collected observations.
What mistakes should I look for when my child reads a pictograph?
Check that your child reads the key, counts symbols carefully, and answers the exact question. If one symbol represents more than one item, they should use the key rather than just count pictures.
Can these worksheets be used in both science and math lessons?
Yes. The context is Grade 2 weather science, but the tasks also strengthen data handling, comparison, counting, and early graph interpretation skills.
Is this grade 2 weather charts and graphs worksheet free?
Yes. You can preview it for free and use the printable worksheet for home or classroom practice.
Can I download this grade 2 weather charts and graphs worksheet as a PDF?
Yes. Use the worksheet download option to save a printable PDF, or print the worksheet directly from the page.
Does this grade 2 weather charts and graphs worksheet include answers or an answer key?
When the activity has fixed answers, iBloom includes answer support so parents and teachers can check the completed worksheet.