


About this worksheet
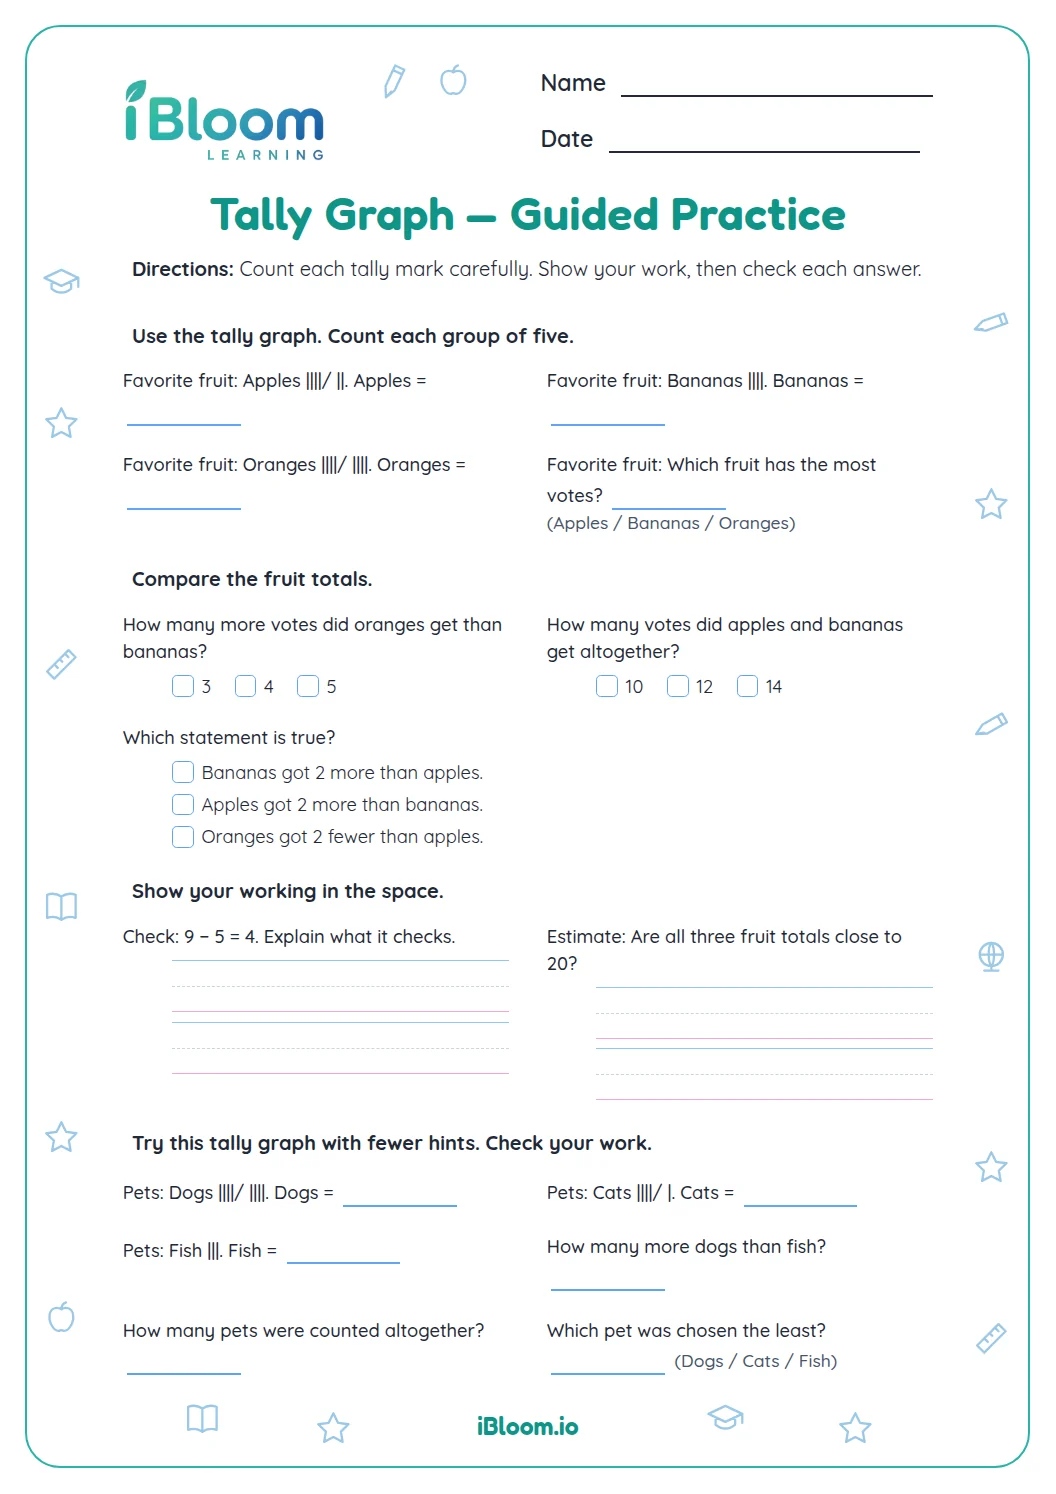
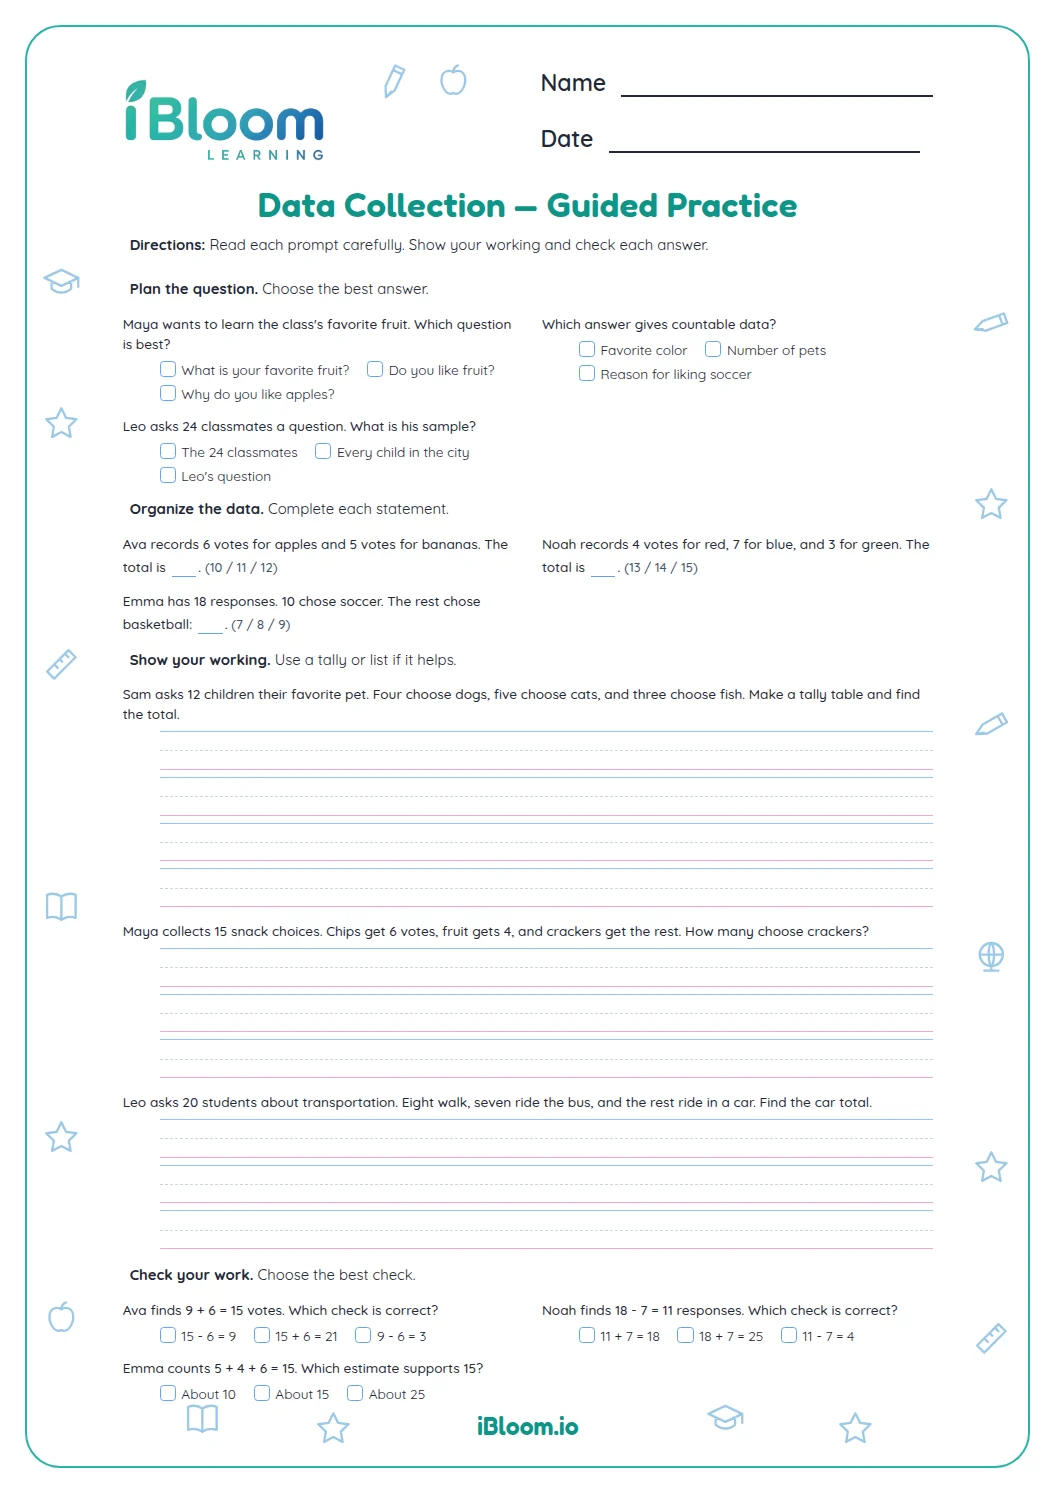
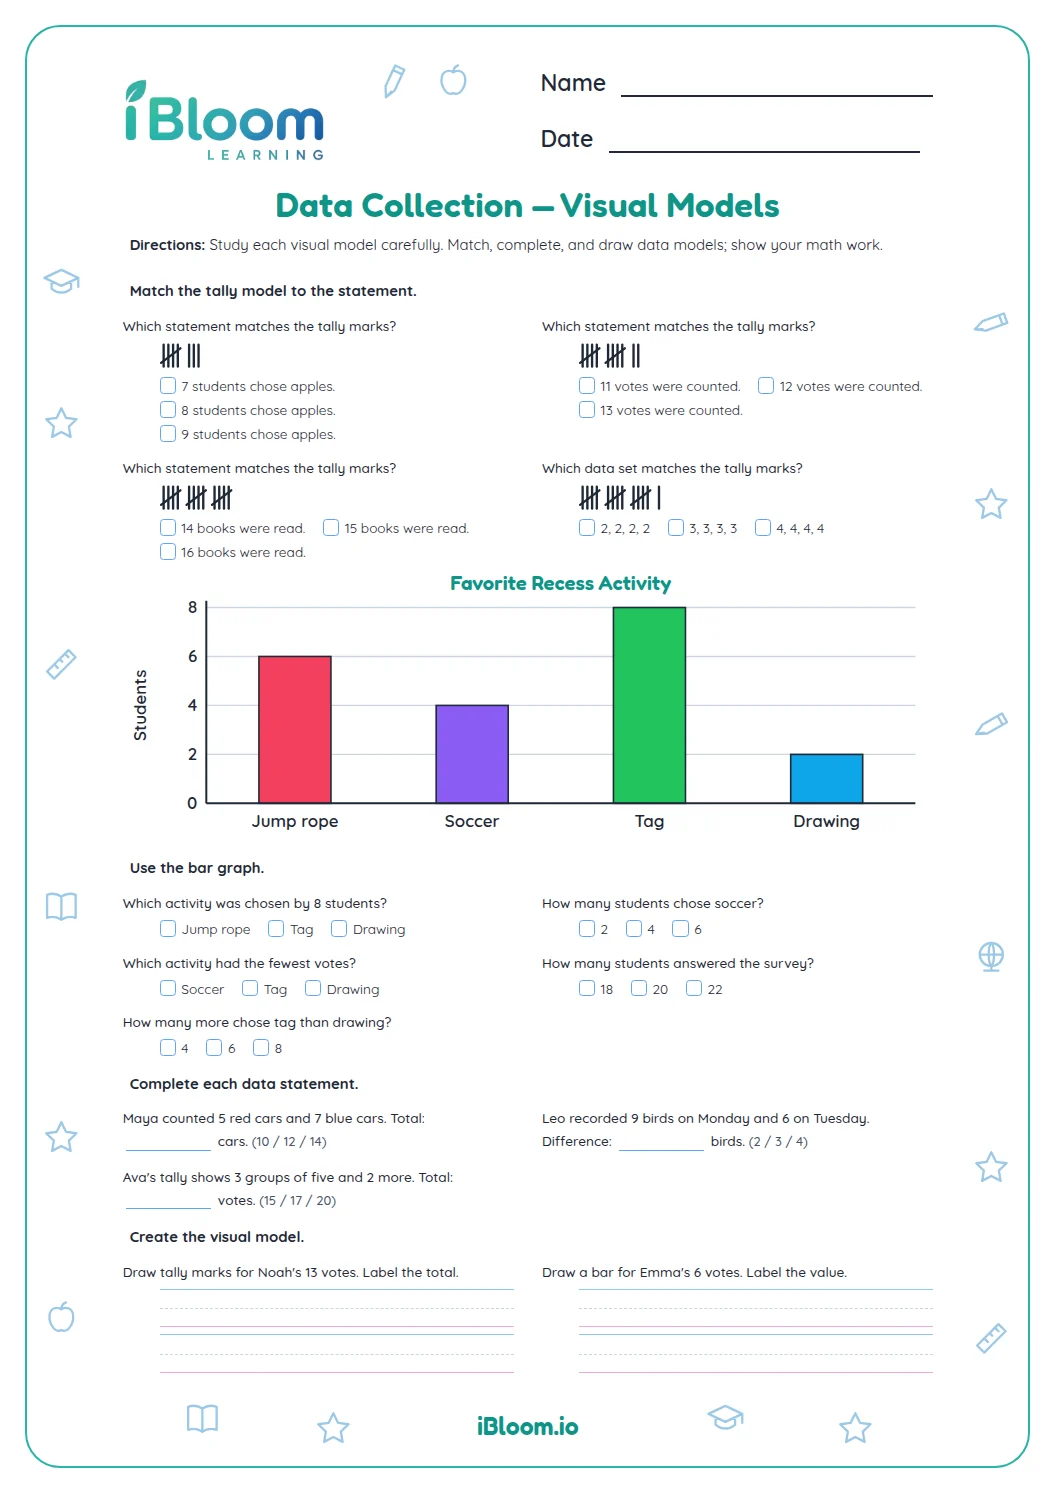
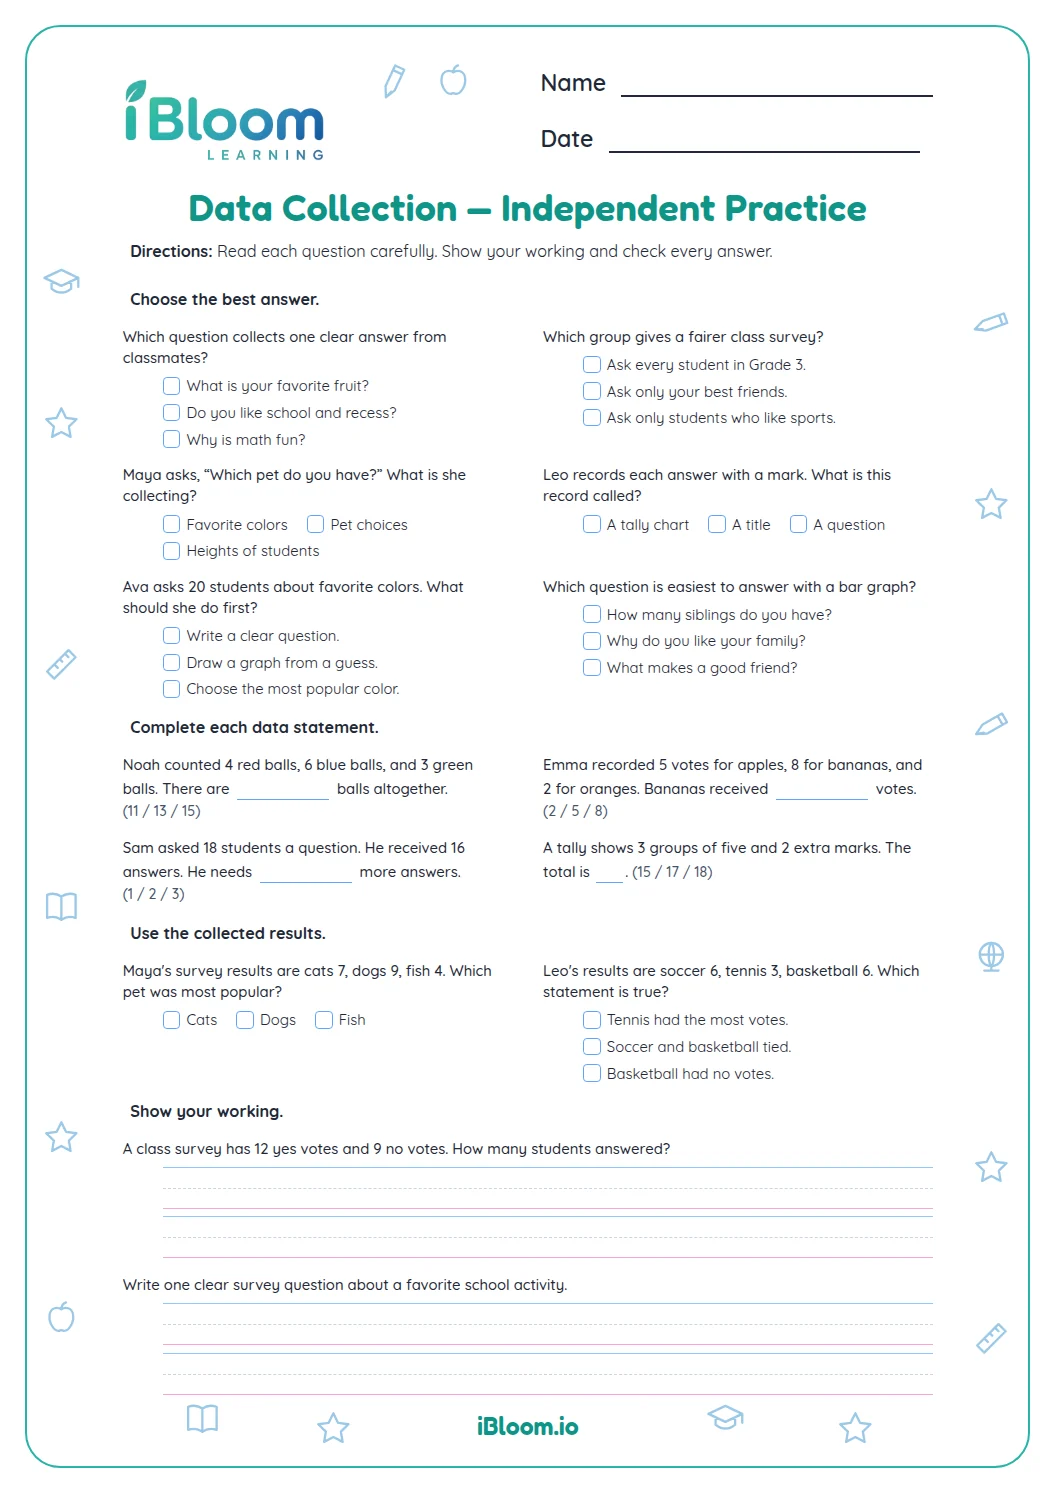
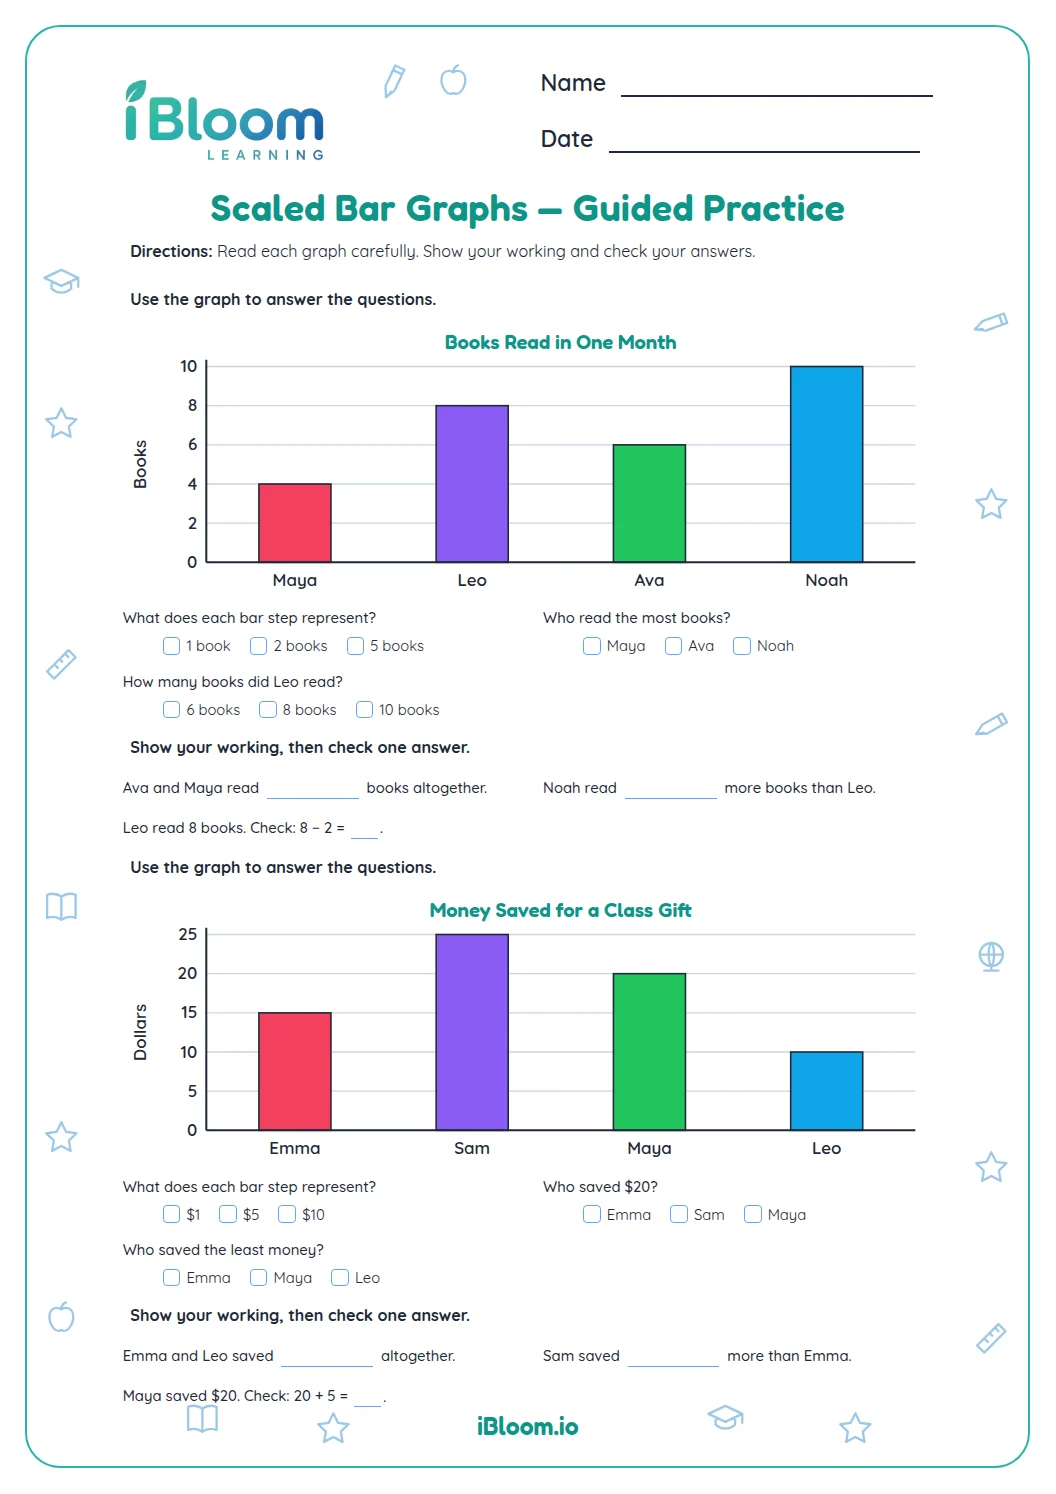
This Grade 3 printable introduces tally groups and category graphs through 14 questions. Children count groups of five, read a fruit-vote bar graph, find totals and differences, and solve short data problems. The page builds toward reading graph information with care and includes a separate answer key.
Aligned to 3.MD.B.3
What does this worksheet practice?
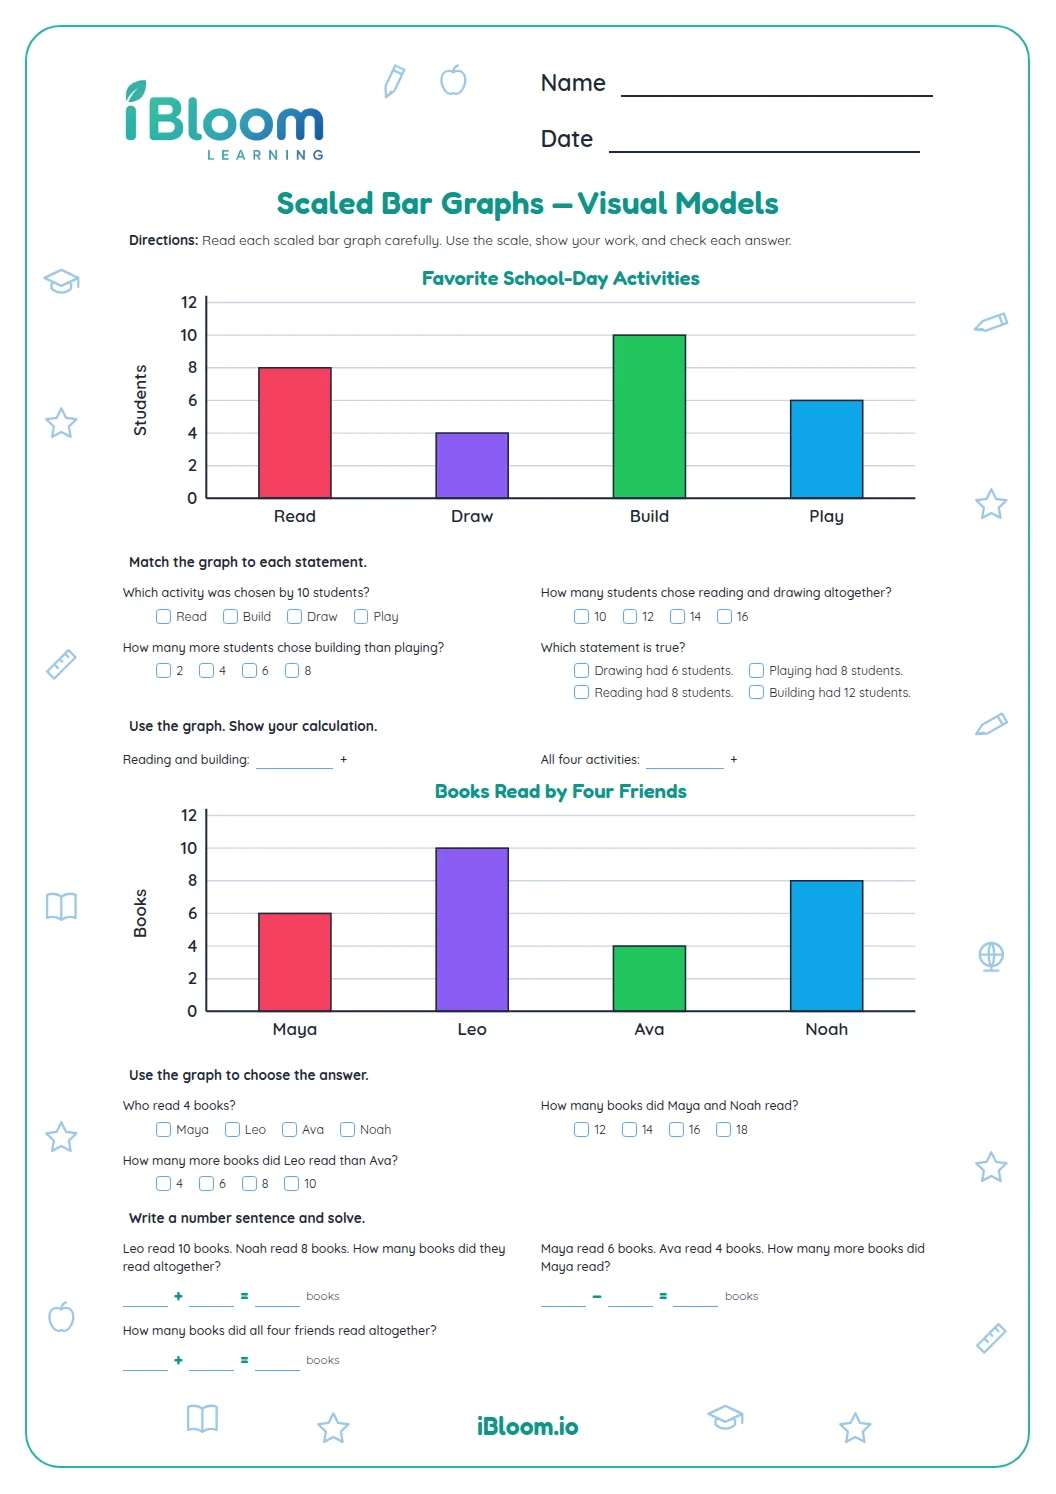
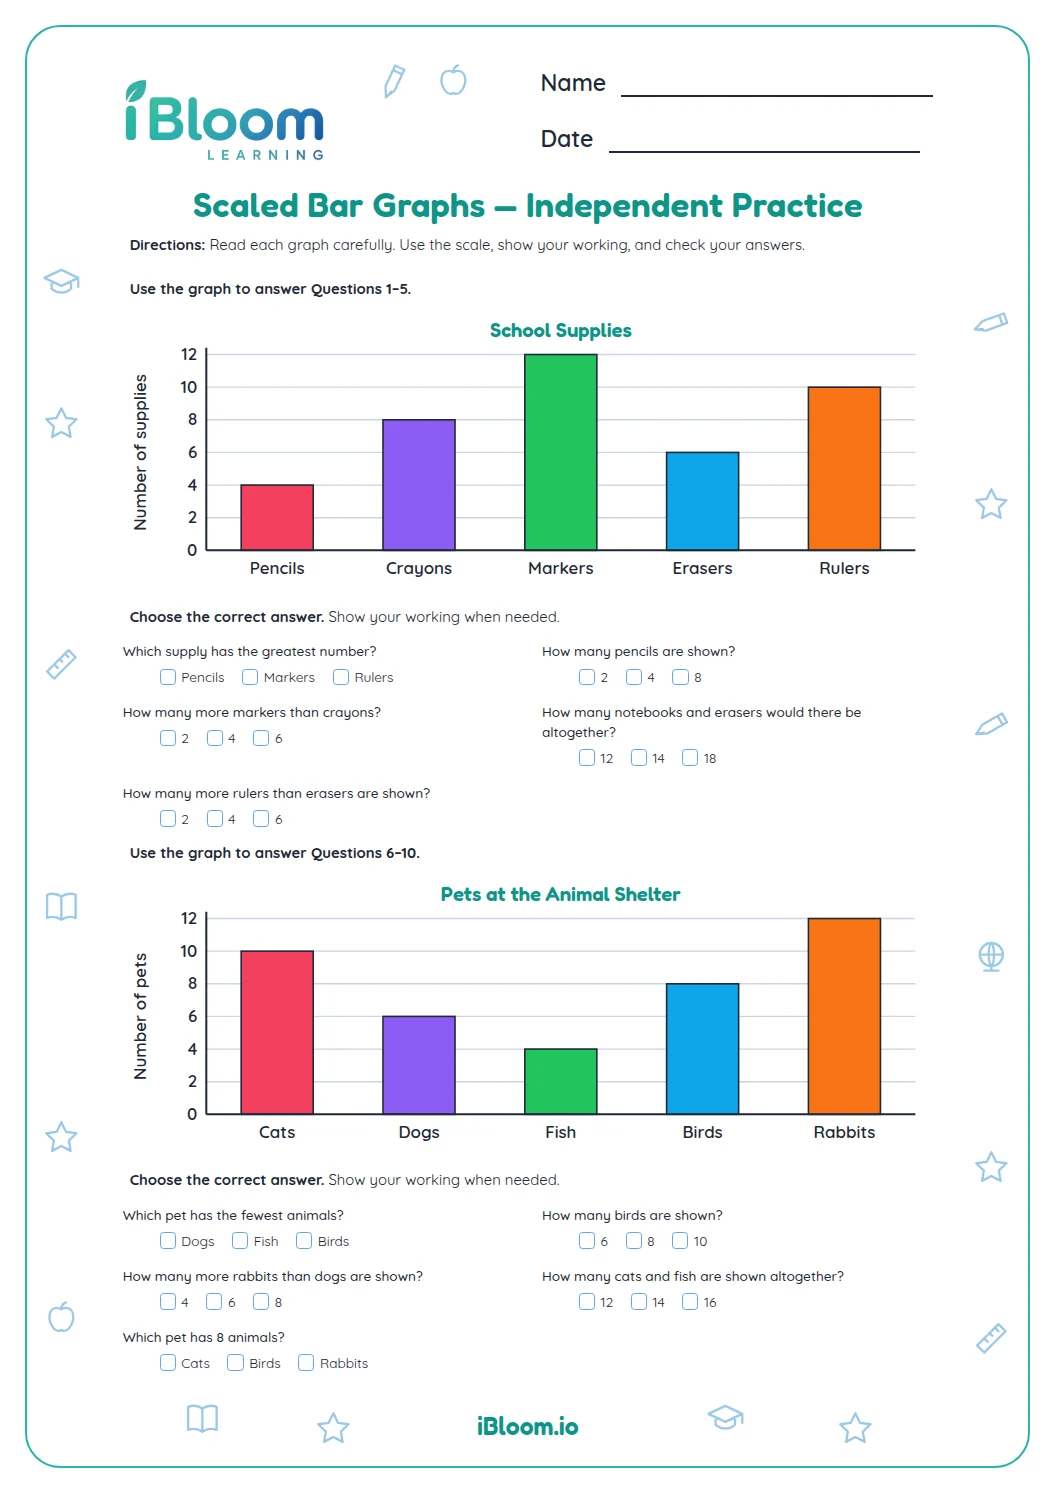
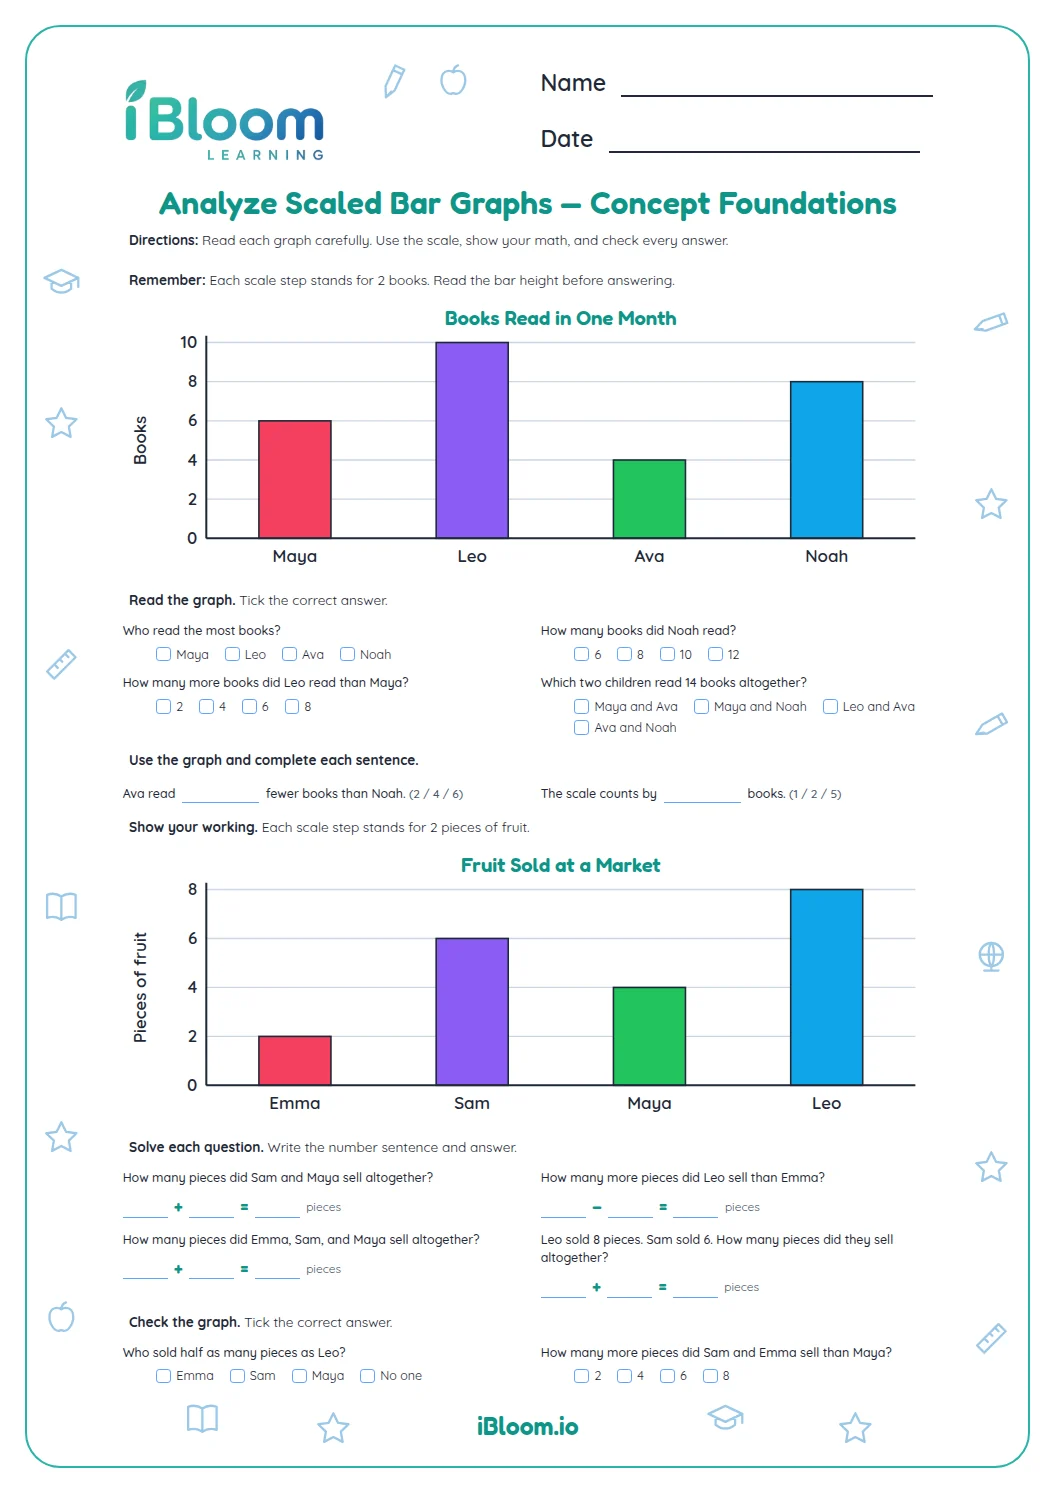
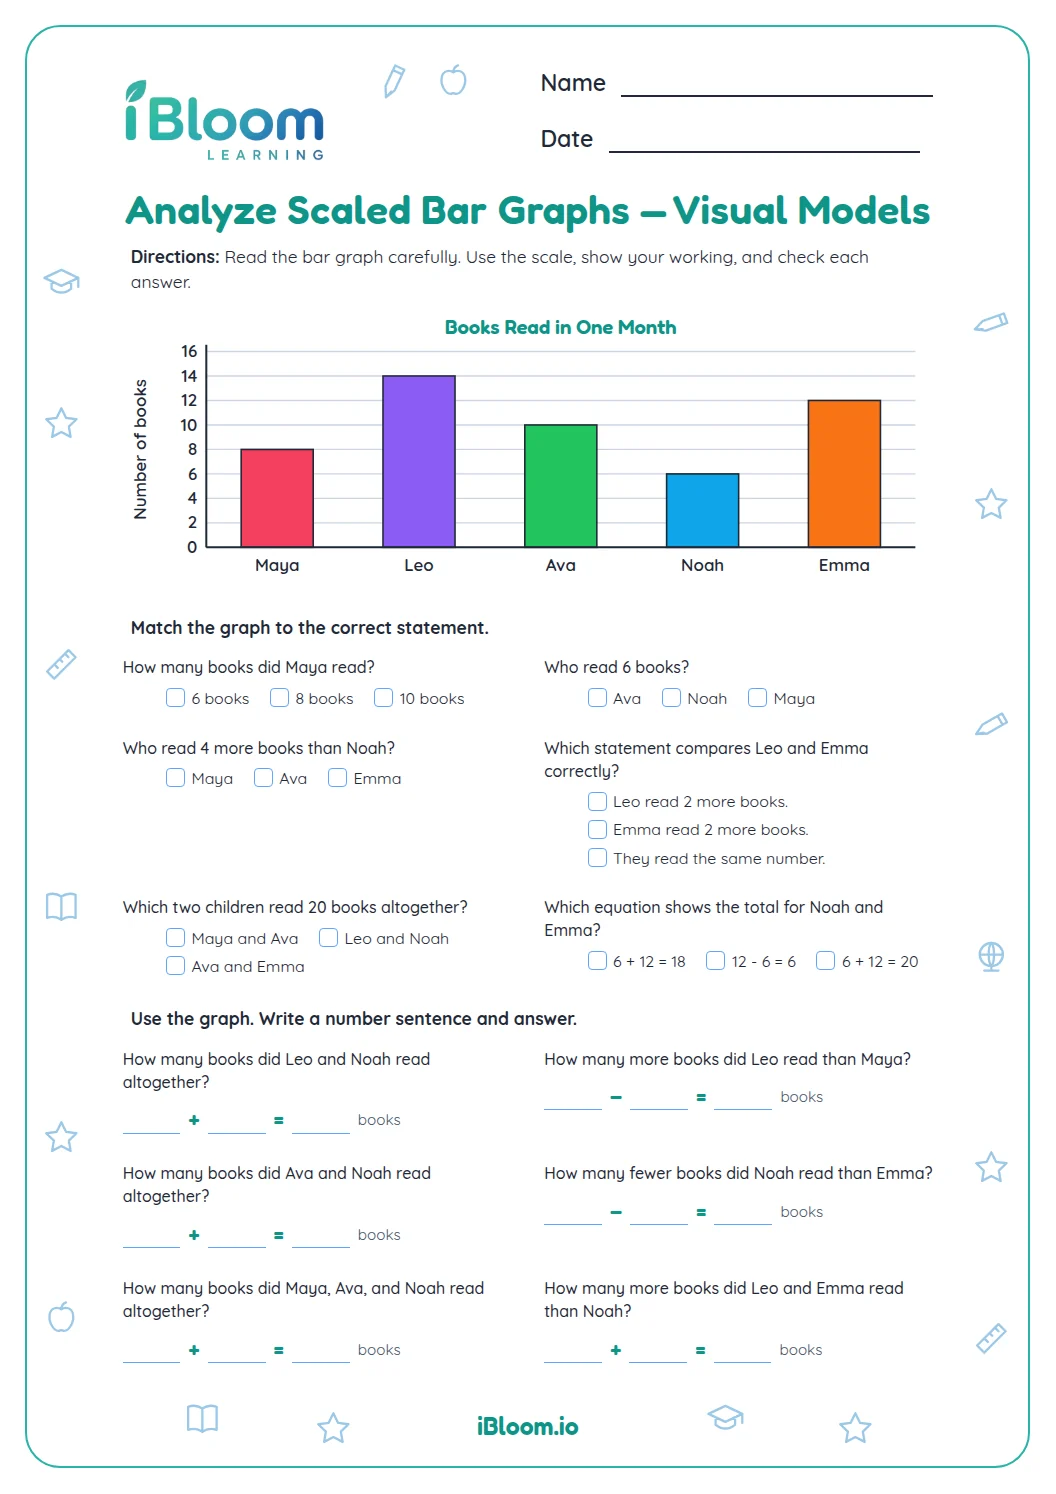
Part A counts tally groups and adds a few marks to a count. Part B reads a class bar graph about fruit votes. Part C uses category counts to compare, combine, and check simple claims.
- Part A: 8 tally counts
- Part B: 1 fruit bar-graph question
- Part C: 5 addition and comparison problems
How do tally marks show groups?
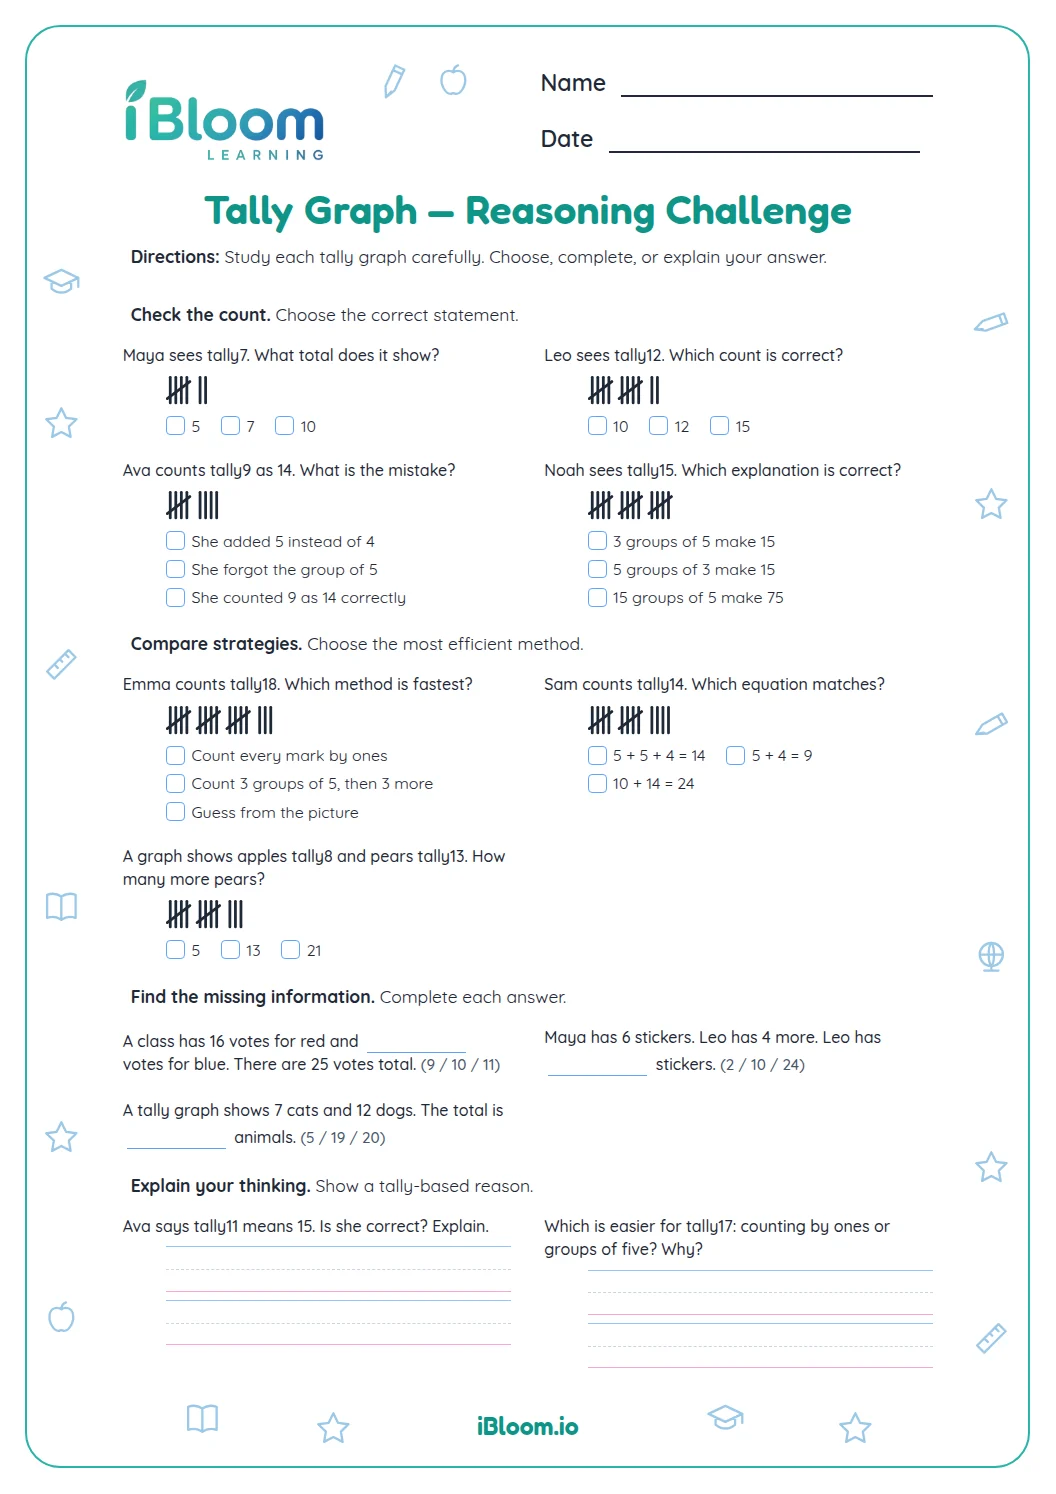
Tally marks are counted one at a time, with the fifth mark crossing the first four. For 12 marks, count two complete bundles of five and two extra marks.
How do you read the fruit graph?
Read along the category label, then match the bar height to the numbered scale. The graph gives 8 grape votes and 5 peach votes. Subtract to find the difference: 8 − 5 = 3.
- 1Grapes: 8 votes
- 2Peaches: 5 votes
- 38 − 5 = 3 more grape votes
How can you check a data claim?
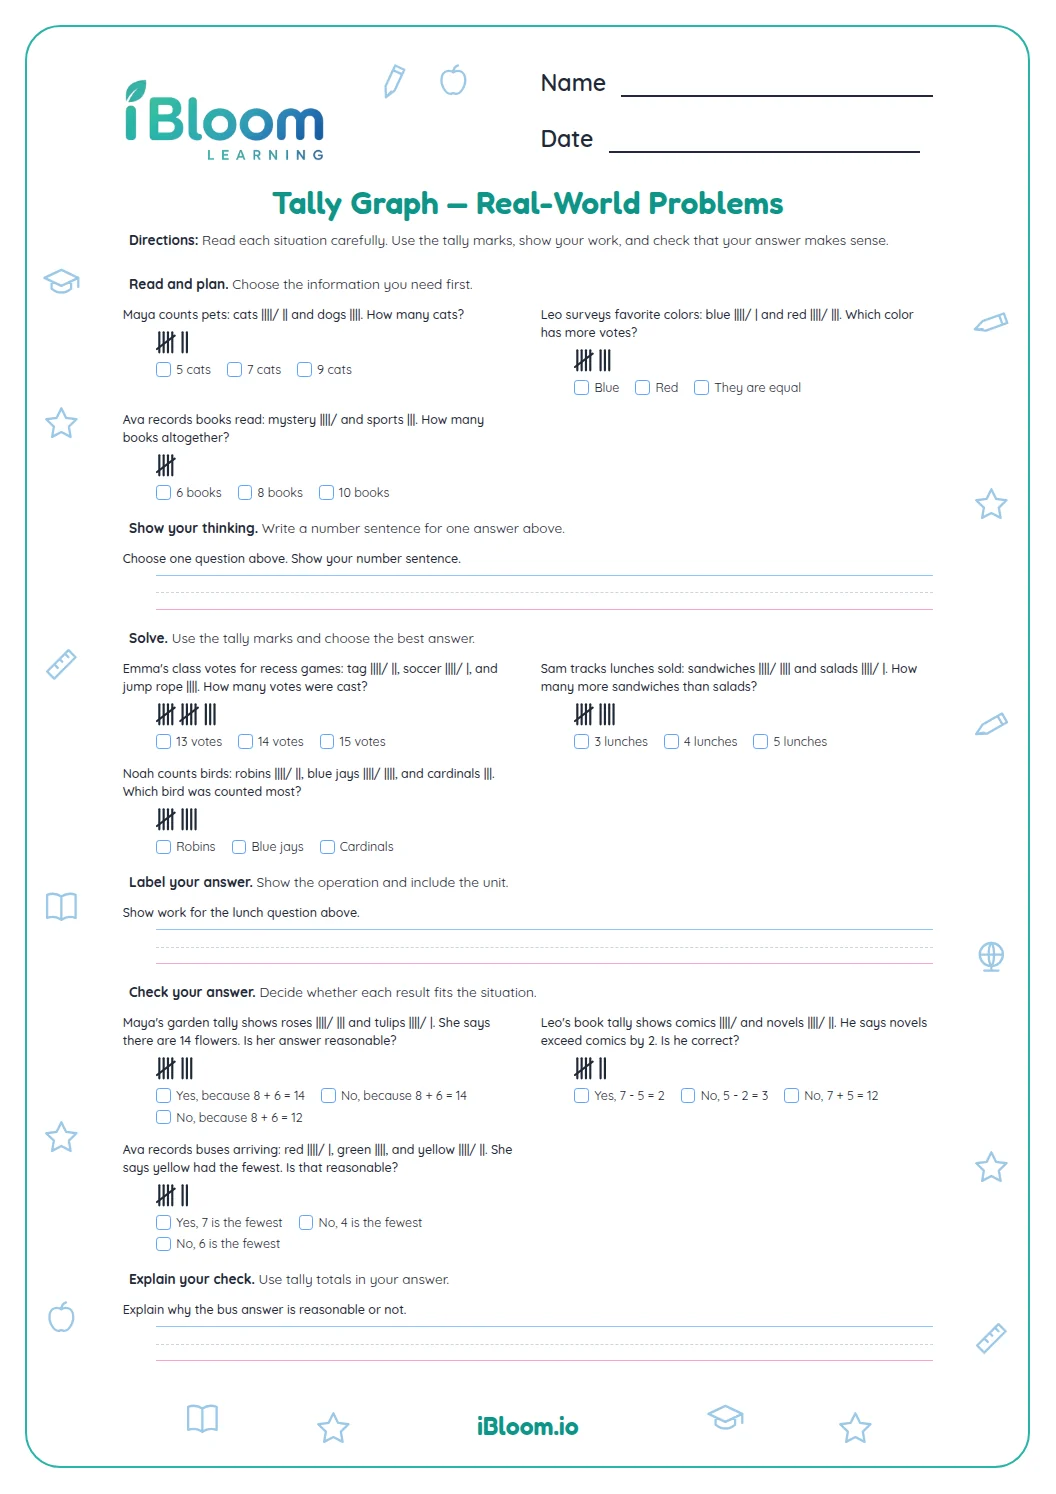
Translate the prompt into an addition or subtraction sentence. For example, if 14 votes are for cats and 8 for dogs, subtract 8 from 14 to find 6 more cat votes.
How to use this worksheet
- 1Count full tally bundles first, then count any marks left over.
- 2For a bar graph, read both the category and its value.
- 3For a total, add the category counts named in the question.
- 4For “how many more,” subtract the smaller count from the larger.
Common mistakes and quick fixes
The mistake
Counting a crossed tally group as four marks
The fix
Remember that the crossing mark is the fifth tally. Count the bundle as five.
The mistake
Reading the wrong bar label
The fix
Trace from the category name across to its bar before reading the scale.
The mistake
Adding when asked “how many more”
The fix
Use subtraction to find the difference between the two counts.
Common Core alignment
This worksheet practices interpreting category data with tally marks and a bar graph.
Use category graphs to compare and combine counts.
On this sheet: Part B reads category totals and answers comparison and total questions.
Show the official wordingHide the official wording
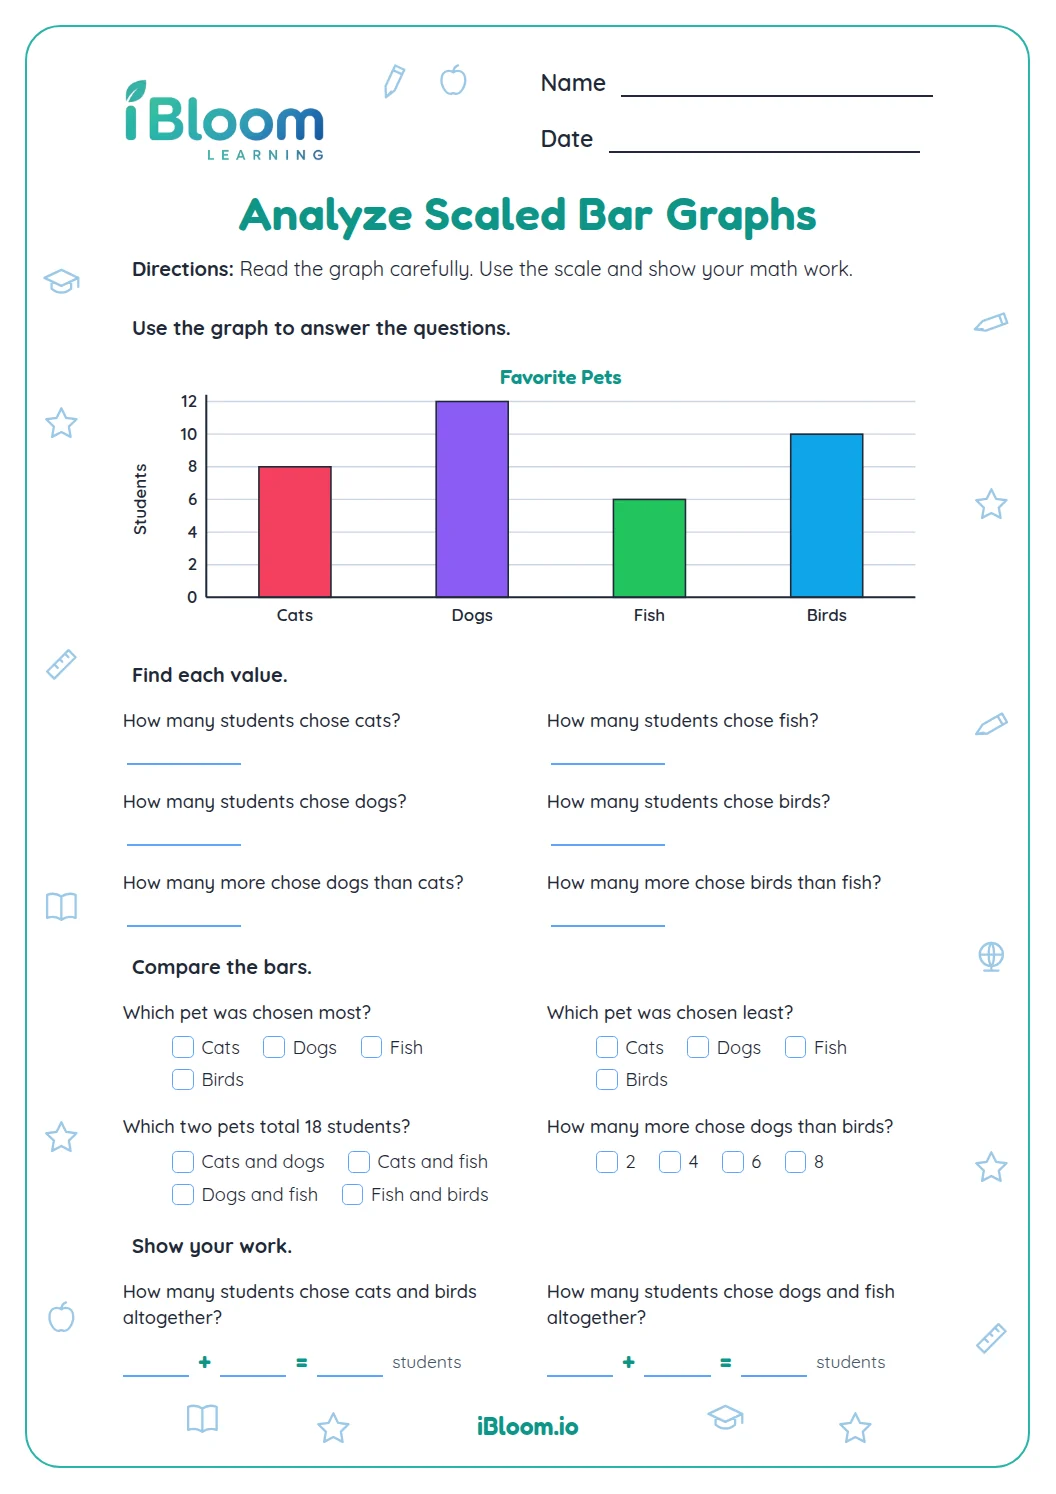
Draw a scaled picture graph and a scaled bar graph to represent a data set with several categories. Solve one- and two-step “how many more” and “how many less” problems using information presented in scaled bar graphs. For example, draw a bar graph in which each square in the bar graph might represent 5 pets.
What to practice next
Make more practice
Further reading
Questions parents and teachers ask
What is a tally group?
A tally group is five marks, with the fifth mark crossing the first four. Count complete bundles first, then add any loose marks. Part A includes totals such as 11 and 16 so children can practice both full groups and leftover marks.
How many questions are on this page?
There are 14 questions in three parts. Part A has eight tally counts, Part B asks one question about a fruit-vote bar graph, and Part C has five addition or comparison problems using short data situations. The graph question asks children to identify the category with the most votes.
Does the graph use a scale larger than one?
The fruit graph uses one vote per grid step, so children can read each bar directly. This page asks which fruit got the most votes; the next links lead to practice with scaled graphs, where one step can represent several votes.
How do I help with “how many more”?
Read both category totals and subtract the smaller from the larger. In Part C, 14 votes are for cats and 8 for dogs, so 14 − 8 = 6 more votes for cats. Match the operation to the words “how many more.”
Is an answer key included?
Yes. The separate answer key lists eight tally counts, the fruit with the most votes, and five short data answers. An adult can check the work, or children can use it to review a missed count or comparison.
What should children check before finishing?
Have children check that they counted every tally mark and used the correct category label. Then reread each question to decide whether it asks for a total or a difference. If the answer seems too large, recount the groups of five