


About this worksheet
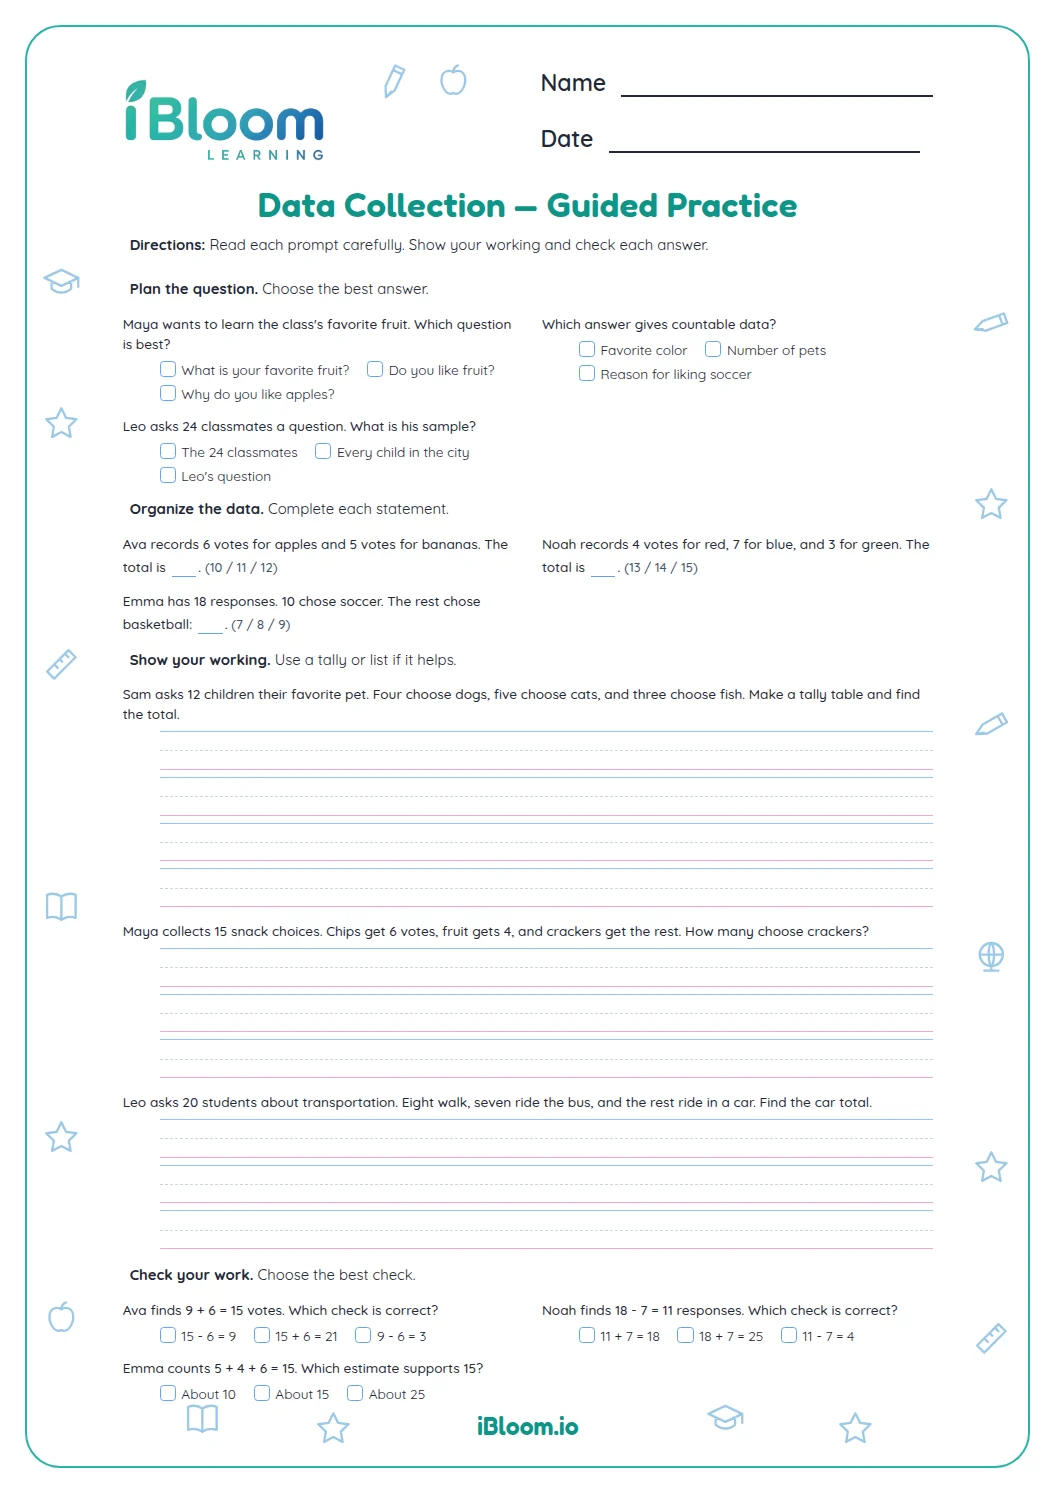
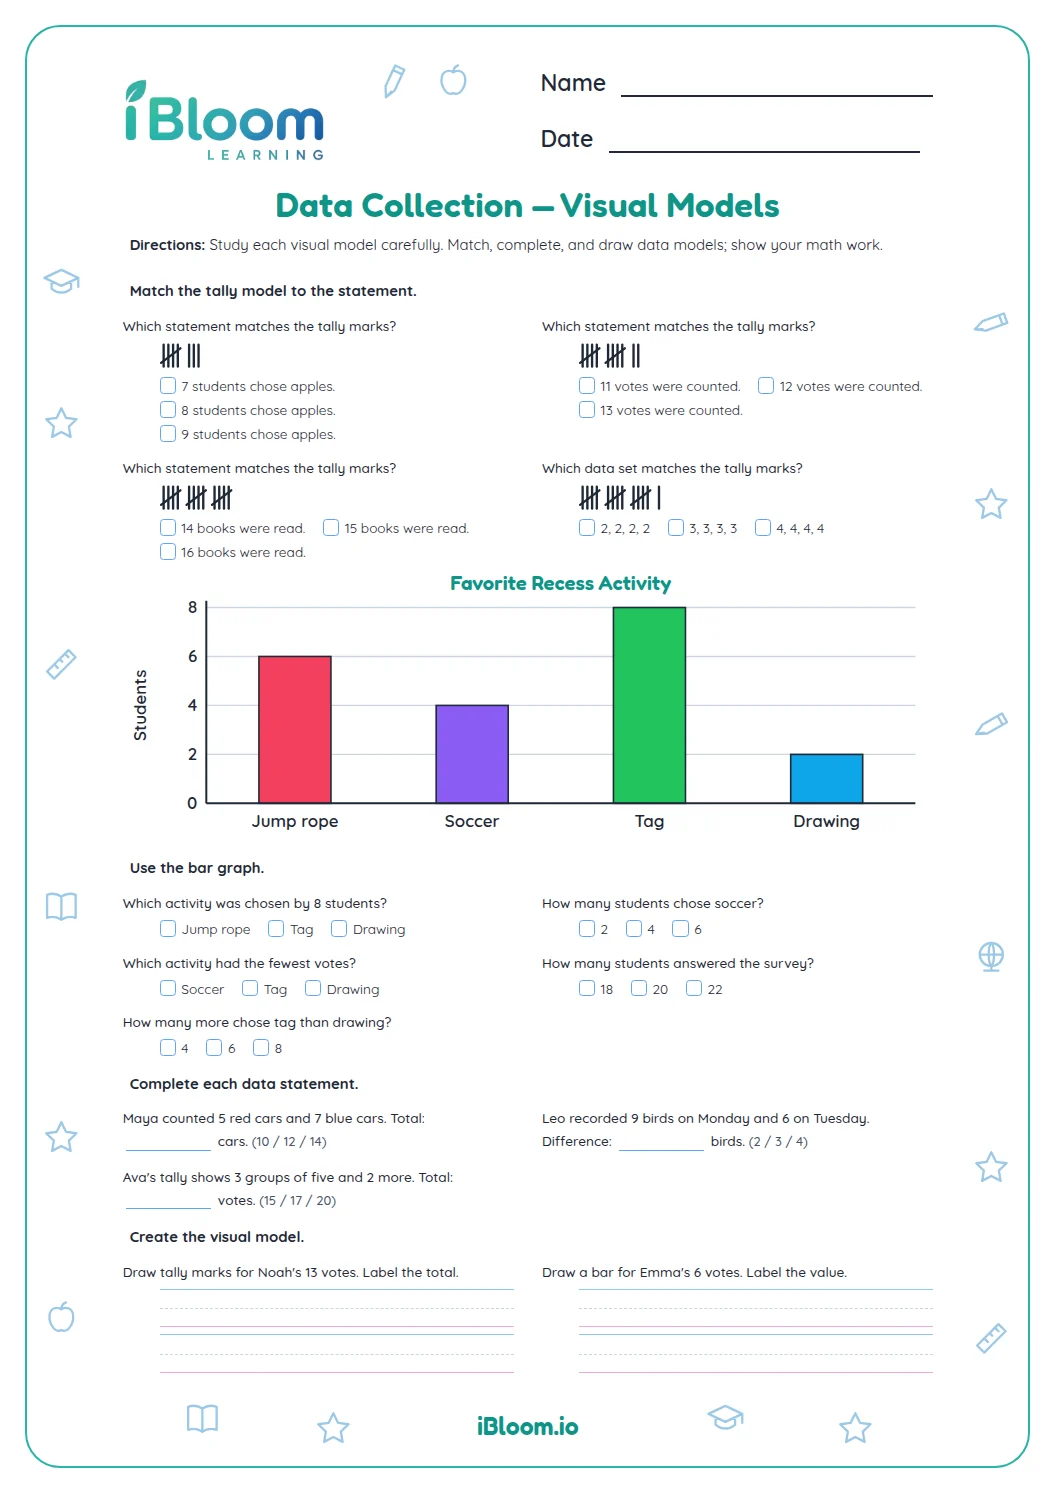
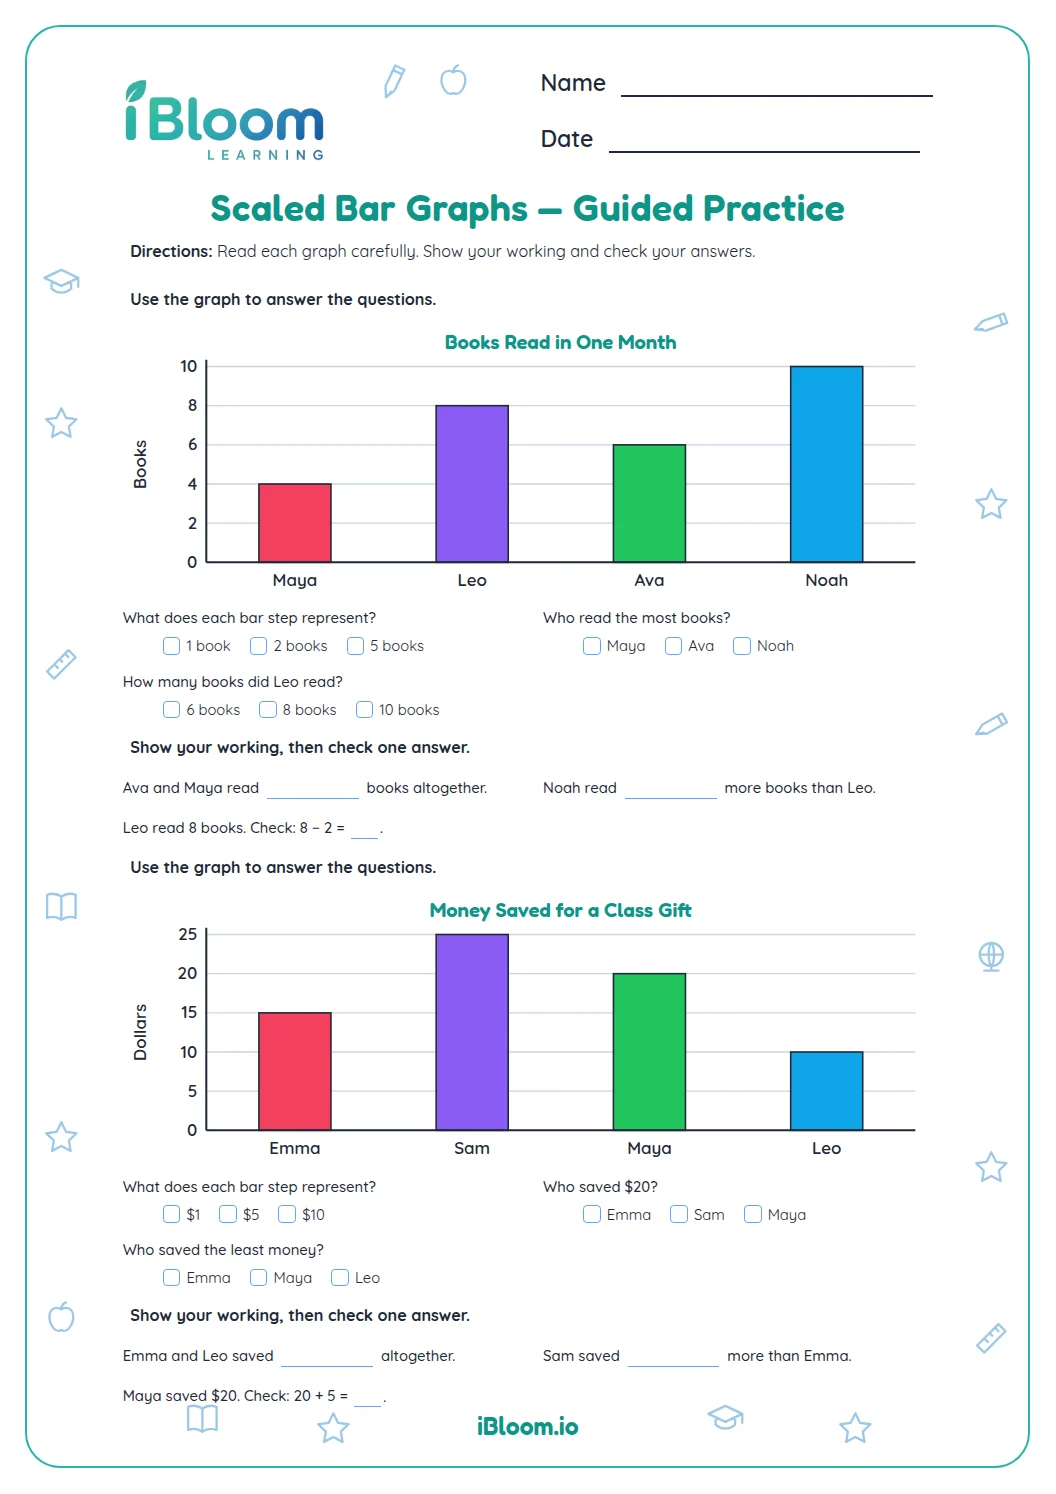
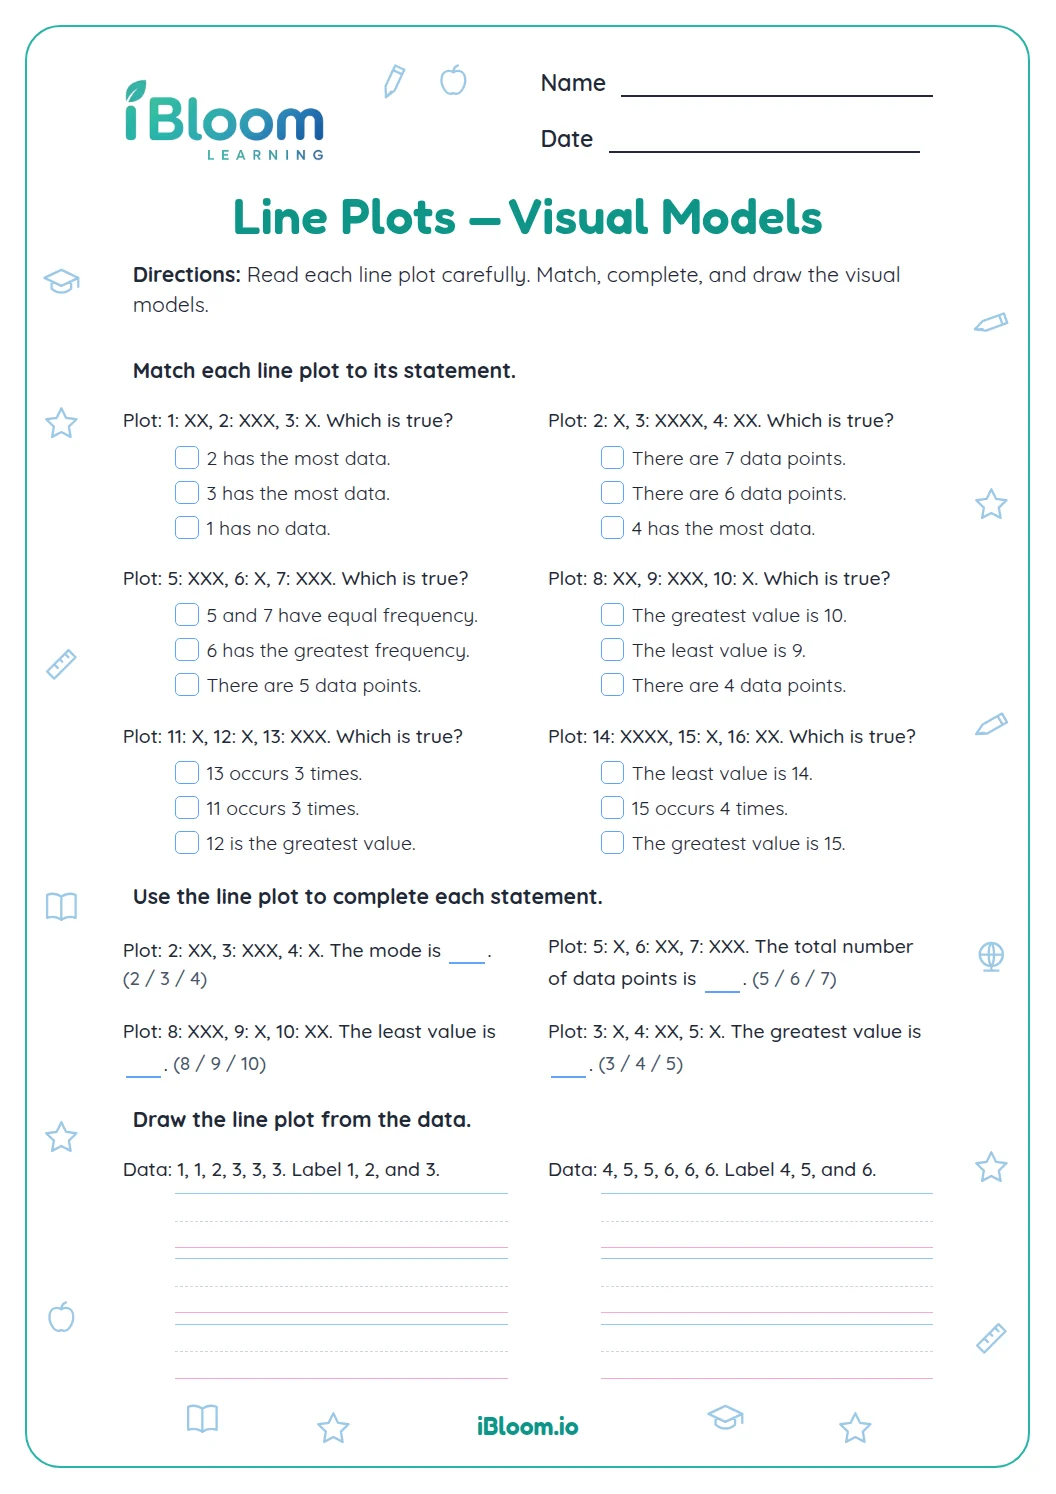
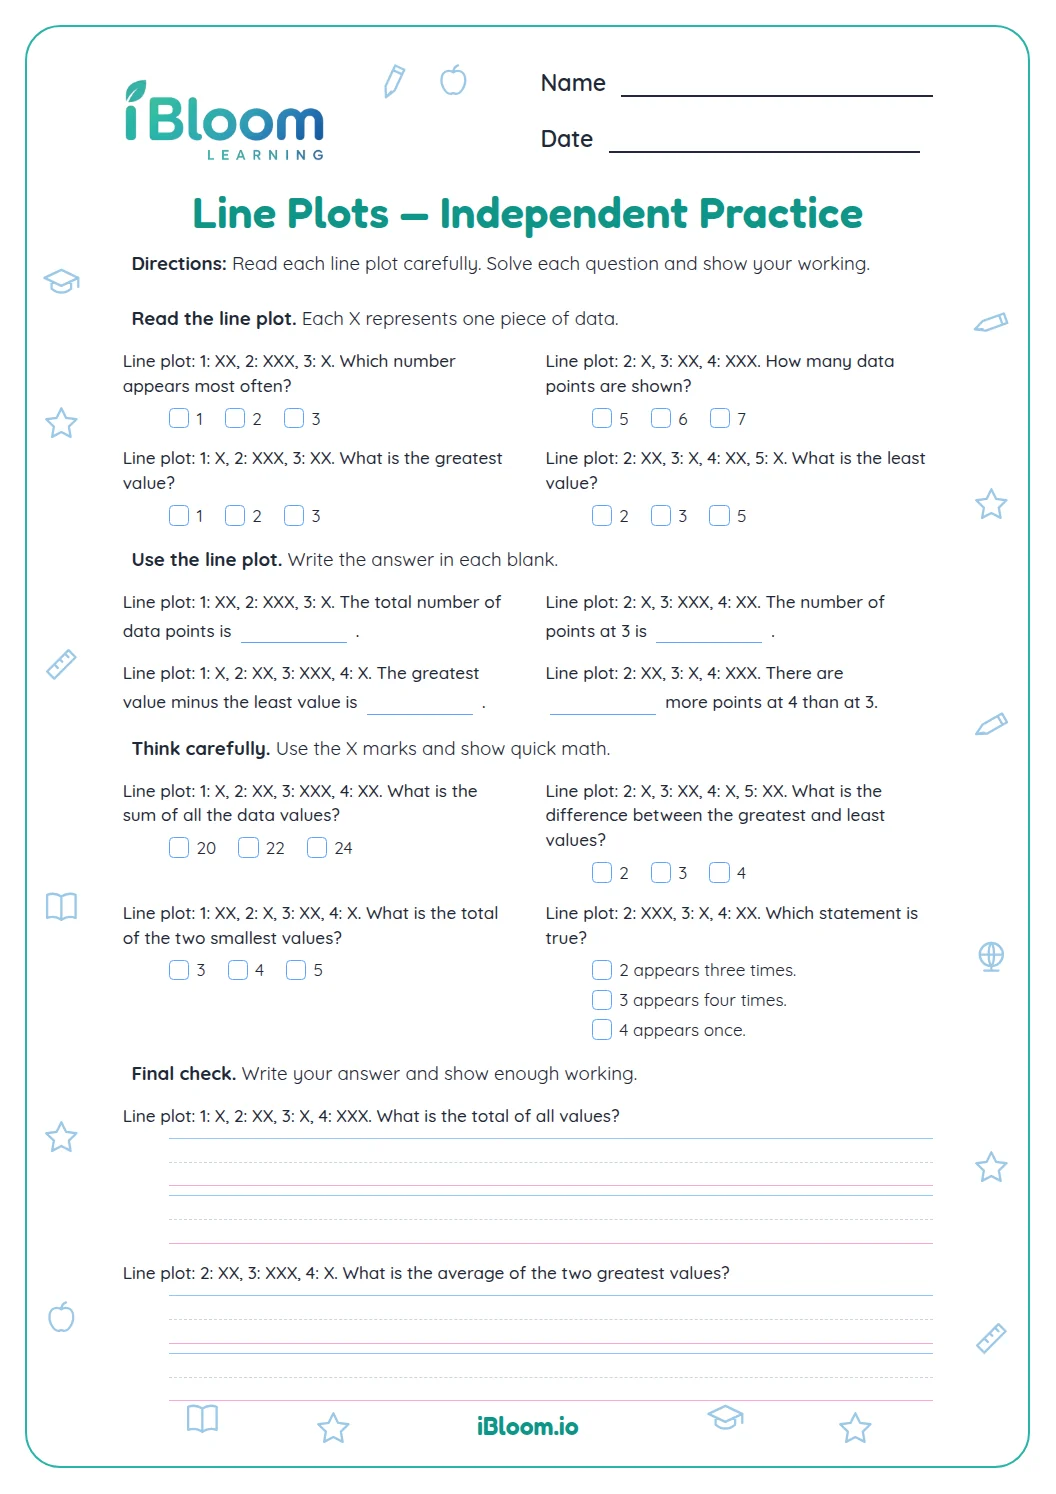
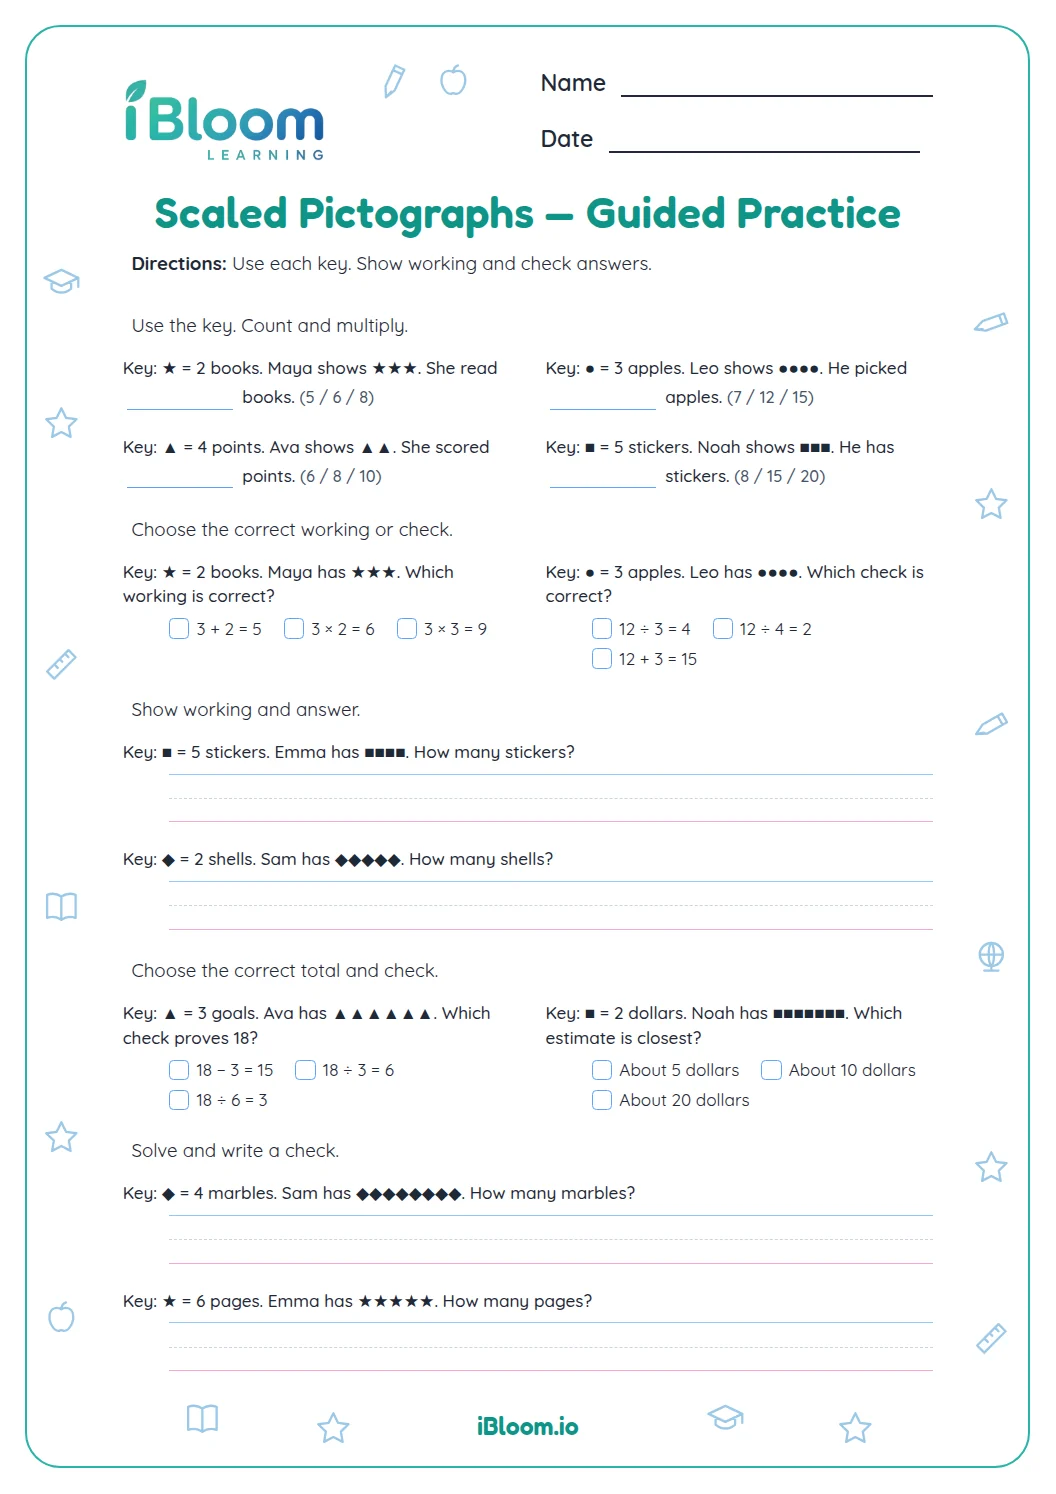
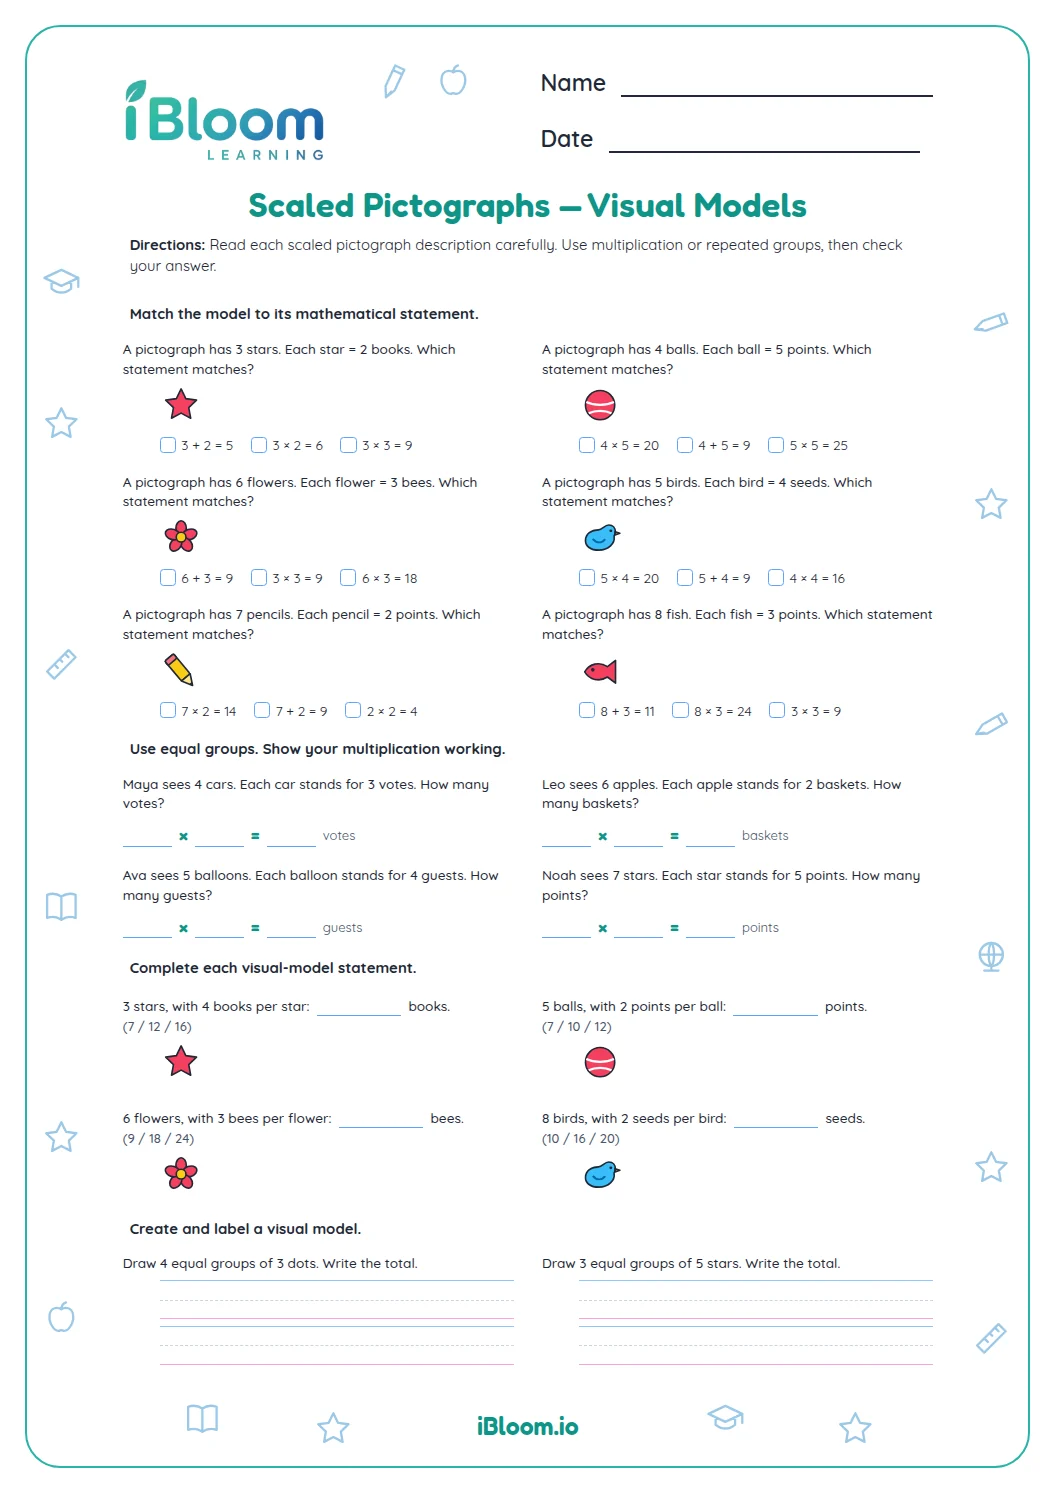
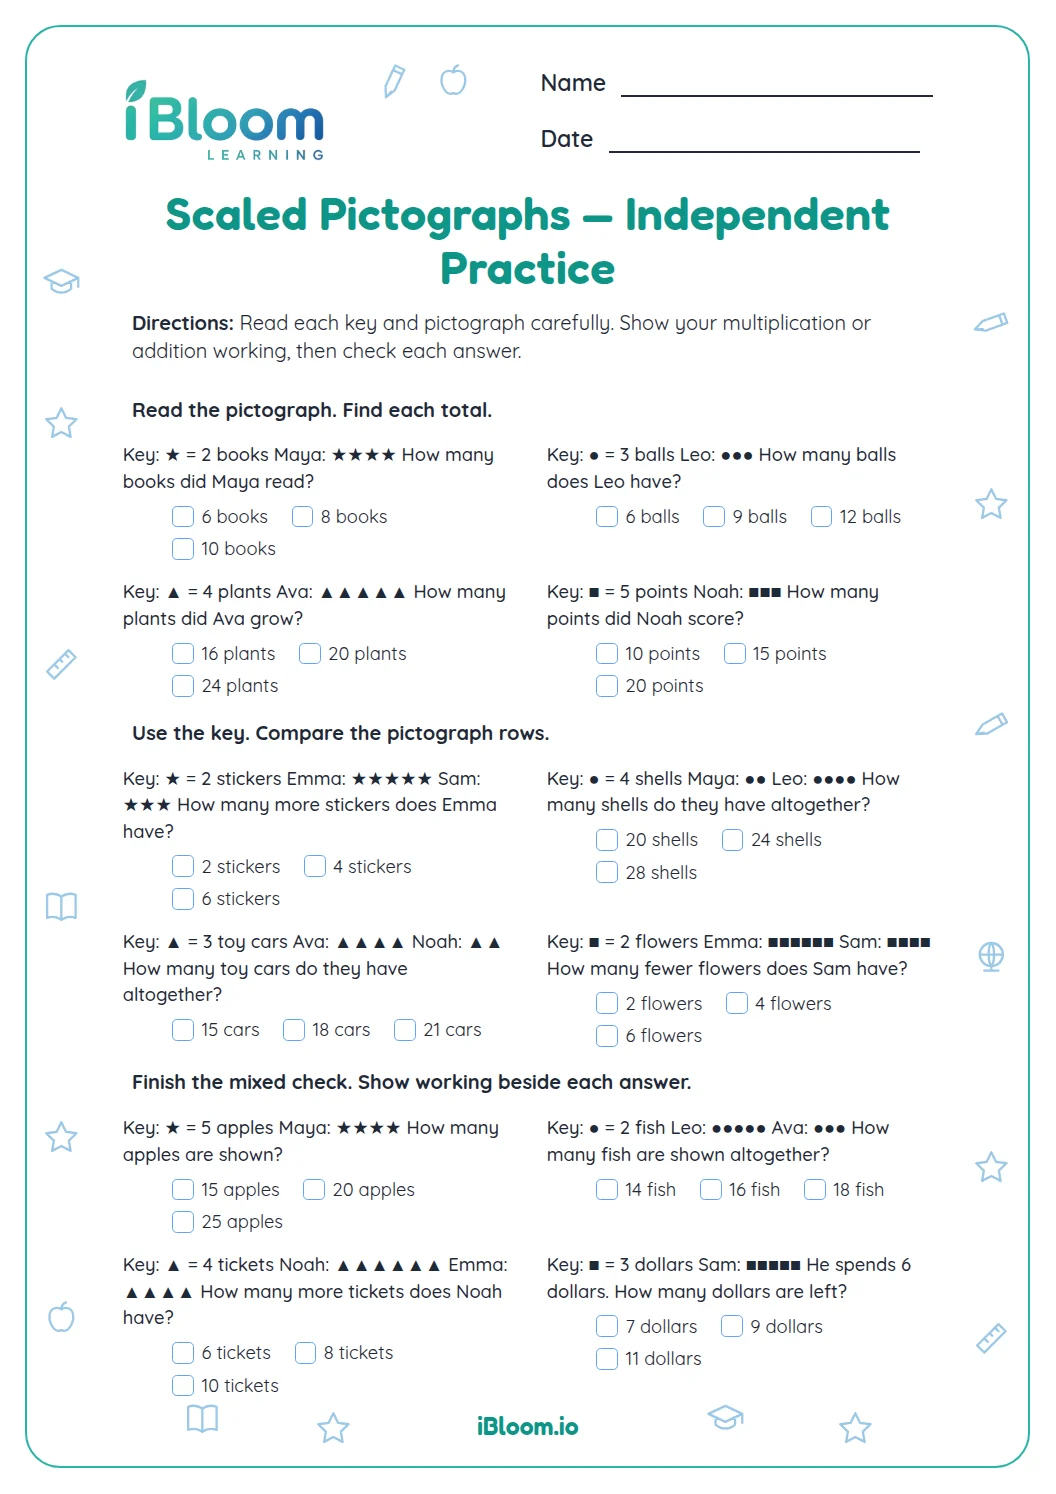
This Grade 3 printable pairs a drawn tally model with a scaled picture graph. Students count groups of five, read the picture key, compare categories and find totals. Fourteen compact questions move from tally reading to graph interpretation, with a separate answer key. The graph uses a matching picture for each activity.
Aligned to 3.MD.B.3
How do tally groups show a count?
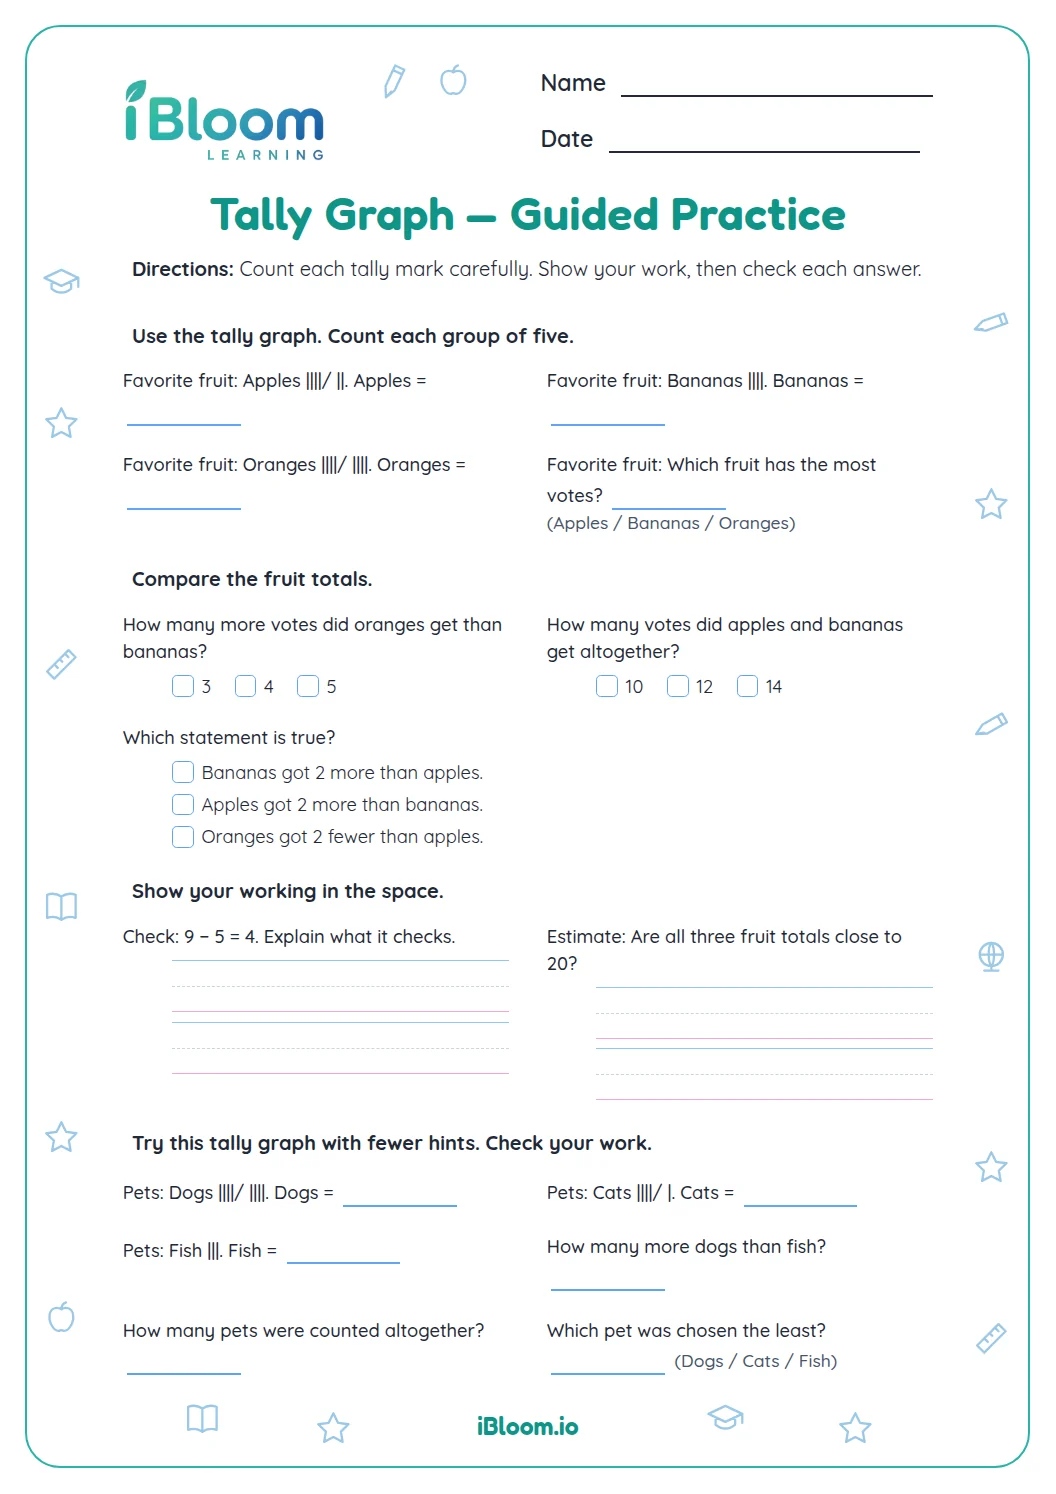
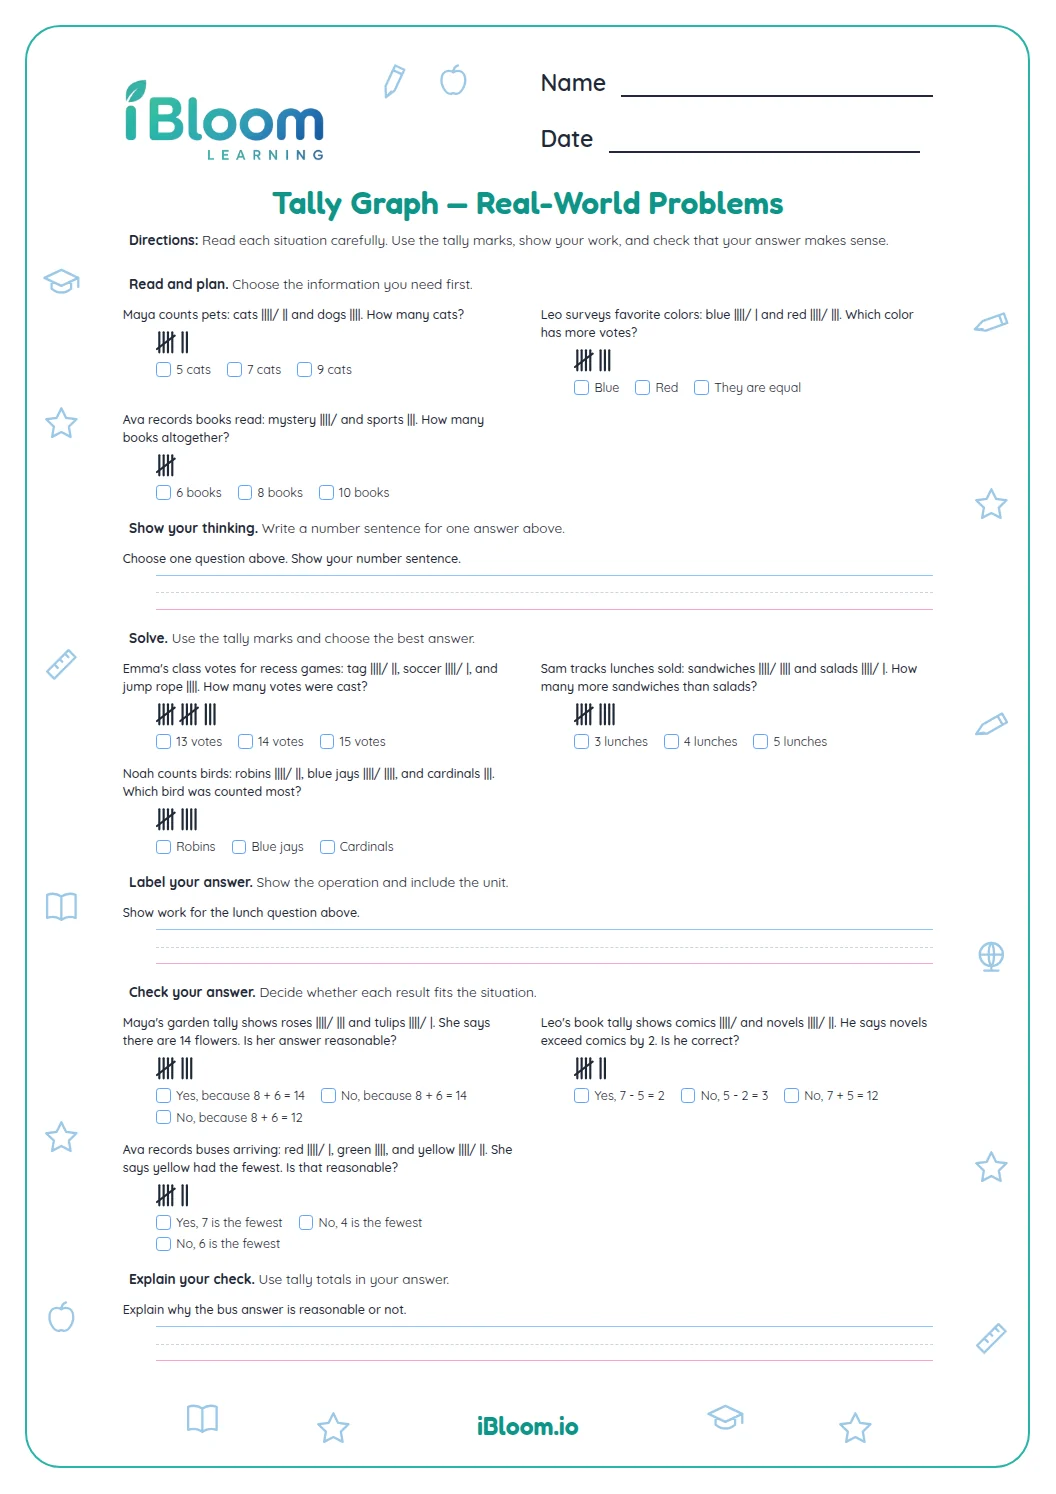
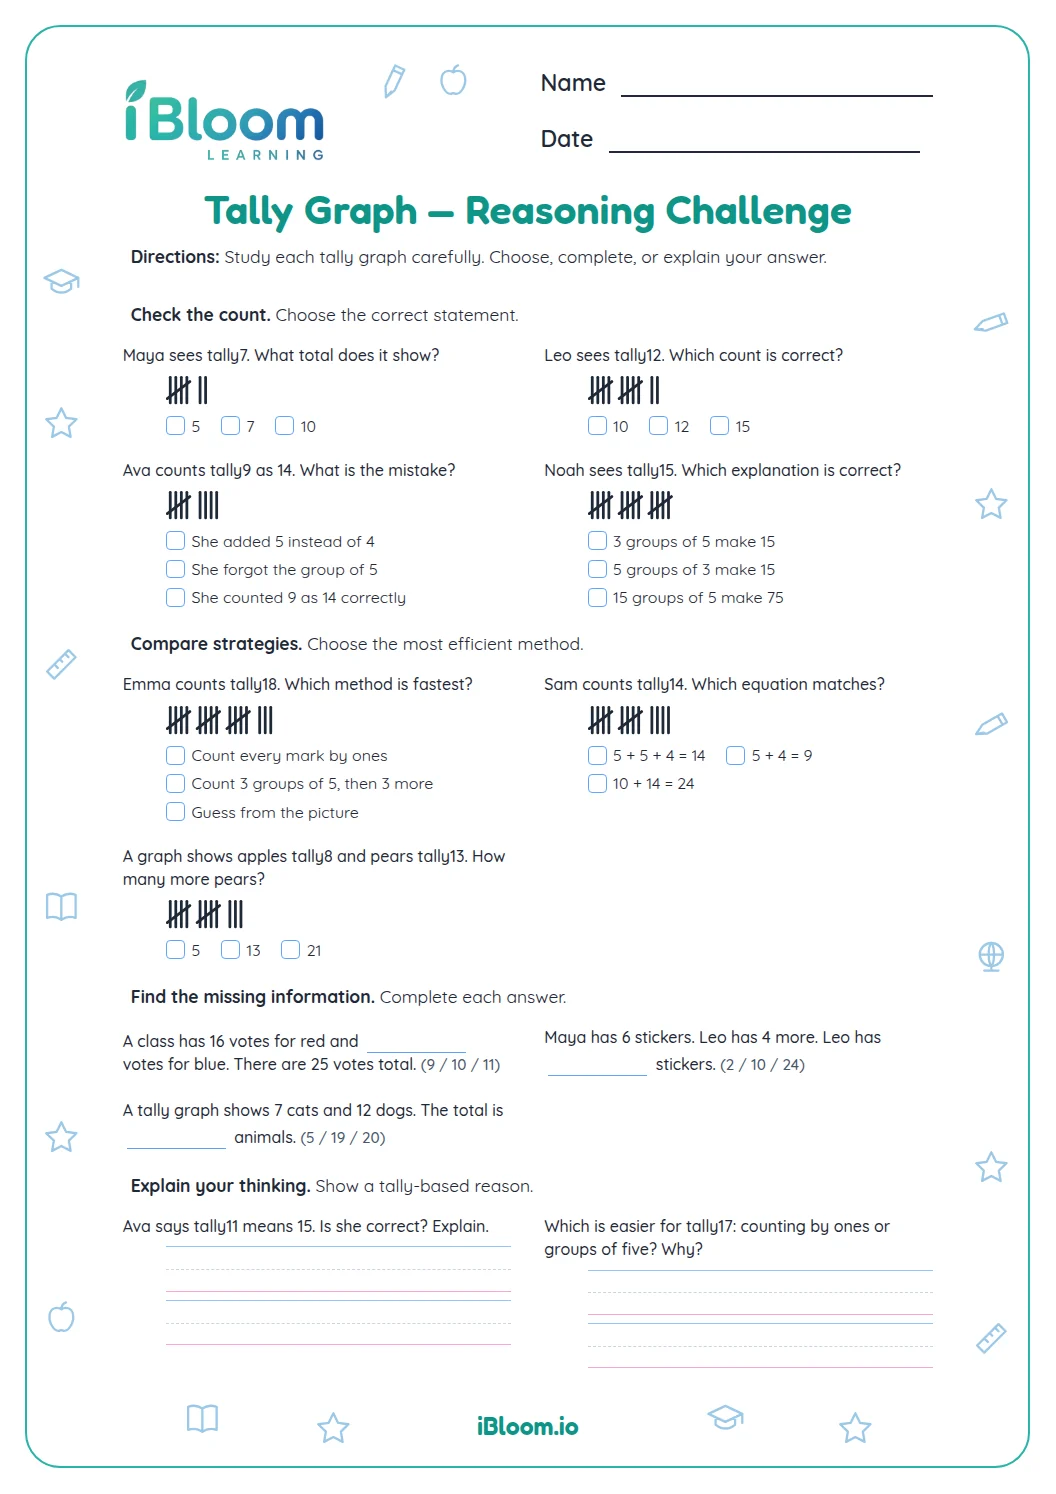
Count each crossed bundle as five, then add single strokes. Question 1 shows seven votes: one group of five and two singles.
- 11 bundle of 5 + 2 singles = 7
How does the picture graph key work?
Each soccer-ball or book picture stands for two votes. Tag has two ball symbols for 4 votes; Read has one book symbol for 2.
How can you compare graph counts?
Read the picture count for each category, then add or subtract as needed. Tag has 4 votes and Read has 2, so Tag has twice as many.
How to use this worksheet
- 1Count each tally bundle as five before counting singles.
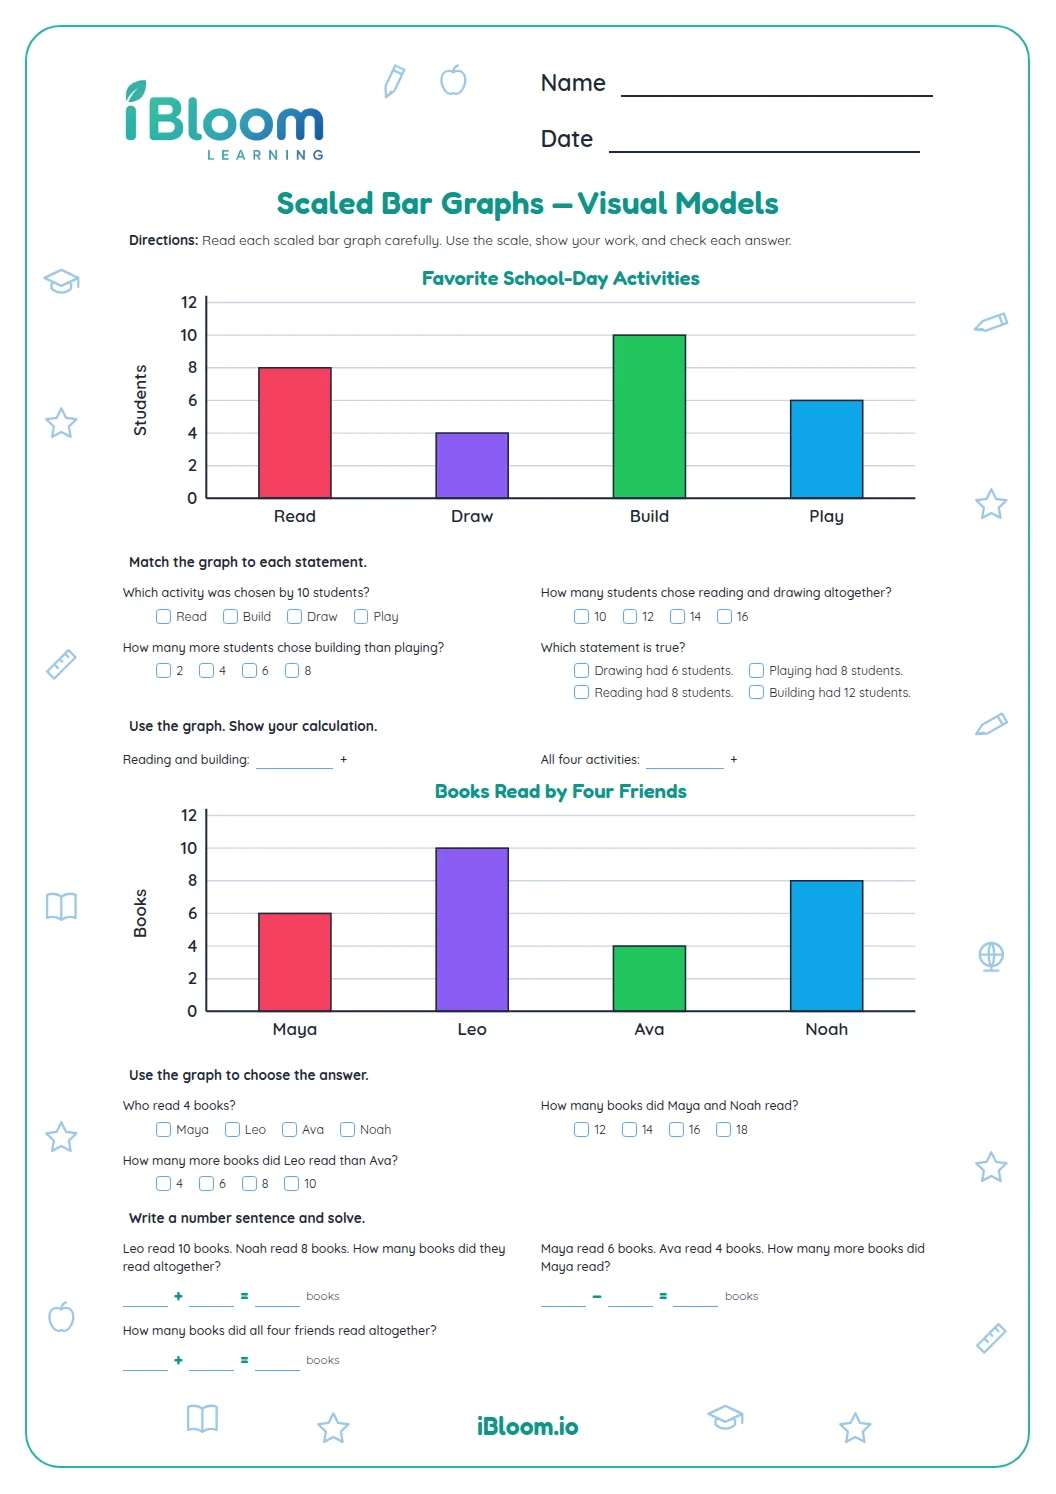
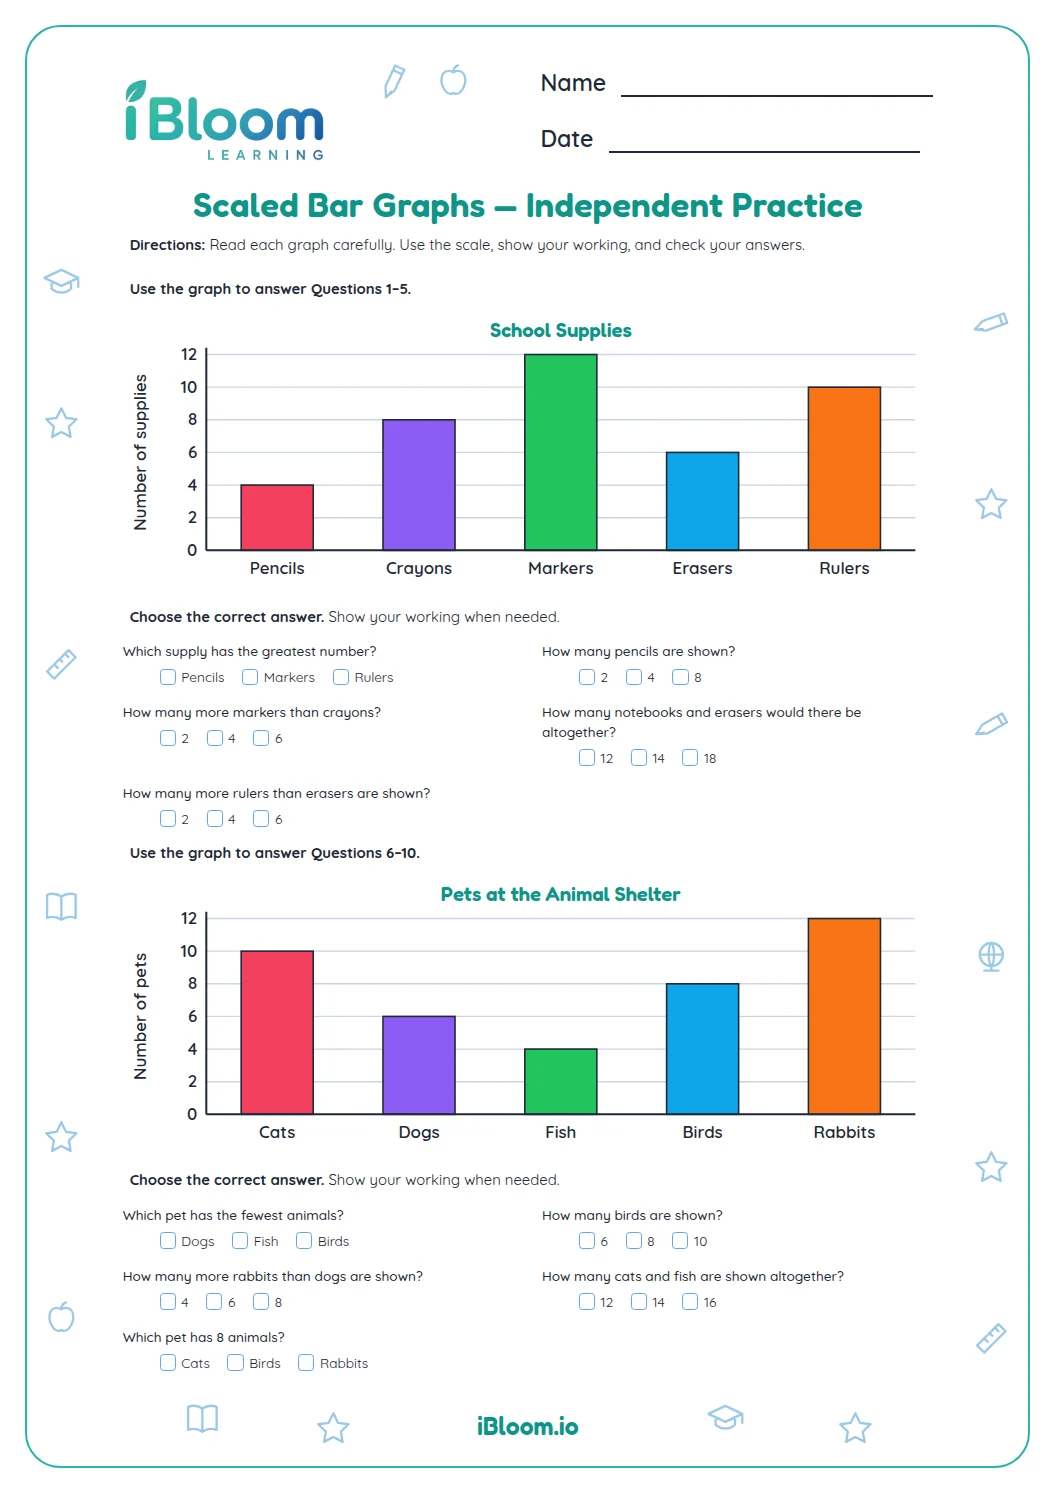
- 2Read the category label before following a bar.
- 3Use the graph scale to find each value.
- 4Add named values for a total.
- 5Subtract to compare two categories.
Common mistakes and quick fixes
The mistake
Counting the slash as an extra mark.
The fix
Treat all five strokes in the crossed bundle as one group.
The mistake
Reading a bar from the wrong scale mark.
The fix
Start at zero and count by the scale interval.
The mistake
Adding categories that the question did not name.
The fix
Underline the categories requested before finding their values.
Common Core alignment
Read category data, use graph scales, and solve comparison and total questions.
On this sheet: reading tally marks and bar graphs practice on the worksheet.
Show the official wordingHide the official wording
Draw a scaled picture graph and a scaled bar graph to represent a data set with several categories. Solve one- and two-step “how many more” and “how many less” problems using information presented in scaled bar graphs.
What to practice next
Make more practice
Further reading
Questions parents and teachers ask
How are tally marks grouped?
A crossed tally bundle represents five marks, and any marks after it count one each. This worksheet starts with a drawn tally model and includes short questions about groups of five. The separate answer key lists the expected count for every item.
What does each picture stand for?
Each picture in the graph represents two votes. The soccer-ball row shows Tag, and the book row shows Read, so students count the symbols and apply the key to find each total. The model appears with the first graph question.
How can students compare the picture graph rows?
Use the key to find the total for each row, then subtract or compare the results. Tag has two symbols worth two votes each, while Read has one. The answer key lists the totals for students to check.
How many questions are included?
There are 14 questions: four tally count and grouping items, followed by ten questions about a keyed picture graph. The problems practice reading, comparing and combining counts. A separate answer key follows the worksheet for checking responses at home or school.
How can a student check a graph total?
Count the symbols in the named row, then multiply by the key value. For Tag, two symbols represent four votes. Compare the result with the graph question and use the answer key after finishing to check the response.