


About this worksheet
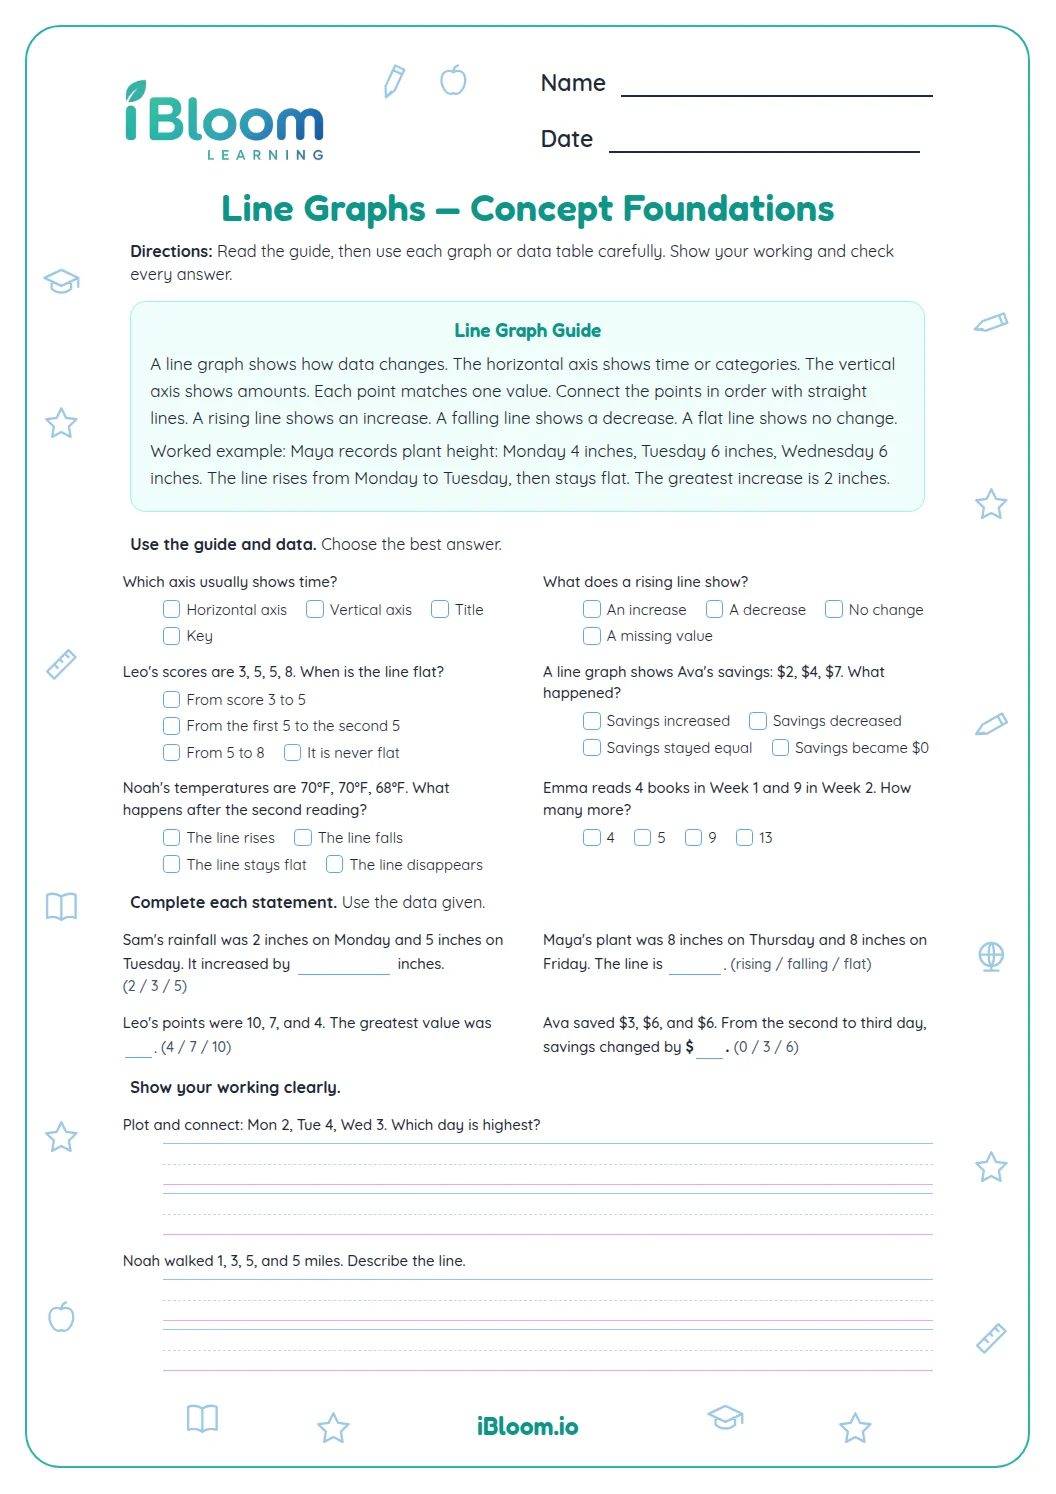
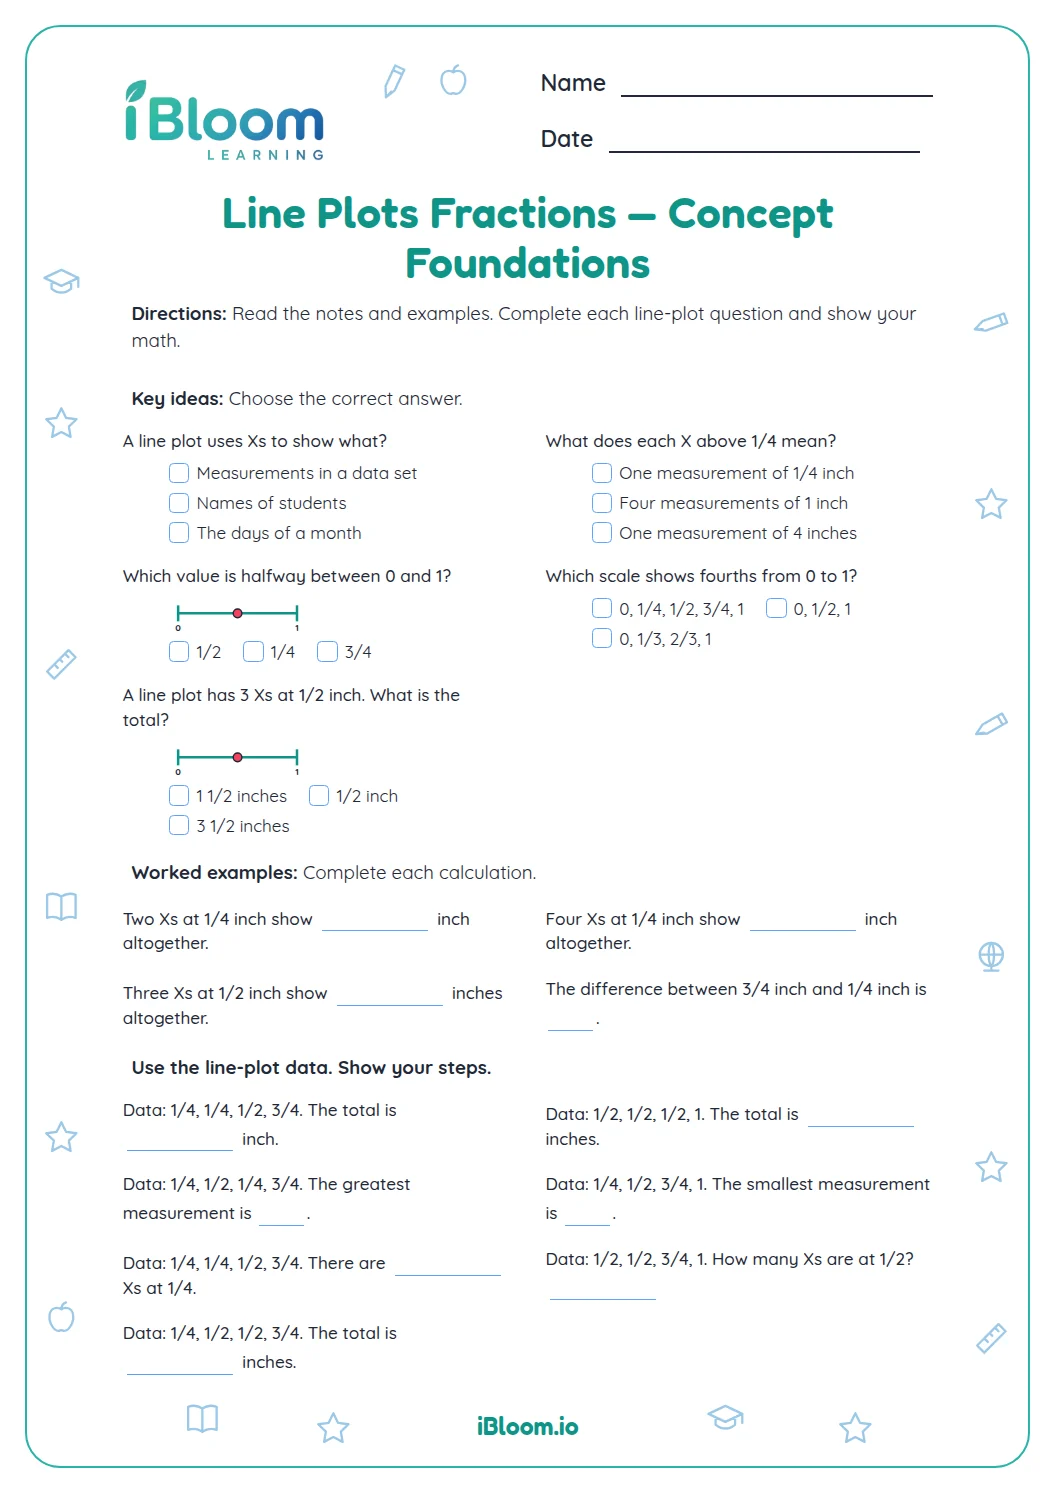
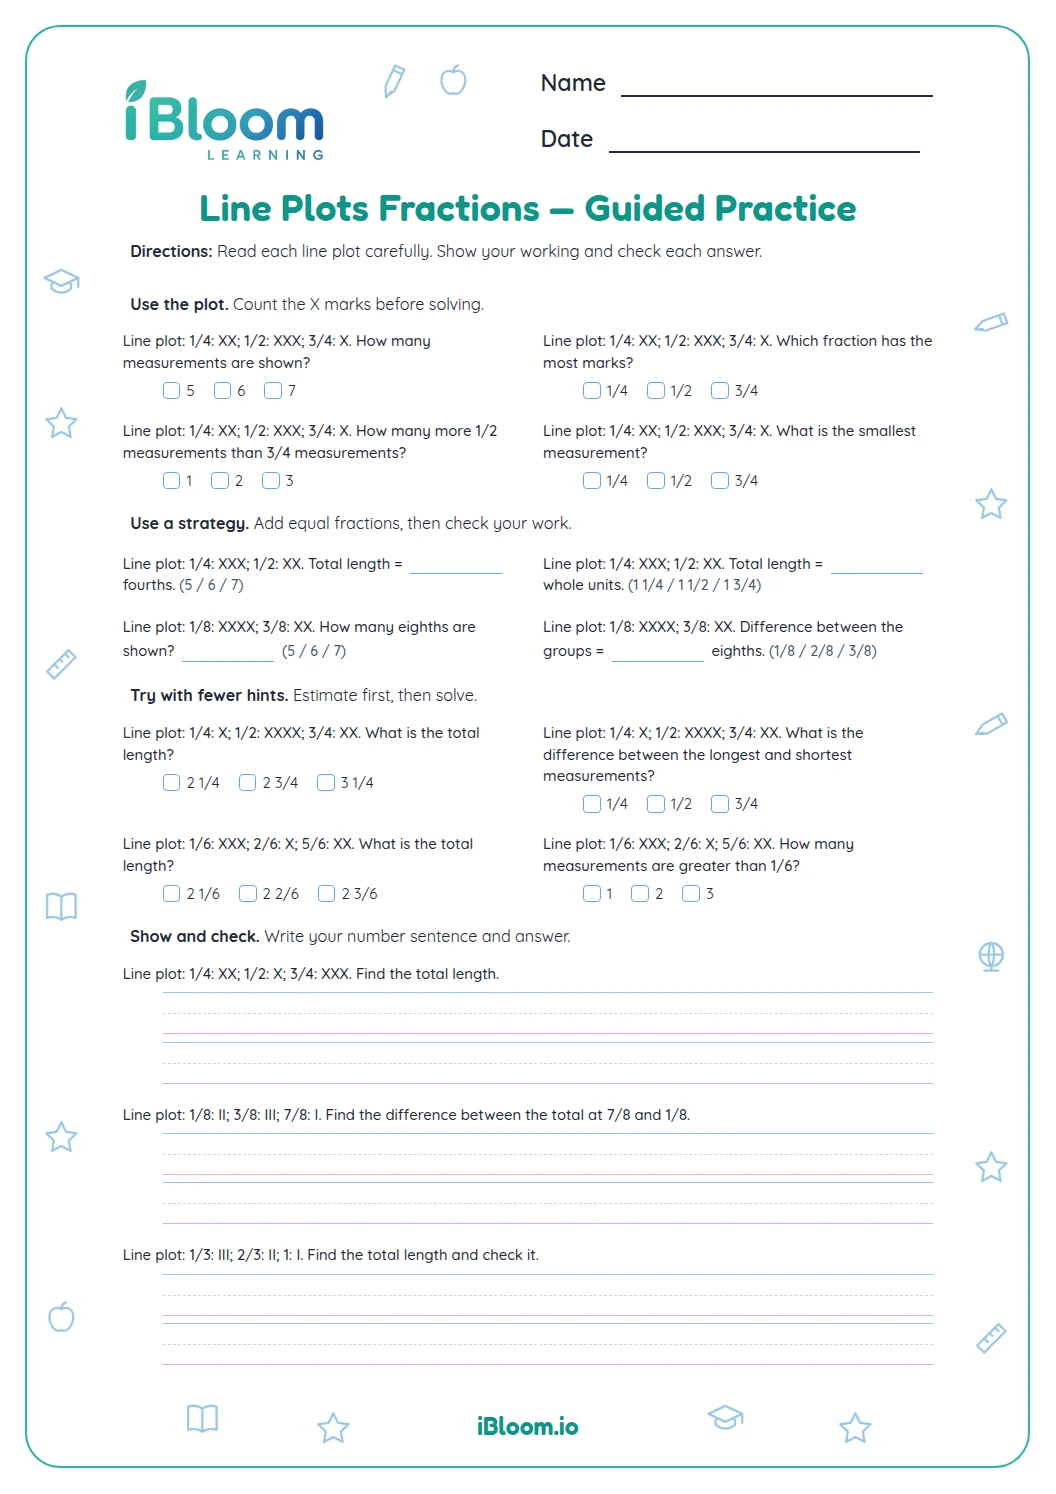
This Grade 4 printable uses a line graph of monthly book counts. Students read each plotted value, compare months, and calculate totals and differences from the graph. The final questions change a stated month’s count and ask students to find the new value.
How do you read a graph carefully?
Start with the title to learn what the graph measures. Read the month labels and the value scale before comparing points. The line connects monthly counts and makes increases and decreases easy to spot.
What makes these graph questions challenging?
Part A reads and compares the five monthly points. Part B adds values, finds differences, and calculates counts after a stated change.
How to use this worksheet
- 1Read the graph title, month labels, and scale.
- 2Locate a point above the named month and follow it to the value axis.
- 3Use addition or subtraction for totals and differences.
- 4For a changed-count question, alter only the month named.
Common slips
The mistake
Reading a point from the wrong month.
The fix
Follow straight up from the month label to the point.
The mistake
Treating every grid interval as one book.
The fix
Read the numbered scale; each interval here is five books.
The mistake
Changing more than one monthly value in a what-if item.
The fix
Keep all other plotted values the same.
What to practice next
Make more practice
Questions parents and teachers ask
Why does the bar graph use a scale of six?
The vertical scale is marked in fives because the plotted monthly counts are multiples of five. Read the numbered labels before counting intervals. Each step up the graph represents five books, so a point one interval above 30 represents 35 books.
How do I read a value from this line graph?
Find the month on the horizontal axis, move up to the plotted point, and read across to the vertical scale. For example, April lines up with 35 books. The graph is a line graph, so each point represents that month’s count.
What calculations appear on the page?
Students read the five monthly values, compare counts, calculate sums and differences, and find updated values after a stated change. Every calculation comes from the same line graph. Its vertical scale advances by five books at each step. These problems use only the five displayed monthly points.
Is an answer key included?
Yes. The answer key lists each graph-reading and calculation result. For a question that changes one month’s count, the key applies that change only to the named month and leaves all the other plotted values as they were. It also shows which graph values support those results.
What does each point represent?
Each point represents the number of books read in one month. For example, the point above April aligns with 35 on the vertical scale. Read the month first, then follow the point to the scale before comparing or calculating.