
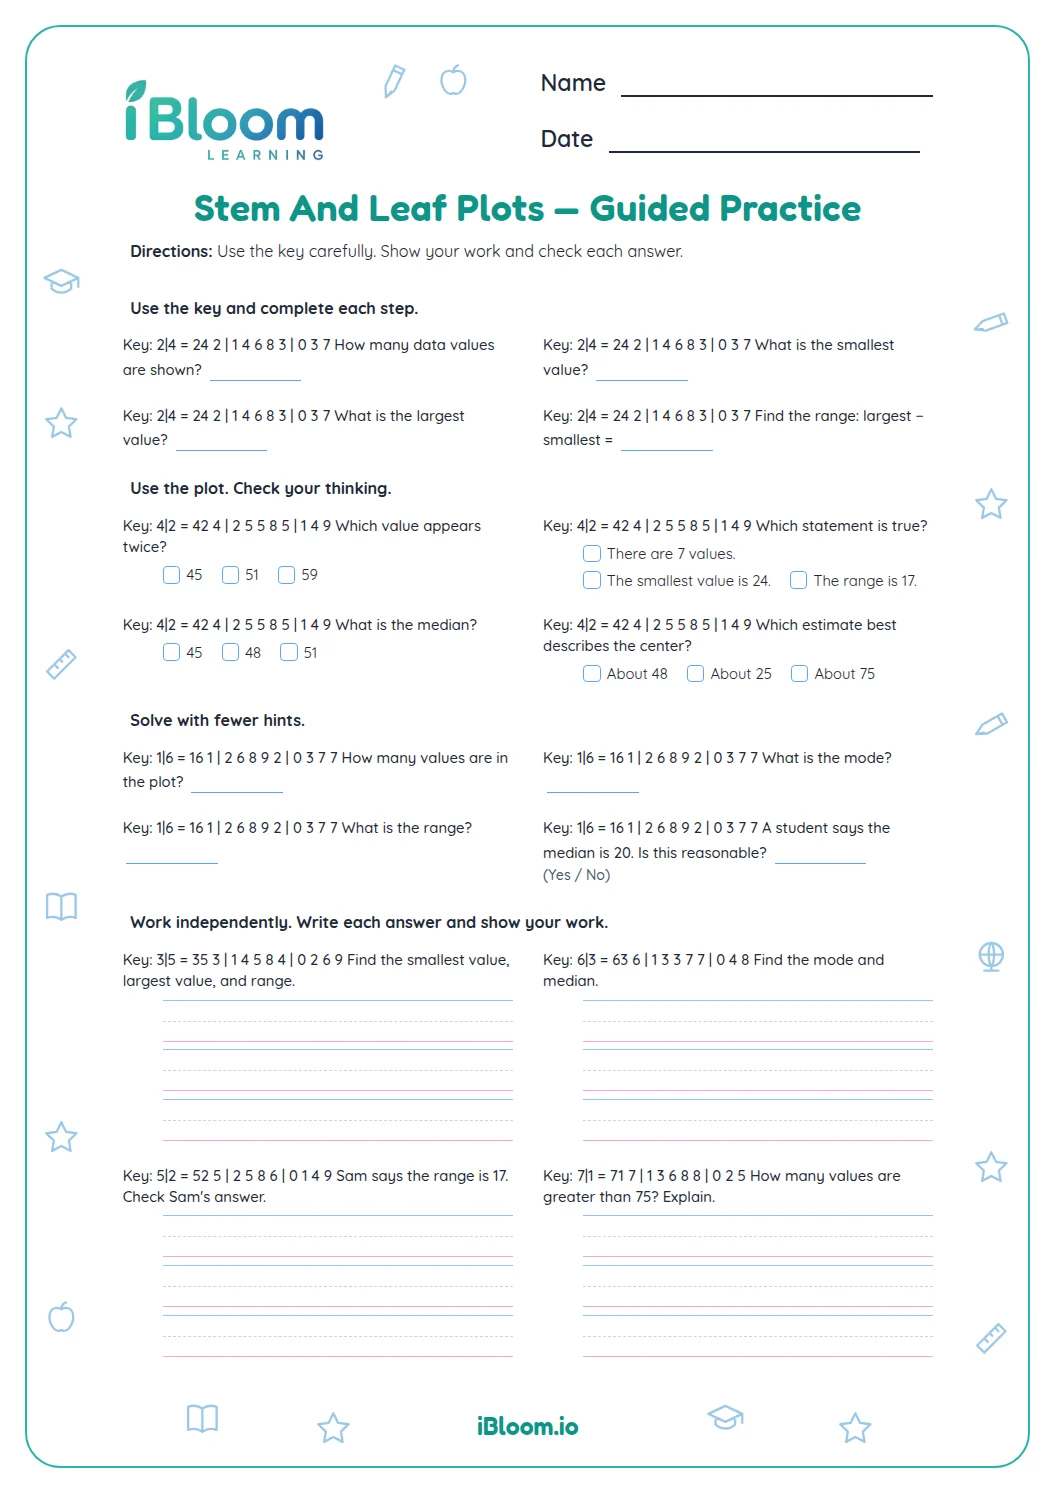
About this worksheet
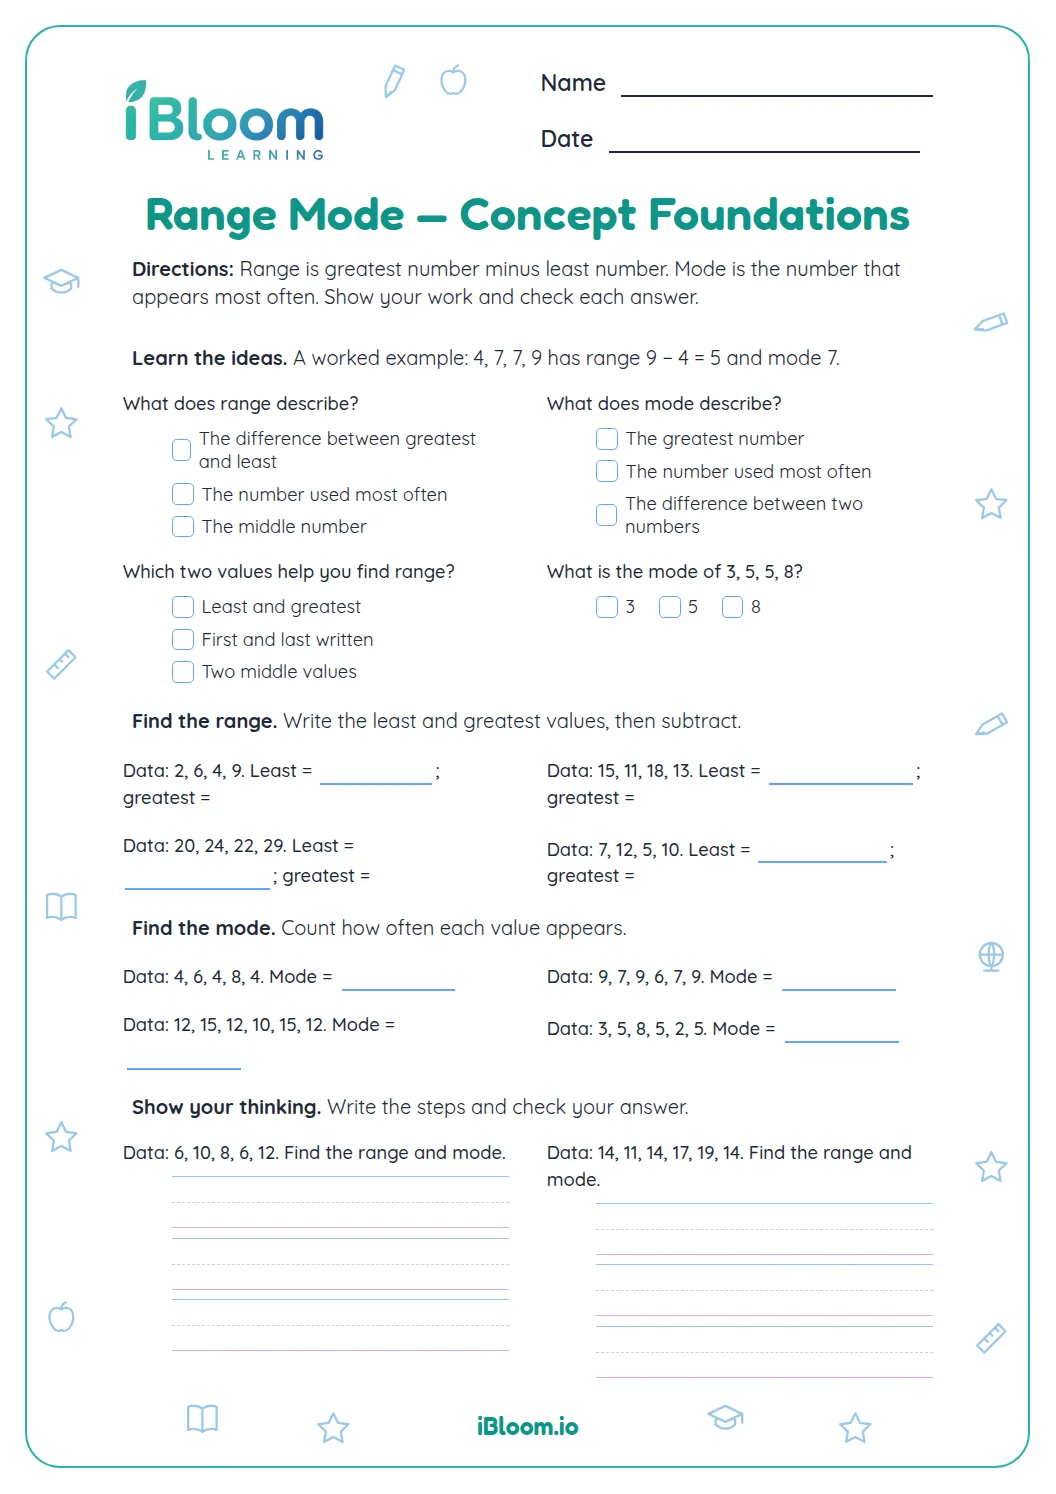
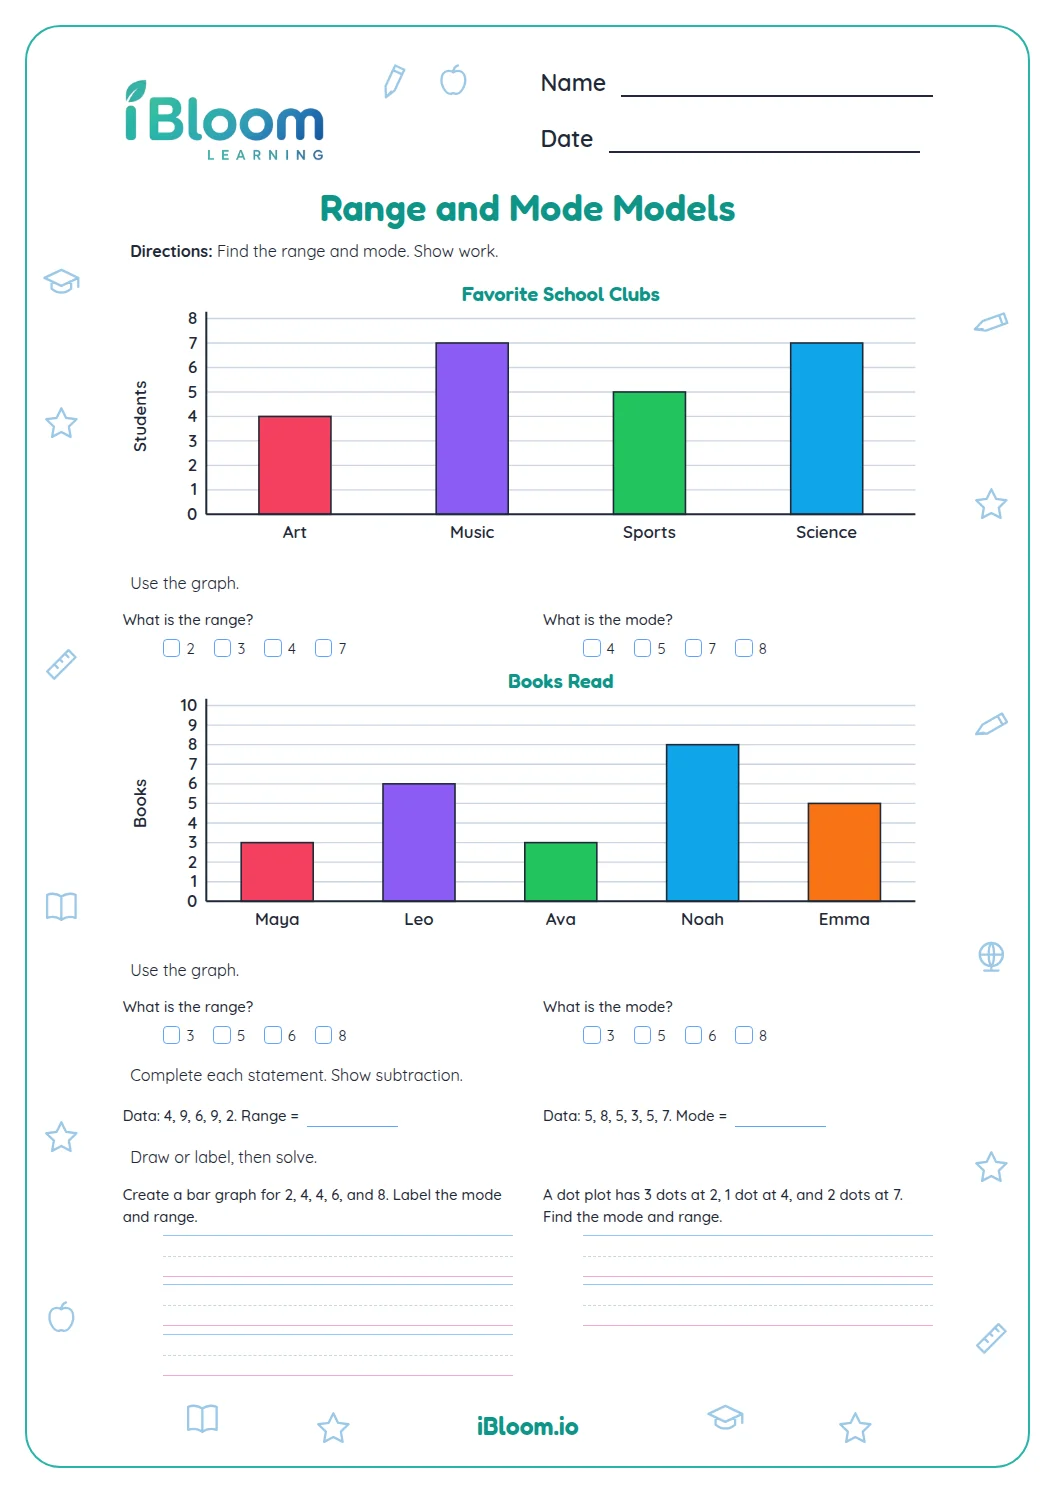
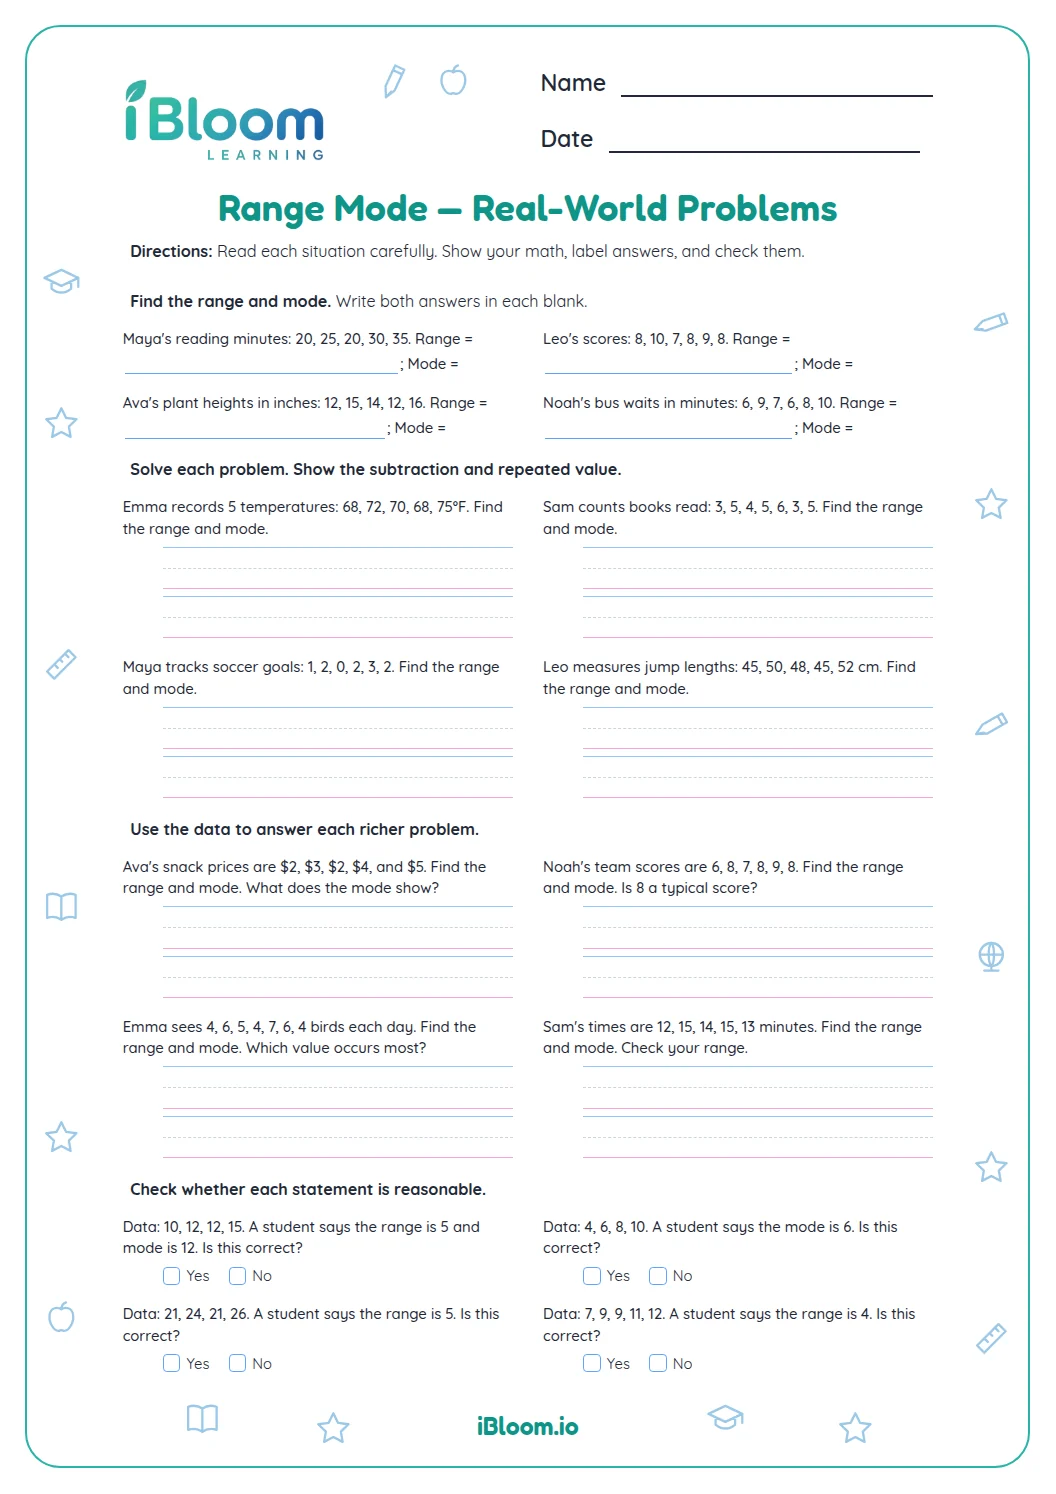
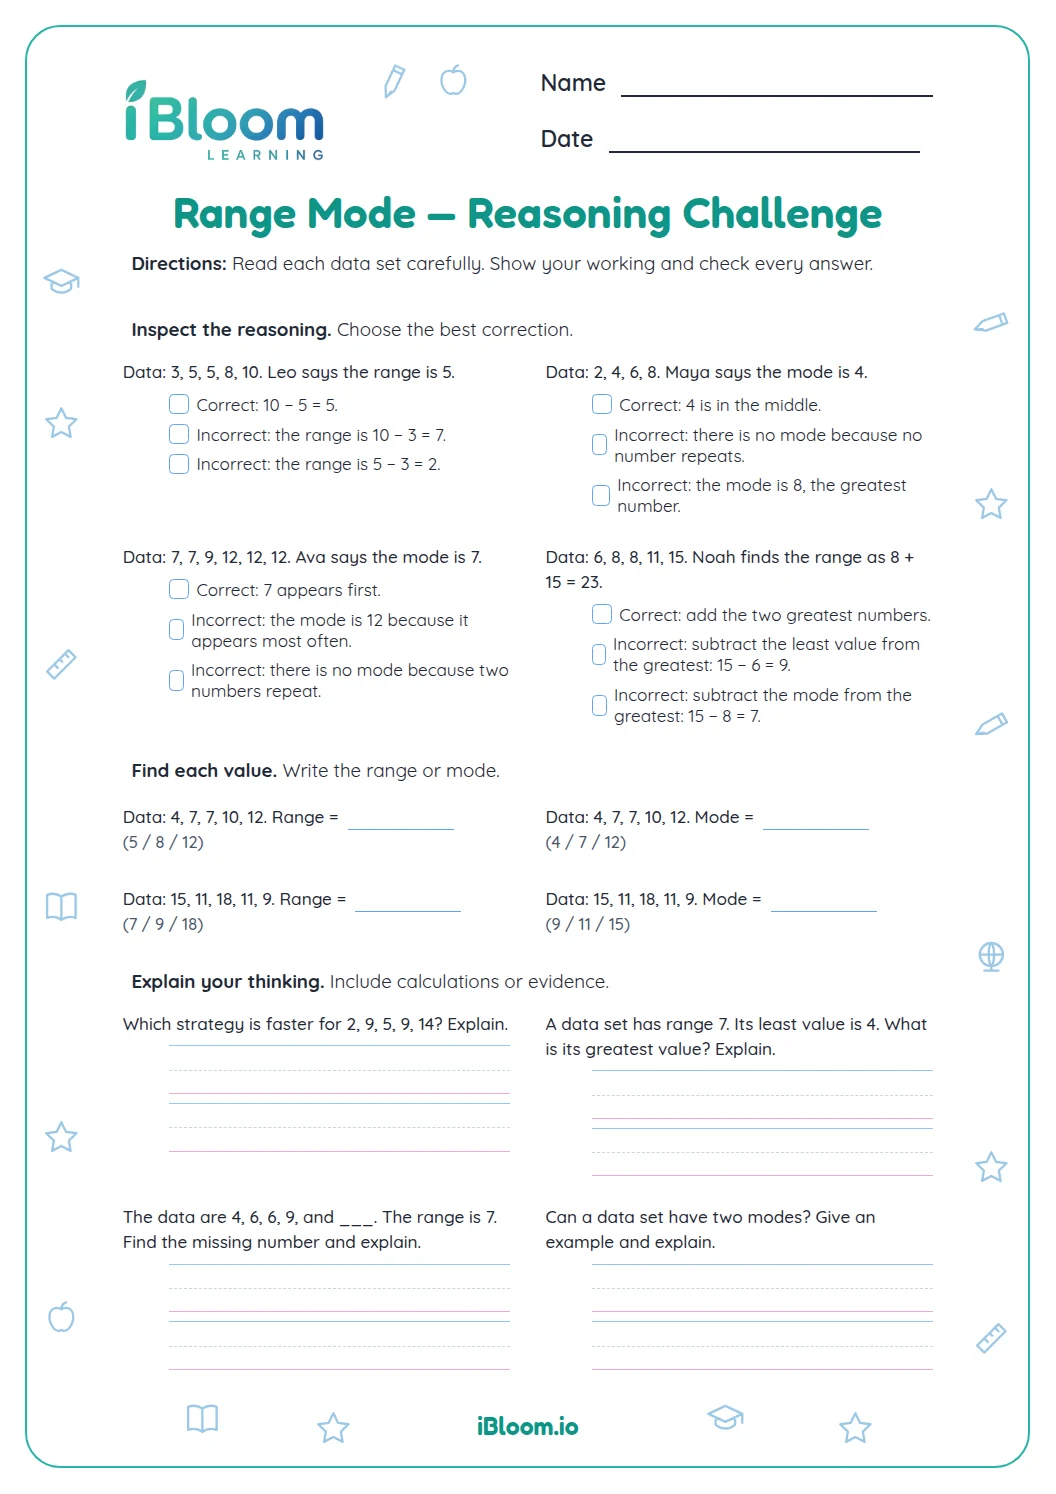
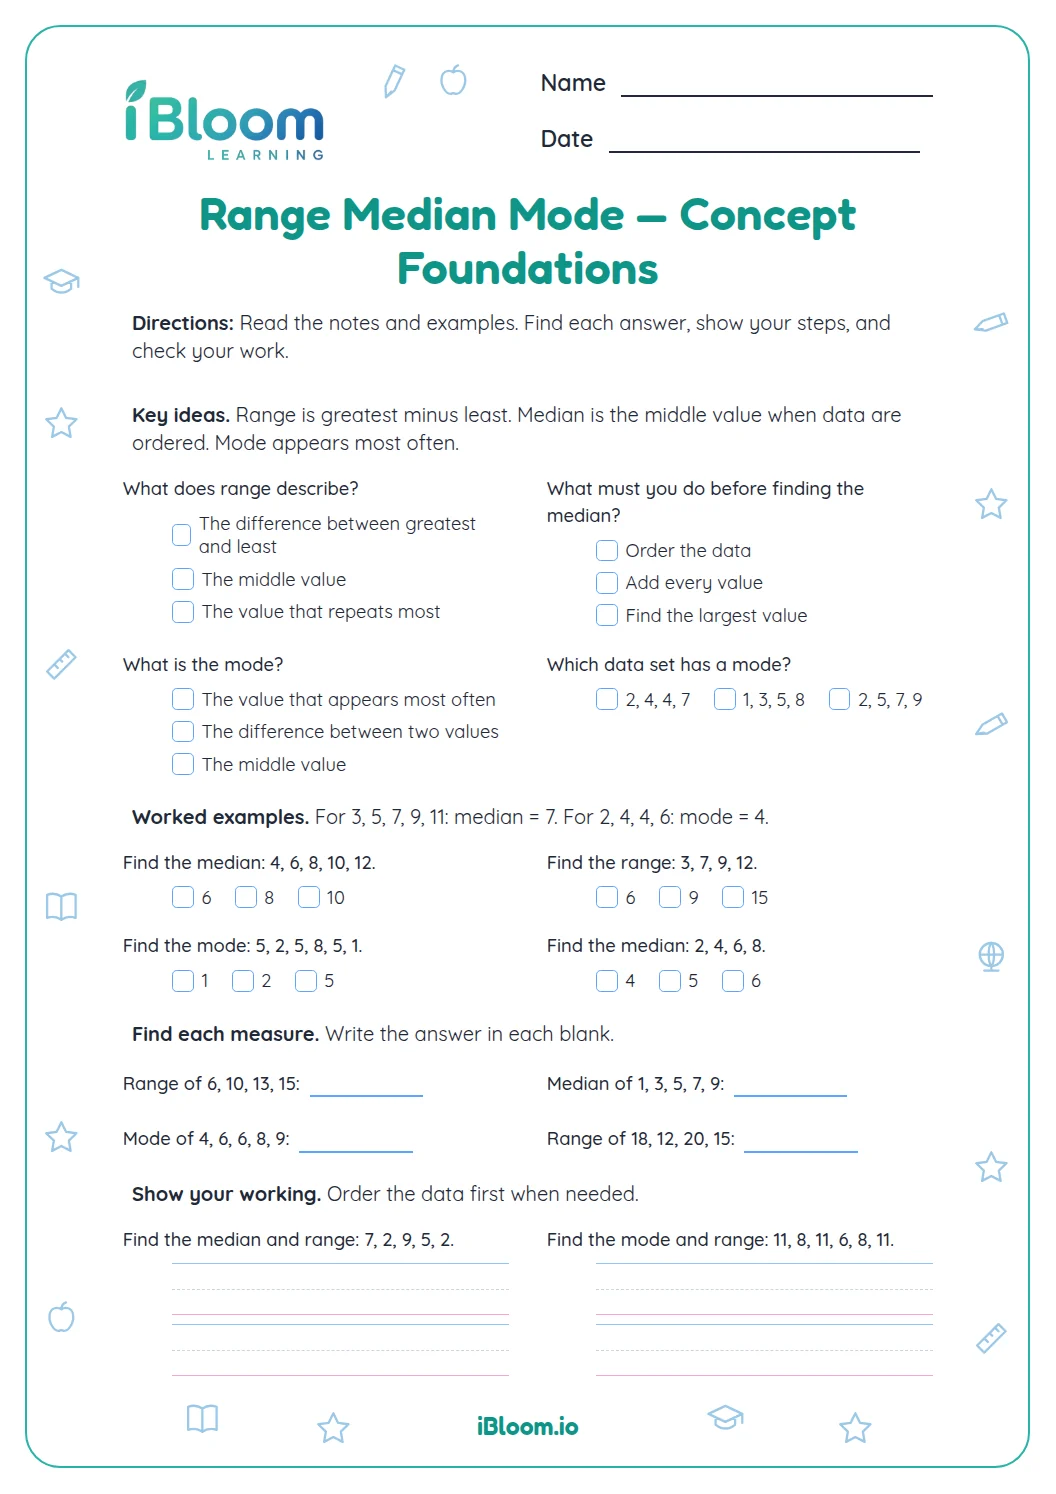
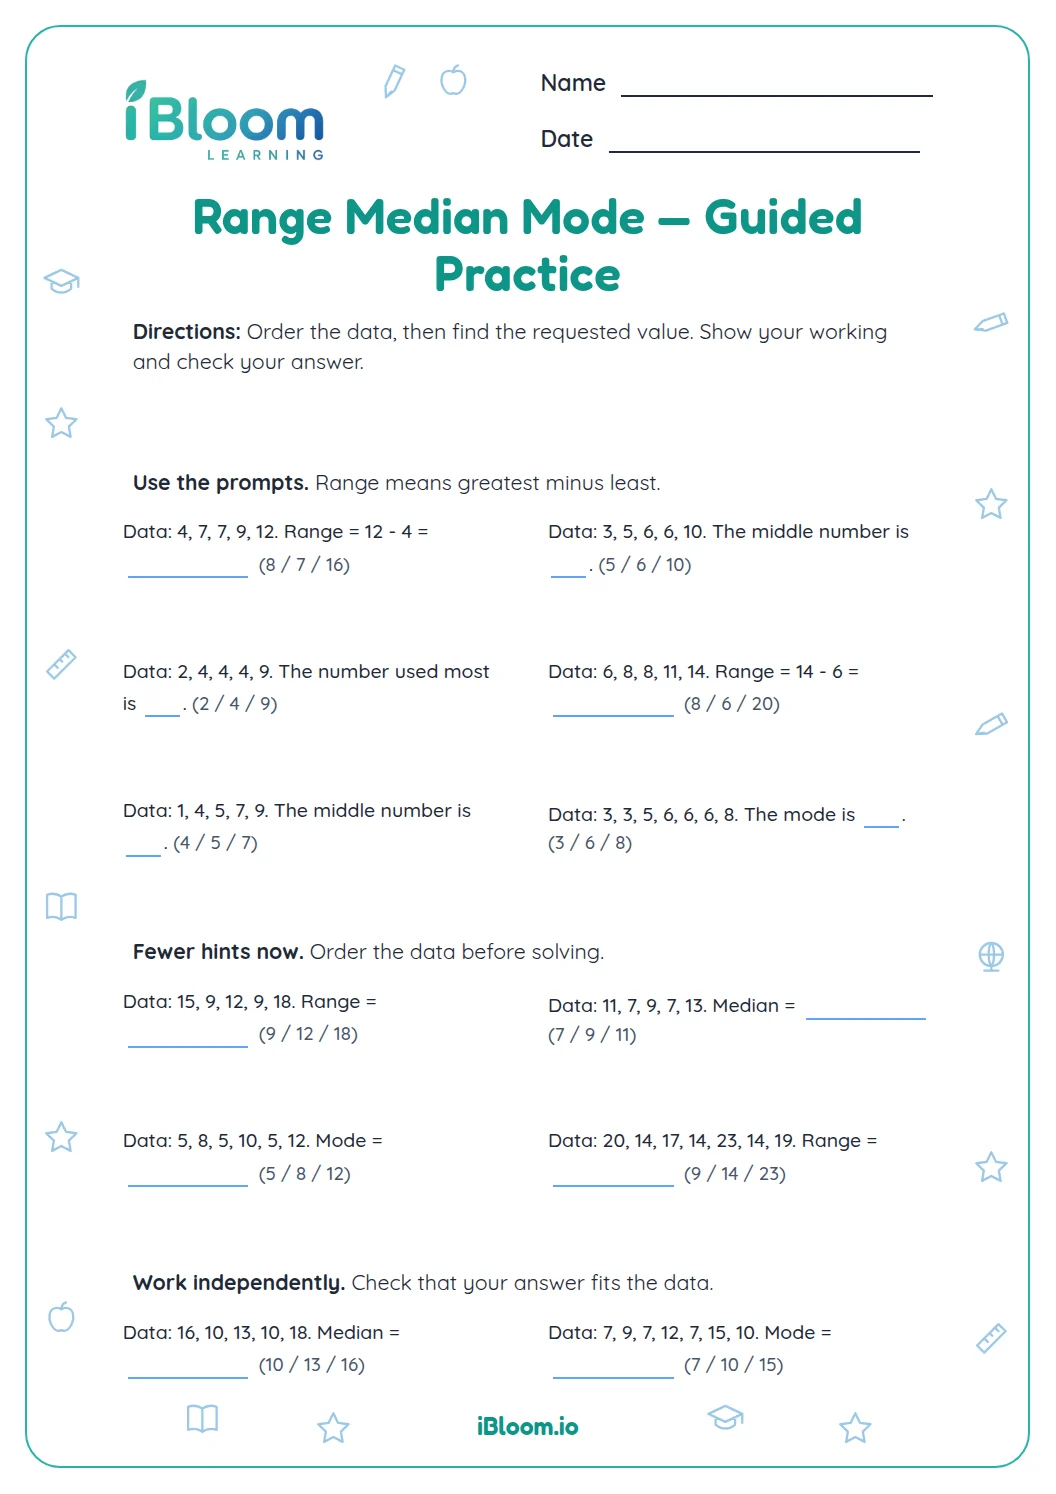
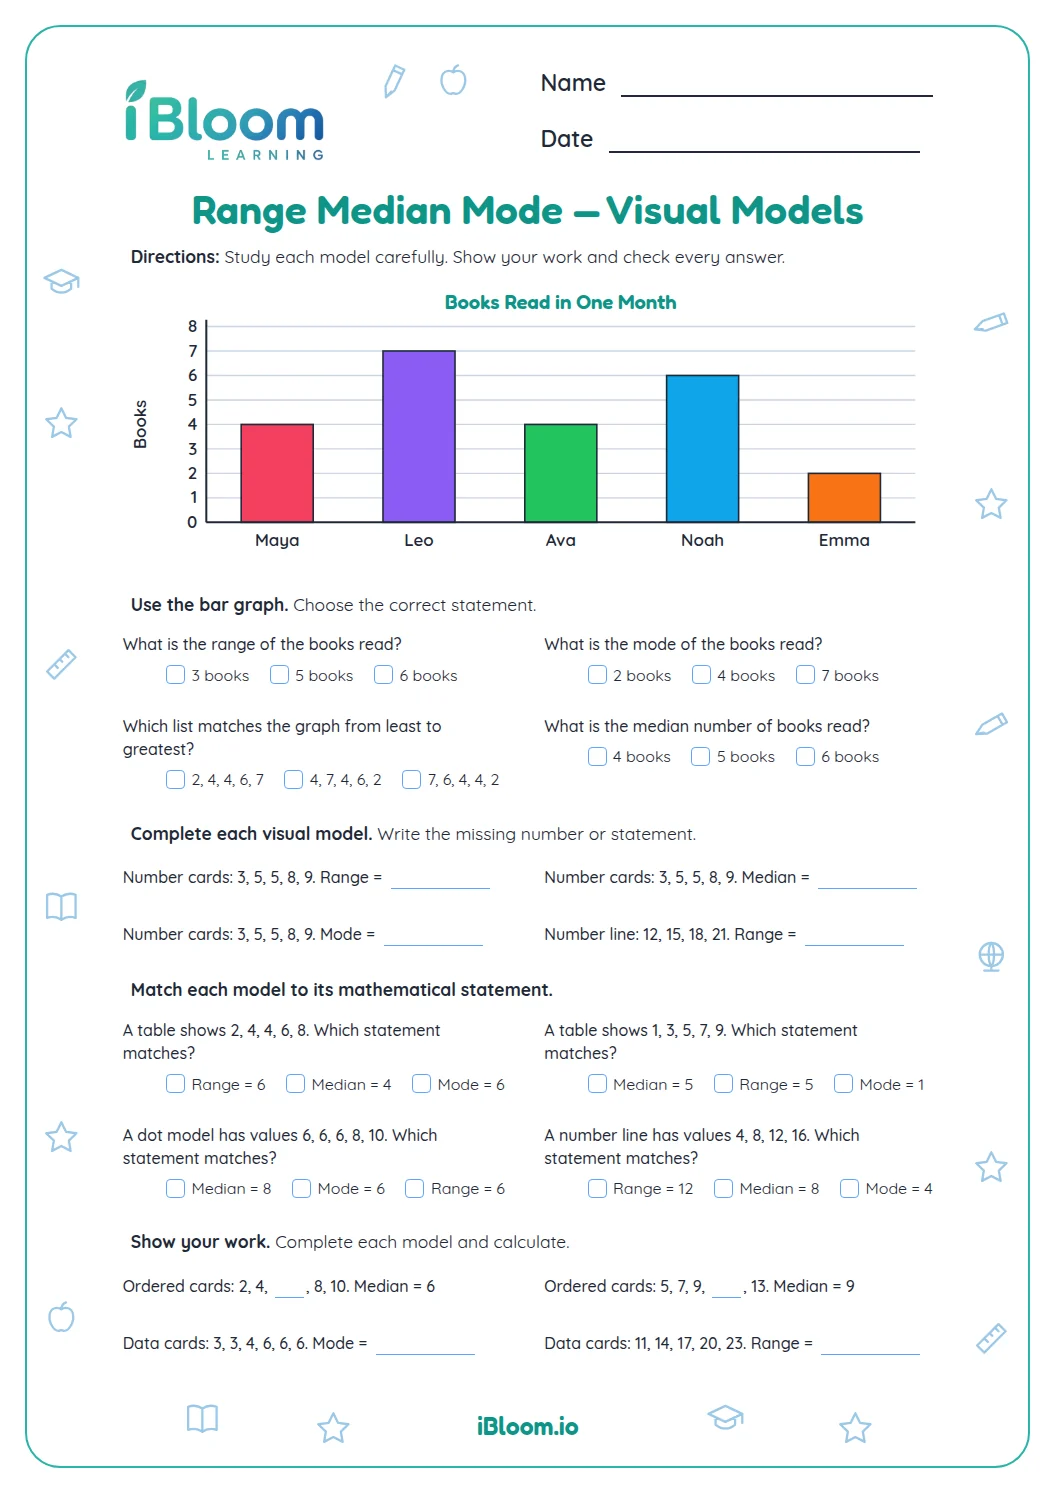
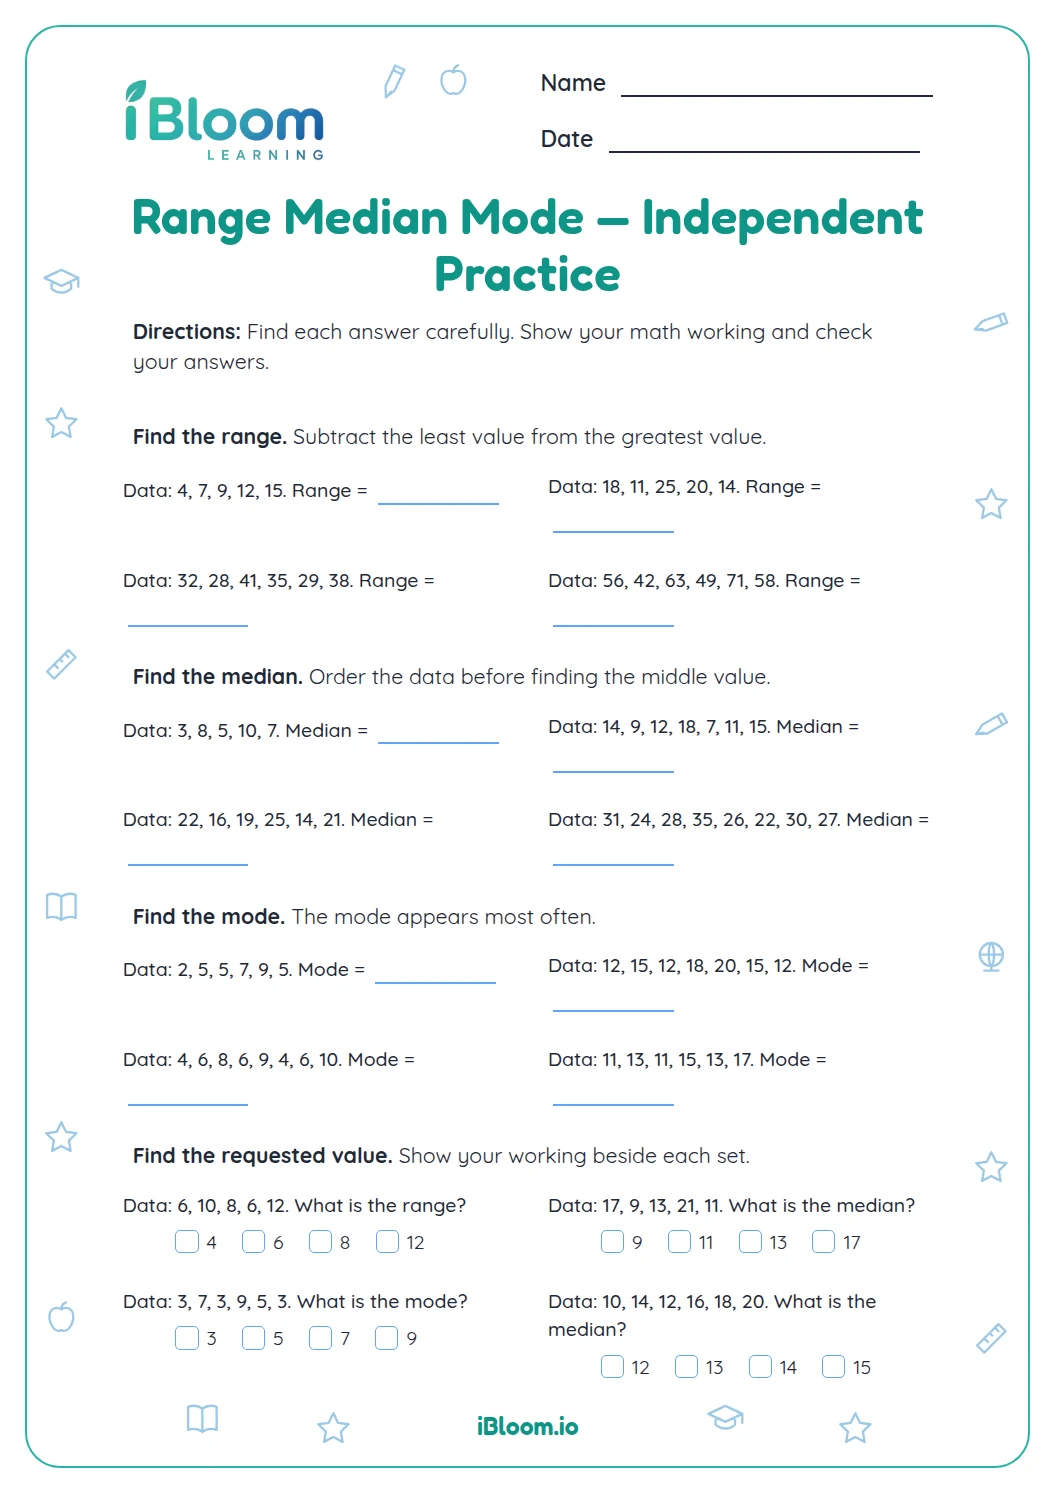
This free printable Grade 5 worksheet uses 14 data sets to practice range and mode. Children subtract the least value from the greatest to find range, count repeats to find mode, and apply both measures in combined questions. A separate answer key lists each result.
How do you calculate range?
Interpret data sets and calculate summary measures from their values.
Scores 12, 16, 14, 16 and 19 have least 12 and greatest 19, so range is 7.
- 1Least value: 12
- 2Greatest value: 19
- 3Range: 19 − 12 = 7
How do you identify the mode?
Question 5 has 12 appearing most often.
How do the measures work together?
Question 9 has range 12 − 6 = 6 and mode 8.
How to use this worksheet
- 1Read every value in the data set.
- 2For range, find the least and greatest values.
- 3Subtract least from greatest.
- 4For mode, count how often each value appears.
- 5Check whether the prompt asks for one measure or both.
Common mistakes and fixes
The mistake
Adding the extremes to find range.
The fix
Subtract the least value from the greatest.
The mistake
Choosing the greatest value as the mode automatically.
The fix
Count each value; mode is the most frequent.
The mistake
Giving only one measure in a combined item.
The fix
Underline whether the question asks for range, mode, or both.
What to practice next
Make more practice
Questions parents and teachers ask
How do you calculate range?
Range is greatest minus least. In question 1, the greatest score is 19 and the least is 12, so 19 minus 12 equals 7. Marking the two extremes before subtracting helps make the calculation easy to check. Work through an example together before independent practice.
How do you identify mode?
Mode is the value that appears most often. Tallying repeats helps when several values appear more than once. In question 5, 12 appears three times, more often than any other value in that set. A tally can make each repeat easy to see.
Can adding a value change the range?
Yes. If a new value becomes the new least or greatest, recalculate from the updated extremes. If it falls between the old extremes, the range stays the same. Question 13 illustrates how adding a new maximum changes the difference.
Is there an answer key?
Yes. The separate answer key gives the range, mode or combined result for each of the 14 data questions. Show the subtraction or frequency count when reviewing a missed answer, then compare the calculation with the listed key.
How can range and mode be mixed up?
Range uses two extreme values and subtraction. Mode uses frequency. The largest number is not automatically the mode, and a repeated middle value can be the mode. Sorting or tallying the data helps keep these ideas separate. Explain the two procedures in the learner’s own words.