
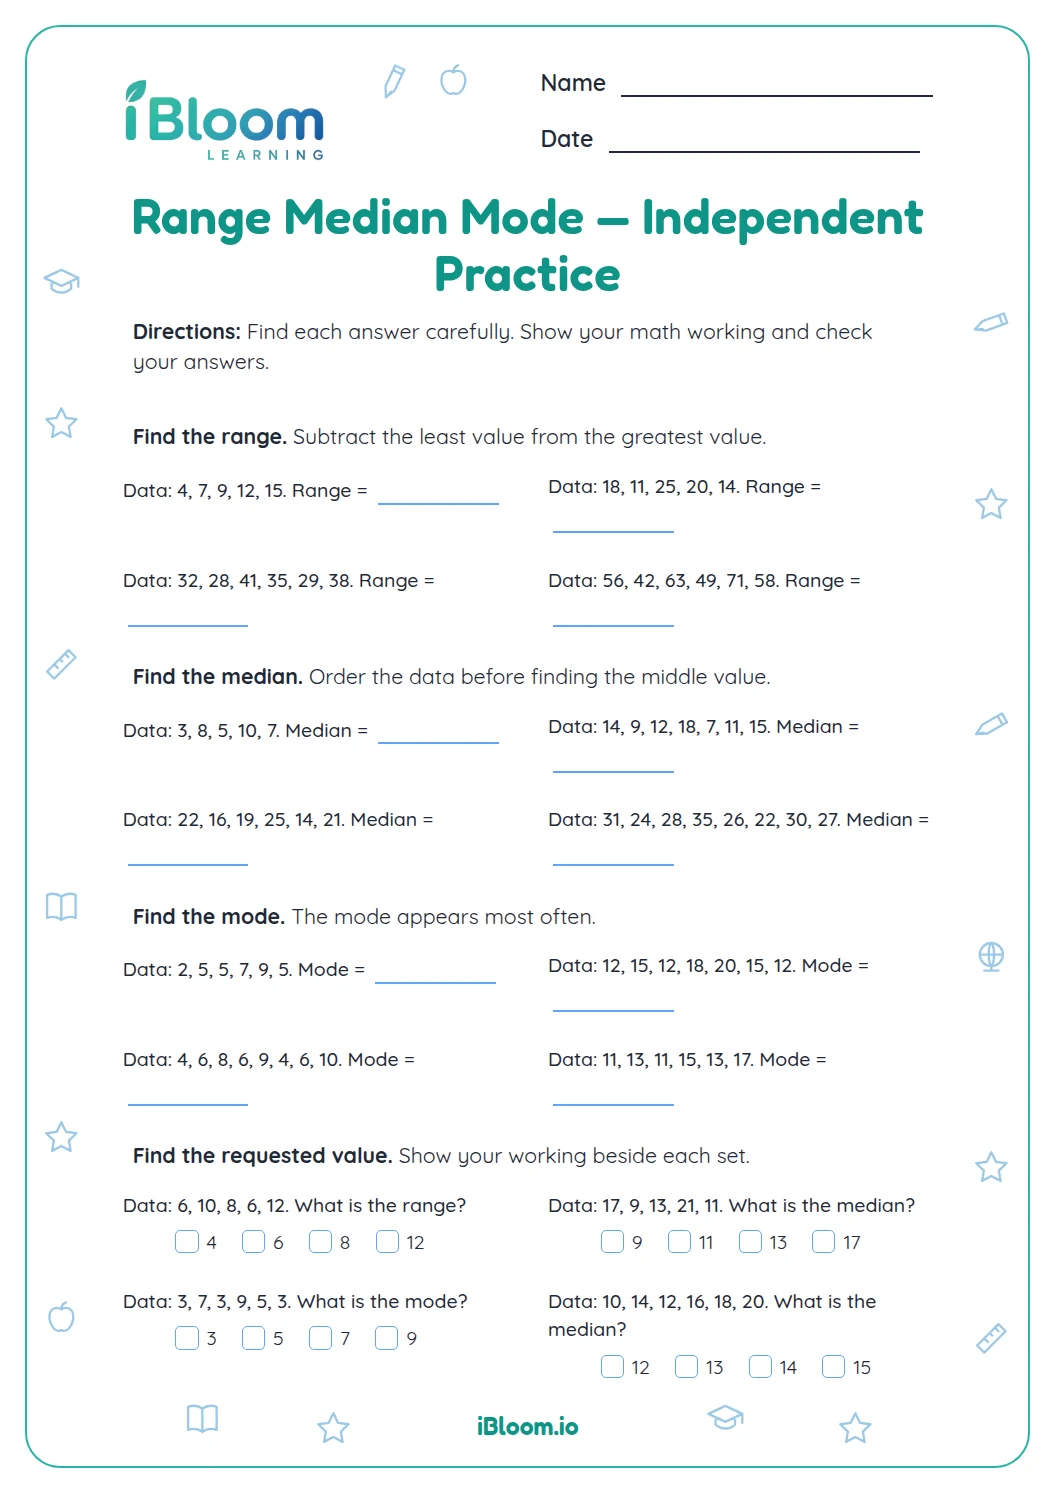
About this worksheet
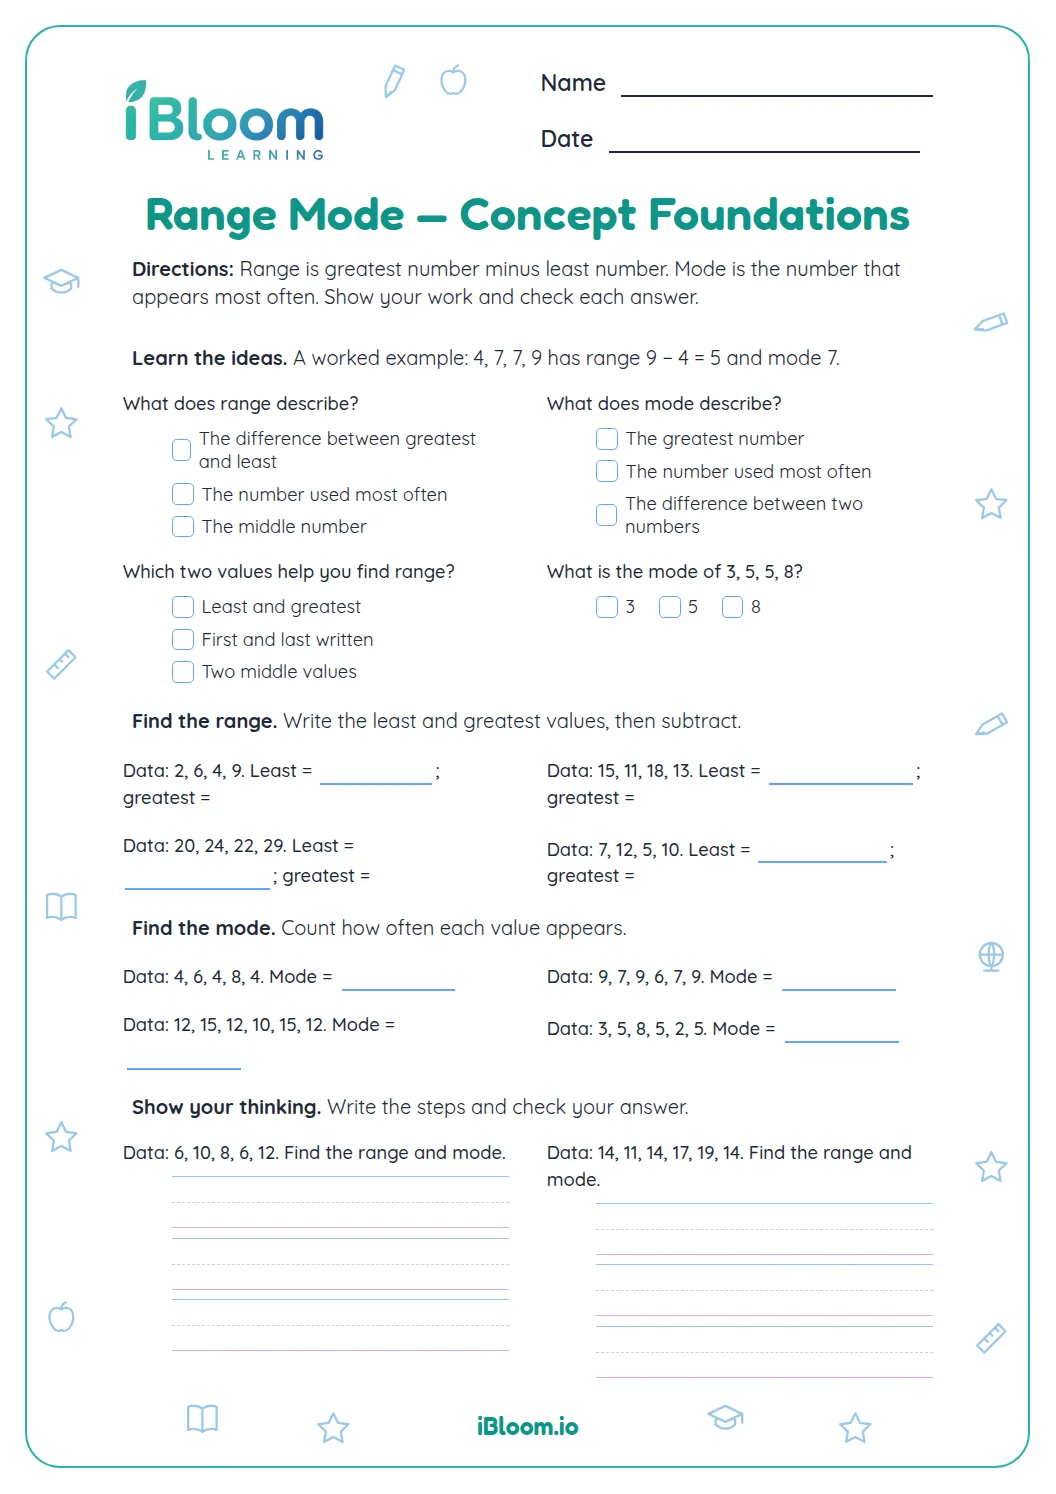
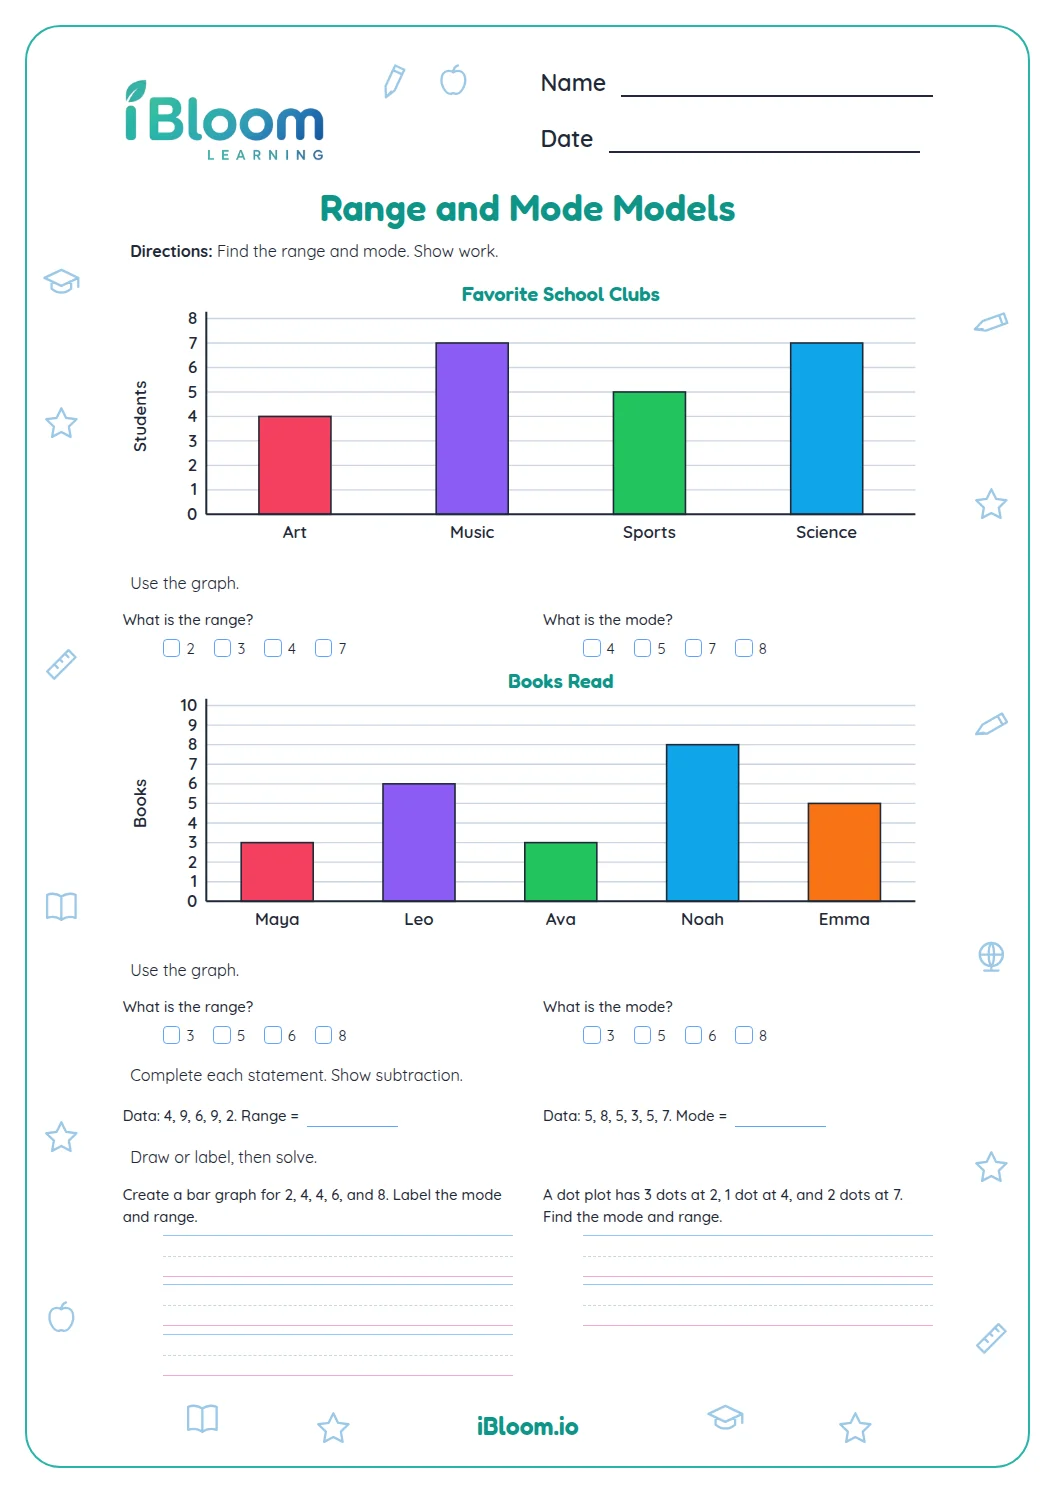
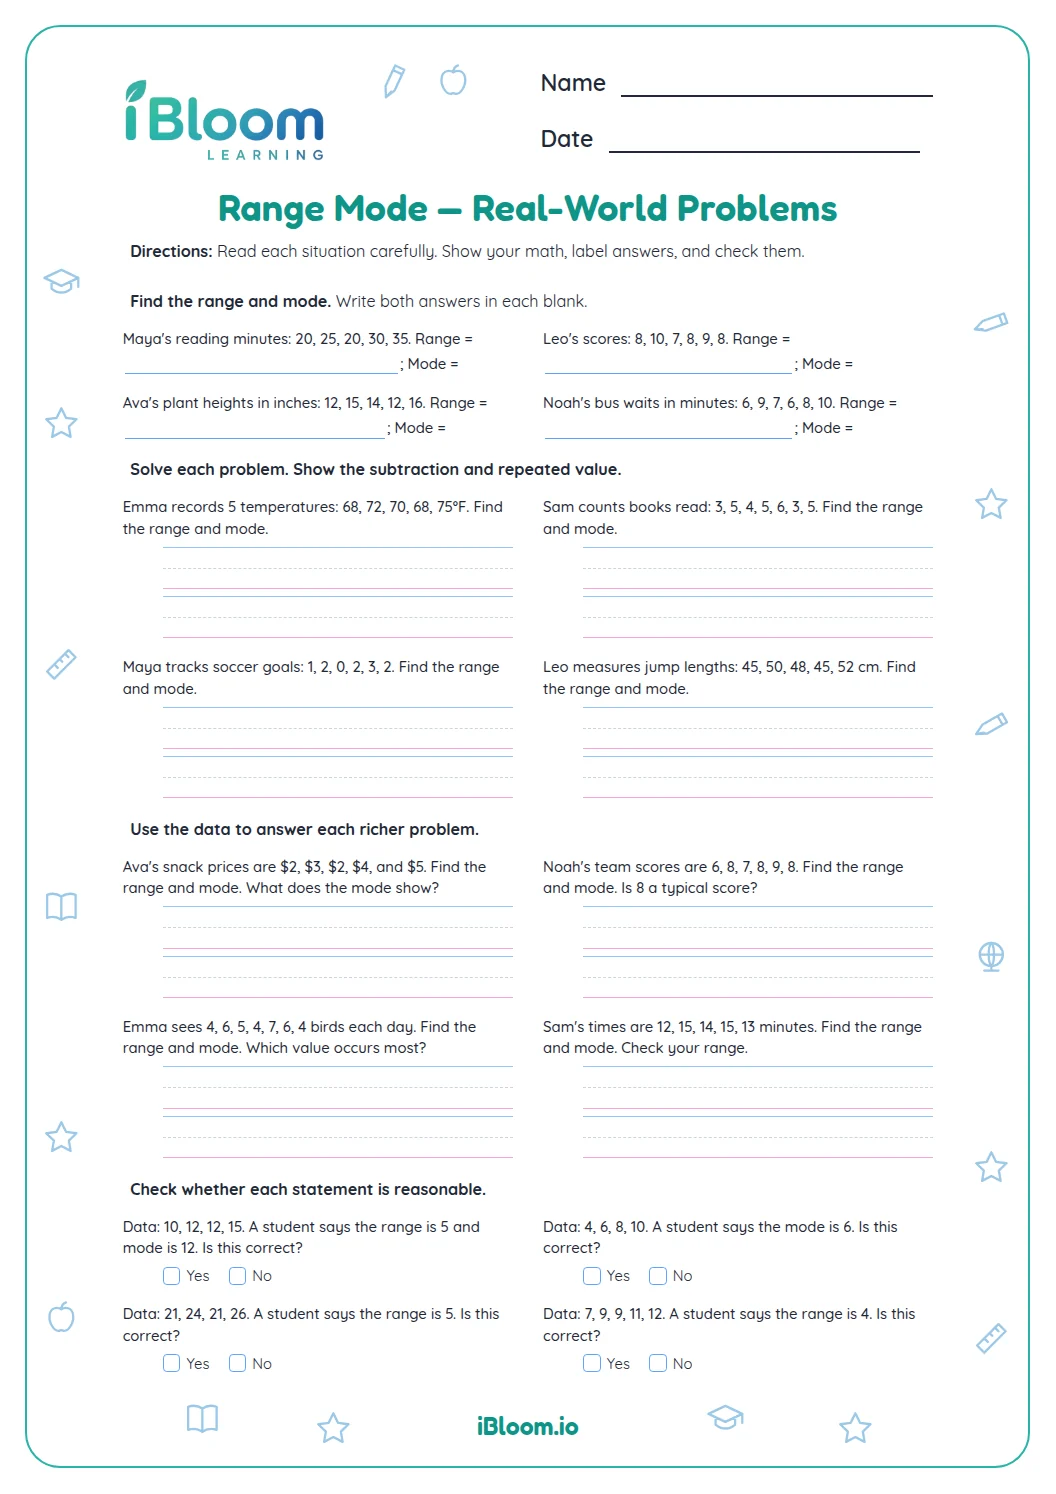
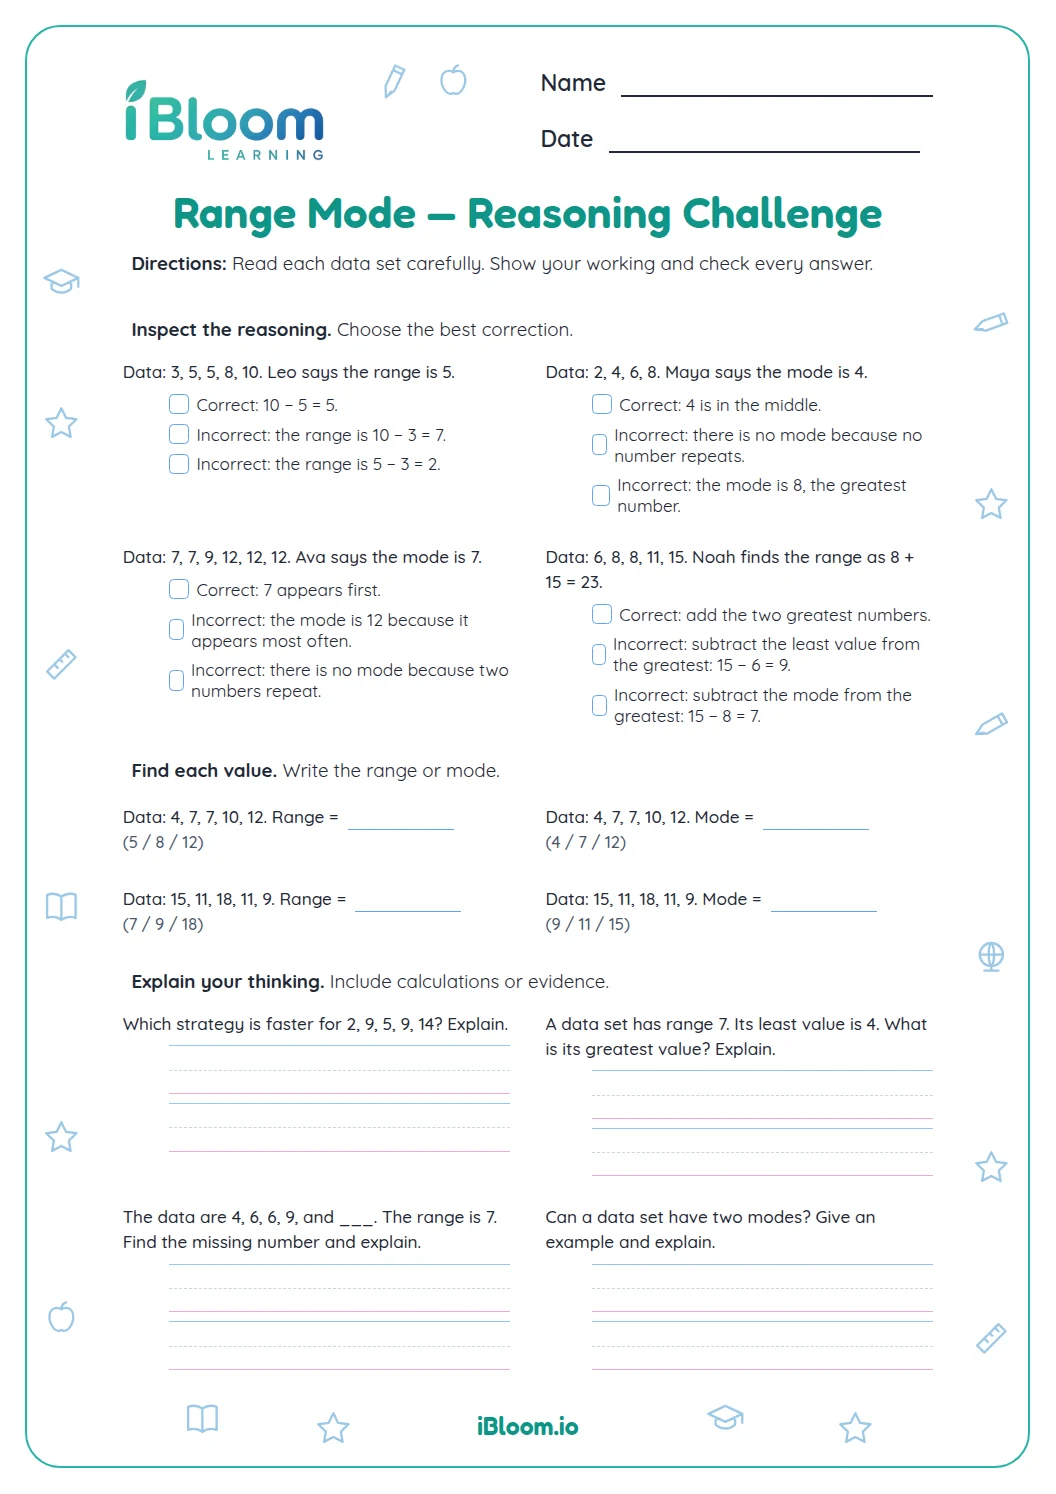
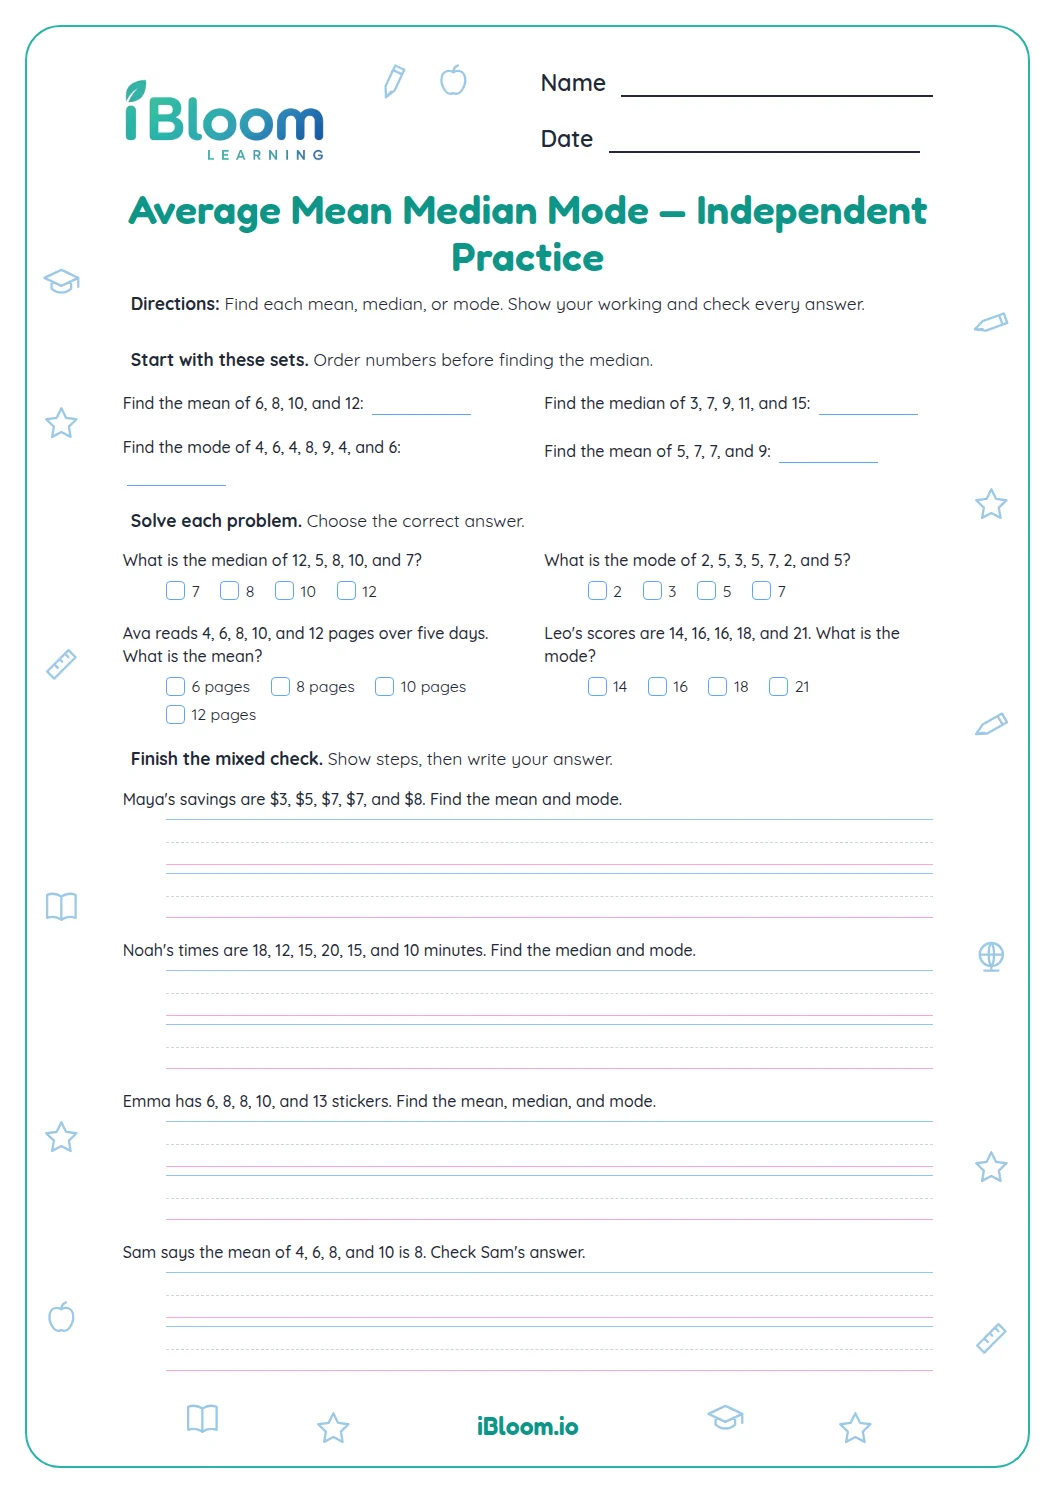
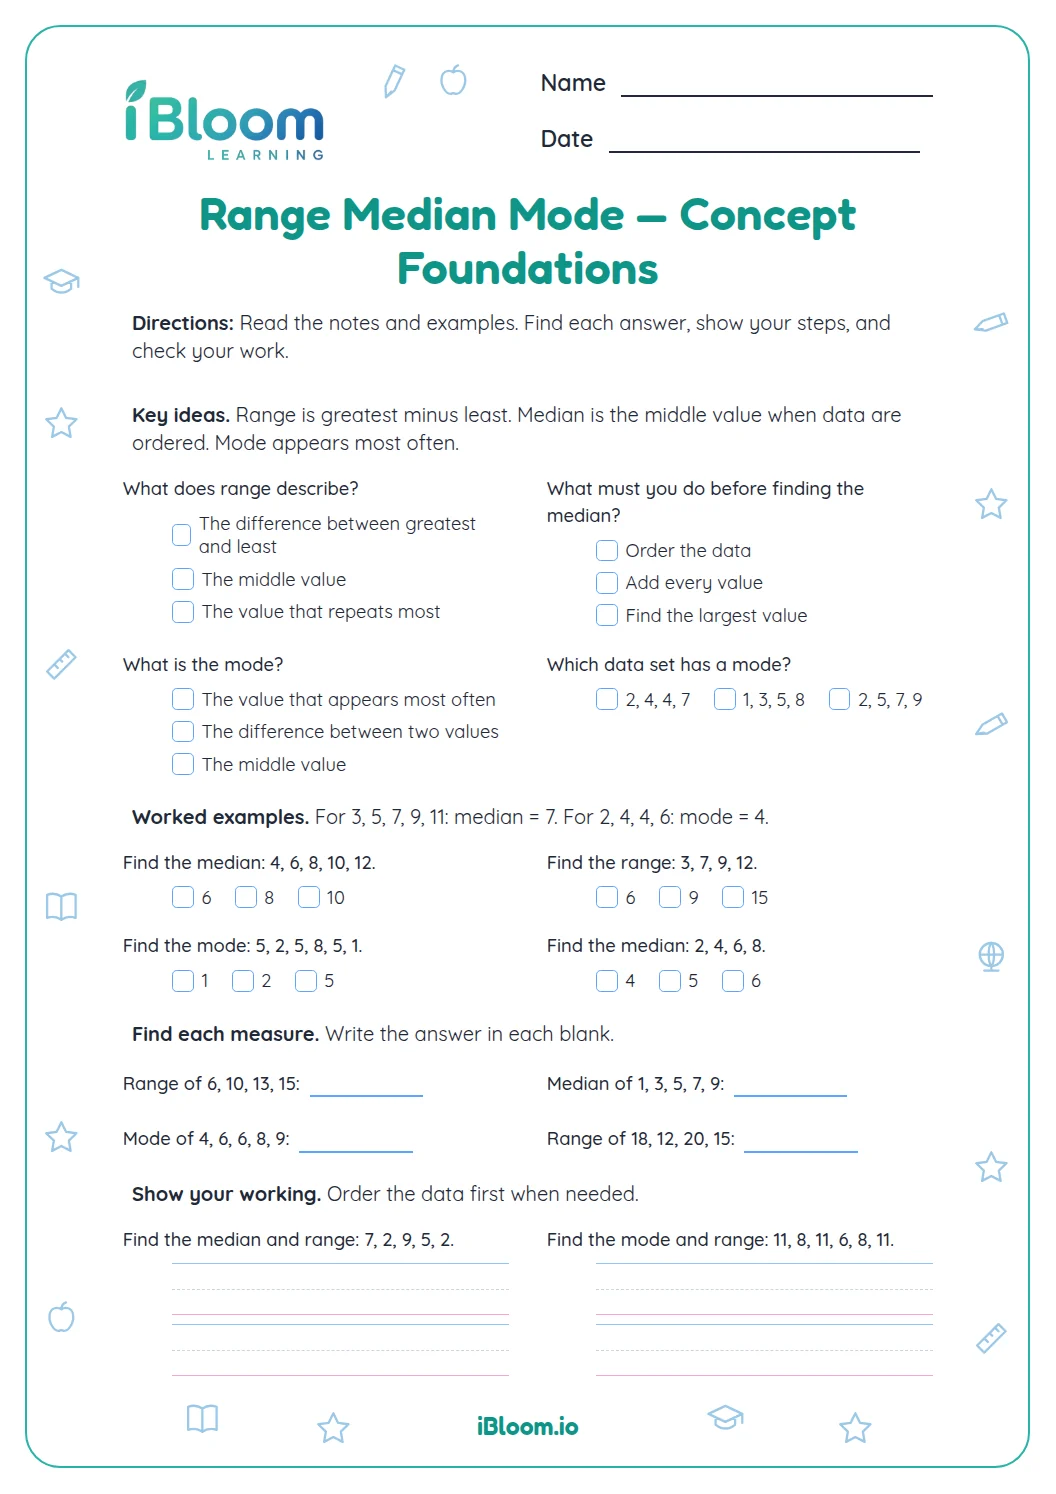
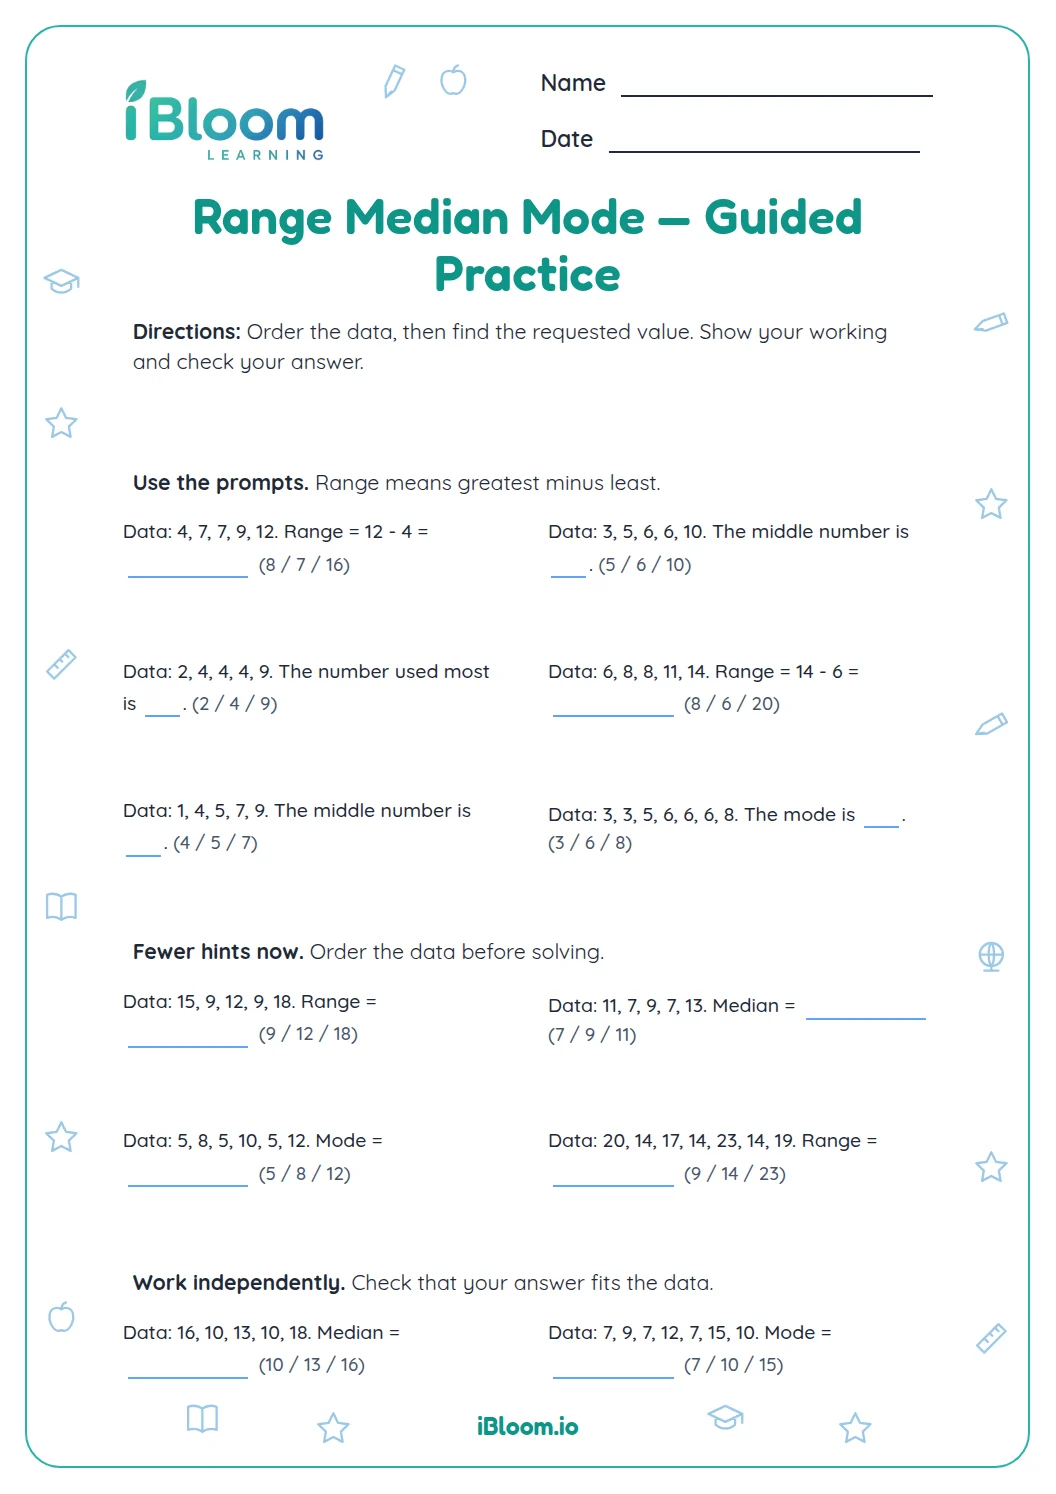
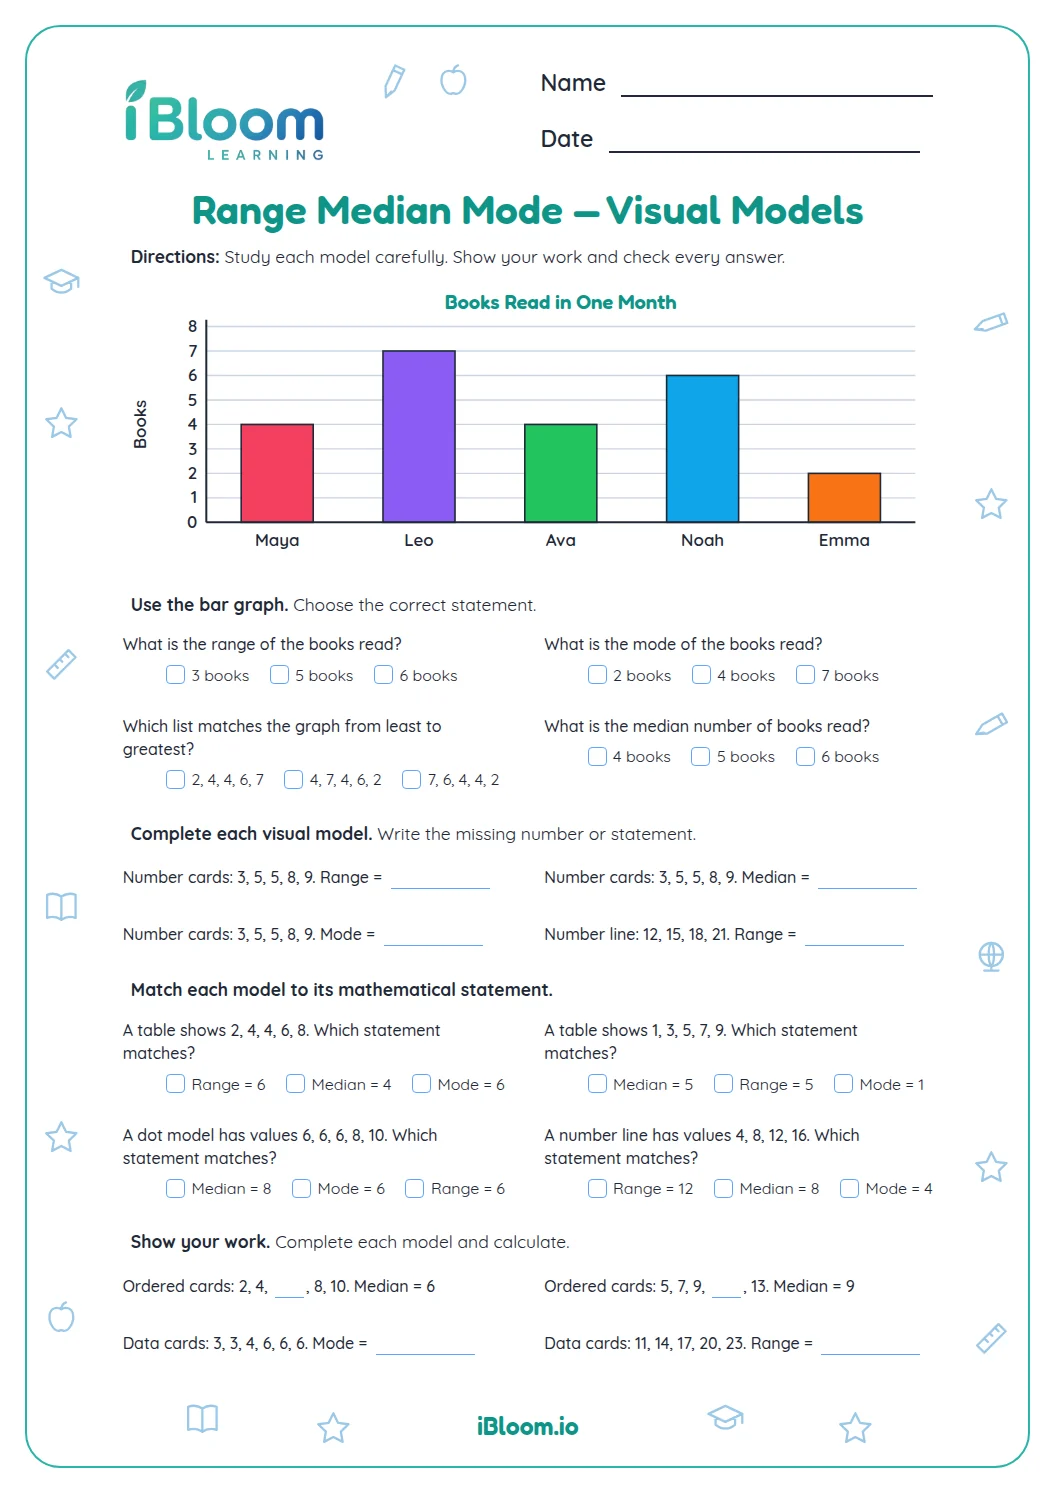
This printable gives Grade 5 learners independent practice finding range and mode. The first two parts use number sets; the final part uses line plots so children read the values from a visual before finding the requested measure. The 16 questions focus on how a data set varies and which value occurs most often, concepts described in CCSS 6.SP.A.3. A separate key lists the values to check.
Aligned to 6.SP.A.3
How do you find the range?
Find the greatest and least values, then subtract the least from the greatest. Part A gives eight data sets for this calculation.
- 14, 7, 7, 9, 12 → 12 − 4 = 8
How do you find the mode?
Count how often each value appears. The mode is the value that appears most often; the direct sets in Part B each have one clear mode.
What do the line plots add?
In Part C, each X mark represents one data value. Read the leftmost and rightmost values for range, or count the tallest stack of X marks for mode.
How to use this worksheet
- 1For range, find the smallest and largest values first.
- 2Subtract the smallest value from the largest.
- 3For mode, count how many times each value appears.
- 4On a line plot, count each X mark as one data point.
- 5Check the answer key after completing each part.
Range and mode slips to watch for
The mistake
Subtracting the greatest value from the least.
The fix
Write greatest − least so the range is positive.
The mistake
Choosing the largest number as the mode.
The fix
Count repeats; mode depends on frequency, not size.
The mistake
Reading a line-plot label as a data point.
The fix
Each X is one observation; the axis label marks its value.
Common Core alignment
The practice connects range and mode with describing how numerical data vary and are summarized.
Range describes spread and mode identifies a common value in each data set.
On this sheet:
Show the official wordingHide the official wording
Recognize that a measure of center for a numerical data set summarizes all of its values with a single number, while a measure of variation describes how its values vary with a single number.
What to practice next
Make more practice
Further reading
Questions parents and teachers ask
How is range different from mode?
Range describes the distance from the least value to the greatest value. Mode is the value that appears most often. The worksheet practices both ideas first in number sets and then with line plots, where X marks show how often each value occurs.
How should a learner find a range?
Locate the smallest and largest values, then subtract the smallest from the largest. For example, the set 4, 7, 7, 9, 12 has a range of 8 because 12 minus 4 equals 8. The first section gives several data sets to practice this calculation.
What does each X mean on a line plot?
Each X mark stands for one observation at the value written below it. To find a mode, count the stacks and choose the value with the most X marks. To find range, use the leftmost and rightmost plotted values.
Does every set have one mode?
Not always, but the worksheet’s data sets are chosen to have one clear mode. If two values share the greatest frequency, a data set can have more than one mode; none of these questions uses a tie. Count each value before choosing the mode. Check the counts carefully.
Does the worksheet include an answer key?
Yes. The separate answer key lists the range or mode for all 16 items. For line-plot questions, check the plotted X marks as well as the answer so the calculation matches the values shown. Each mark represents one observation at the labeled value.