




About this worksheet
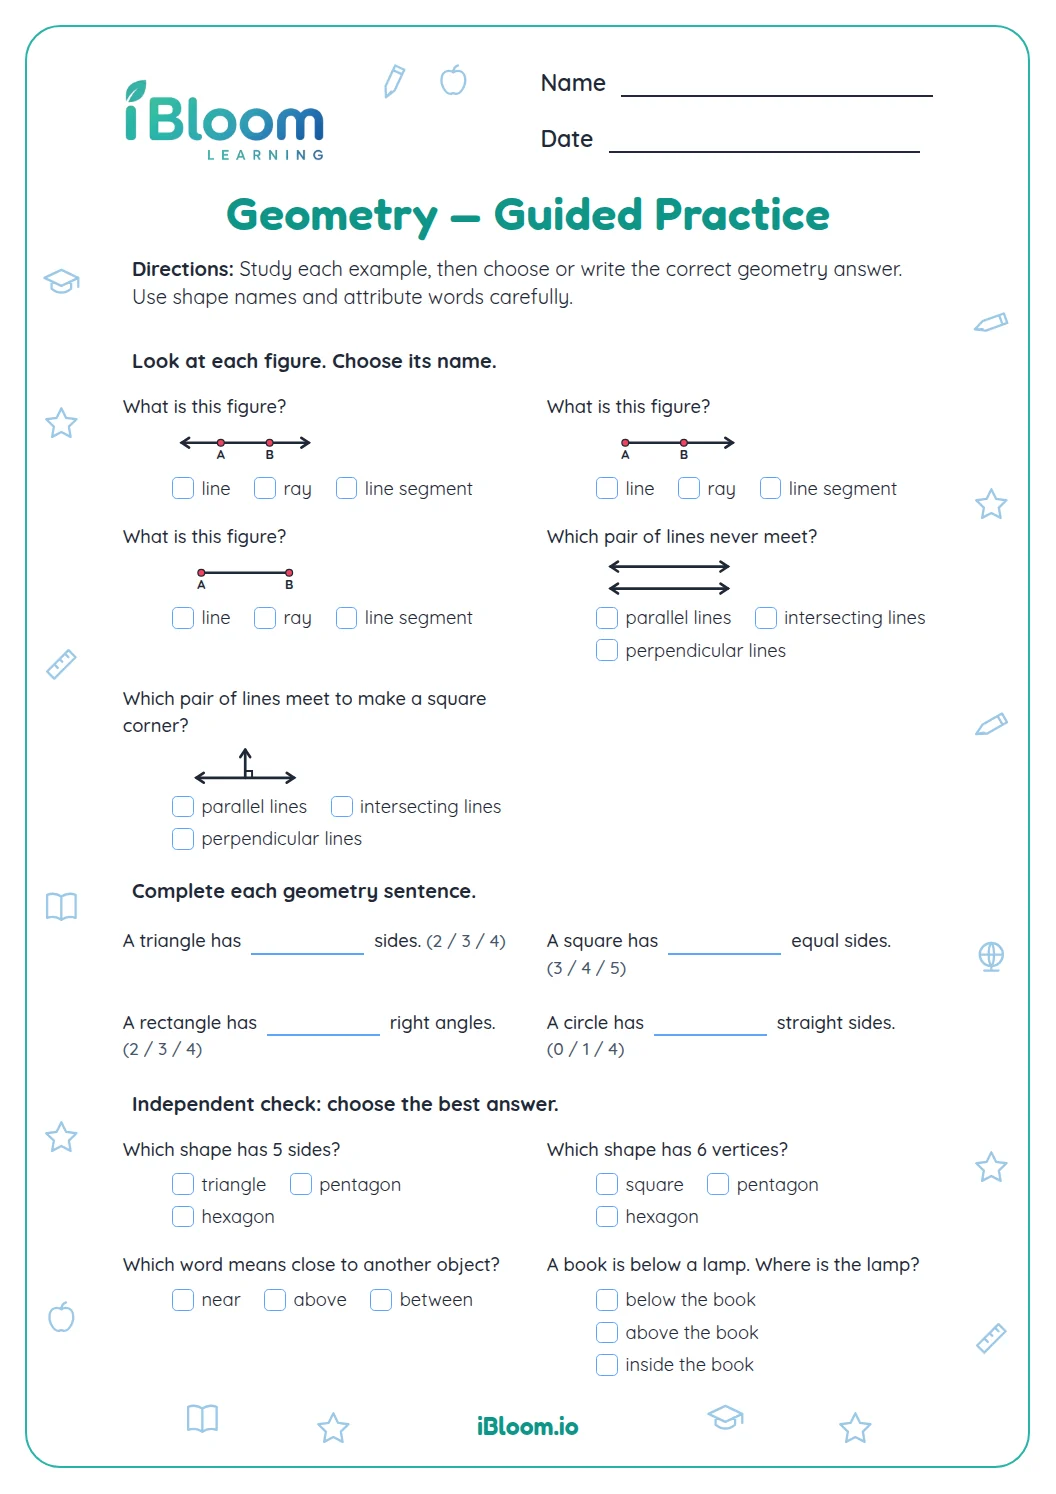
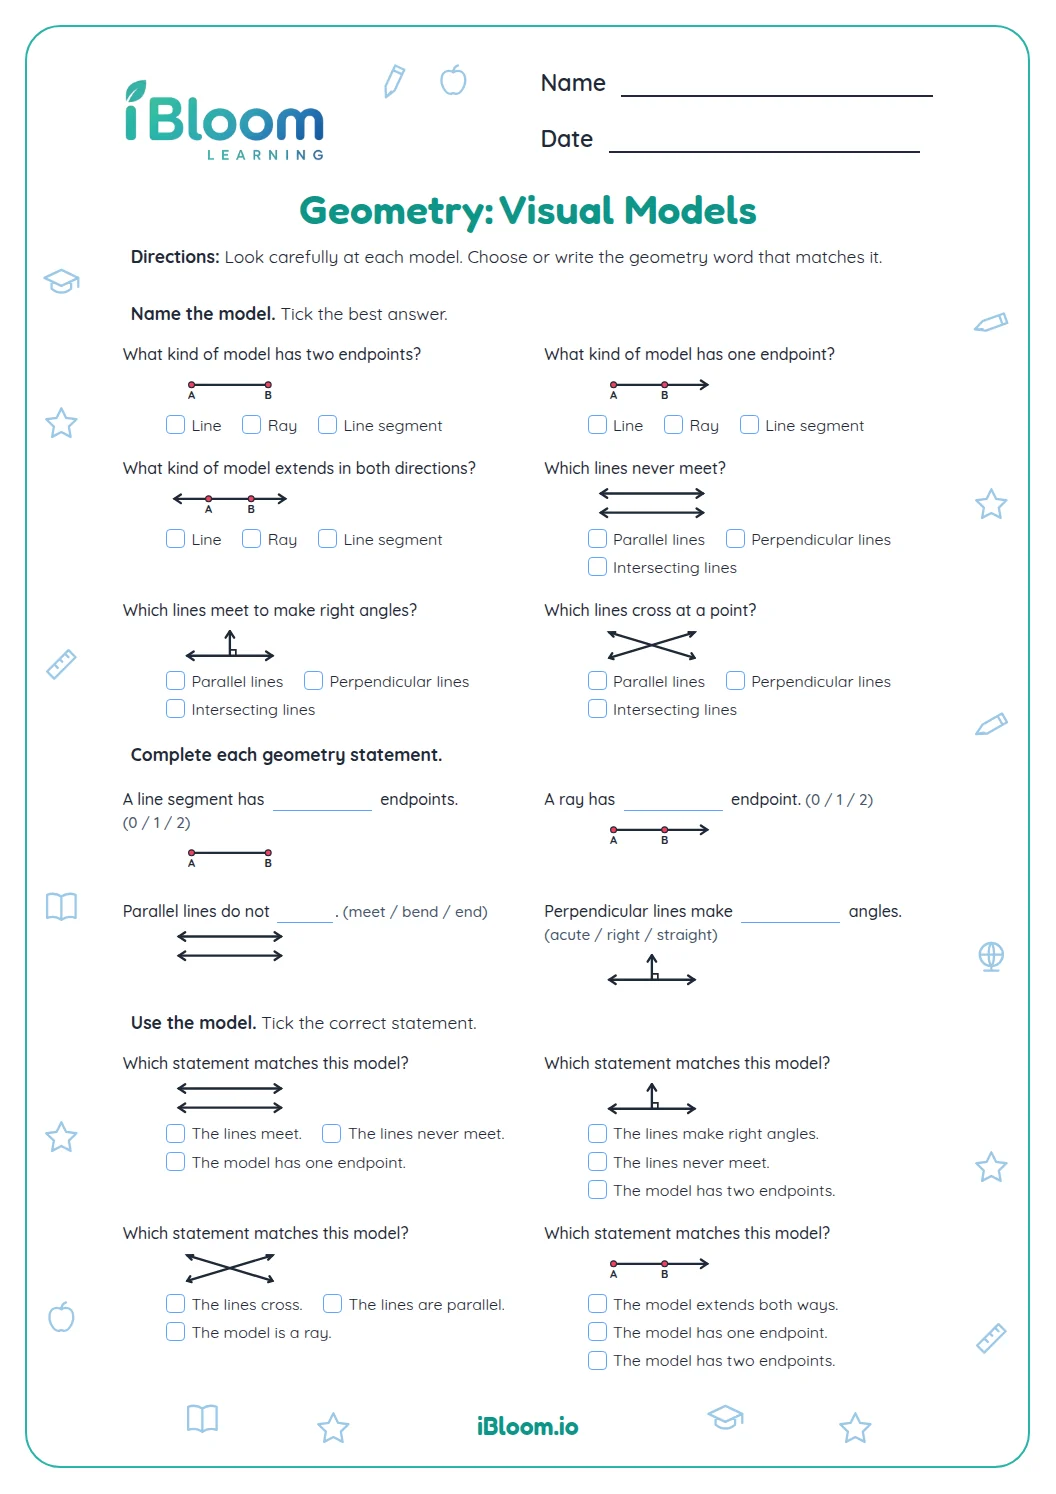
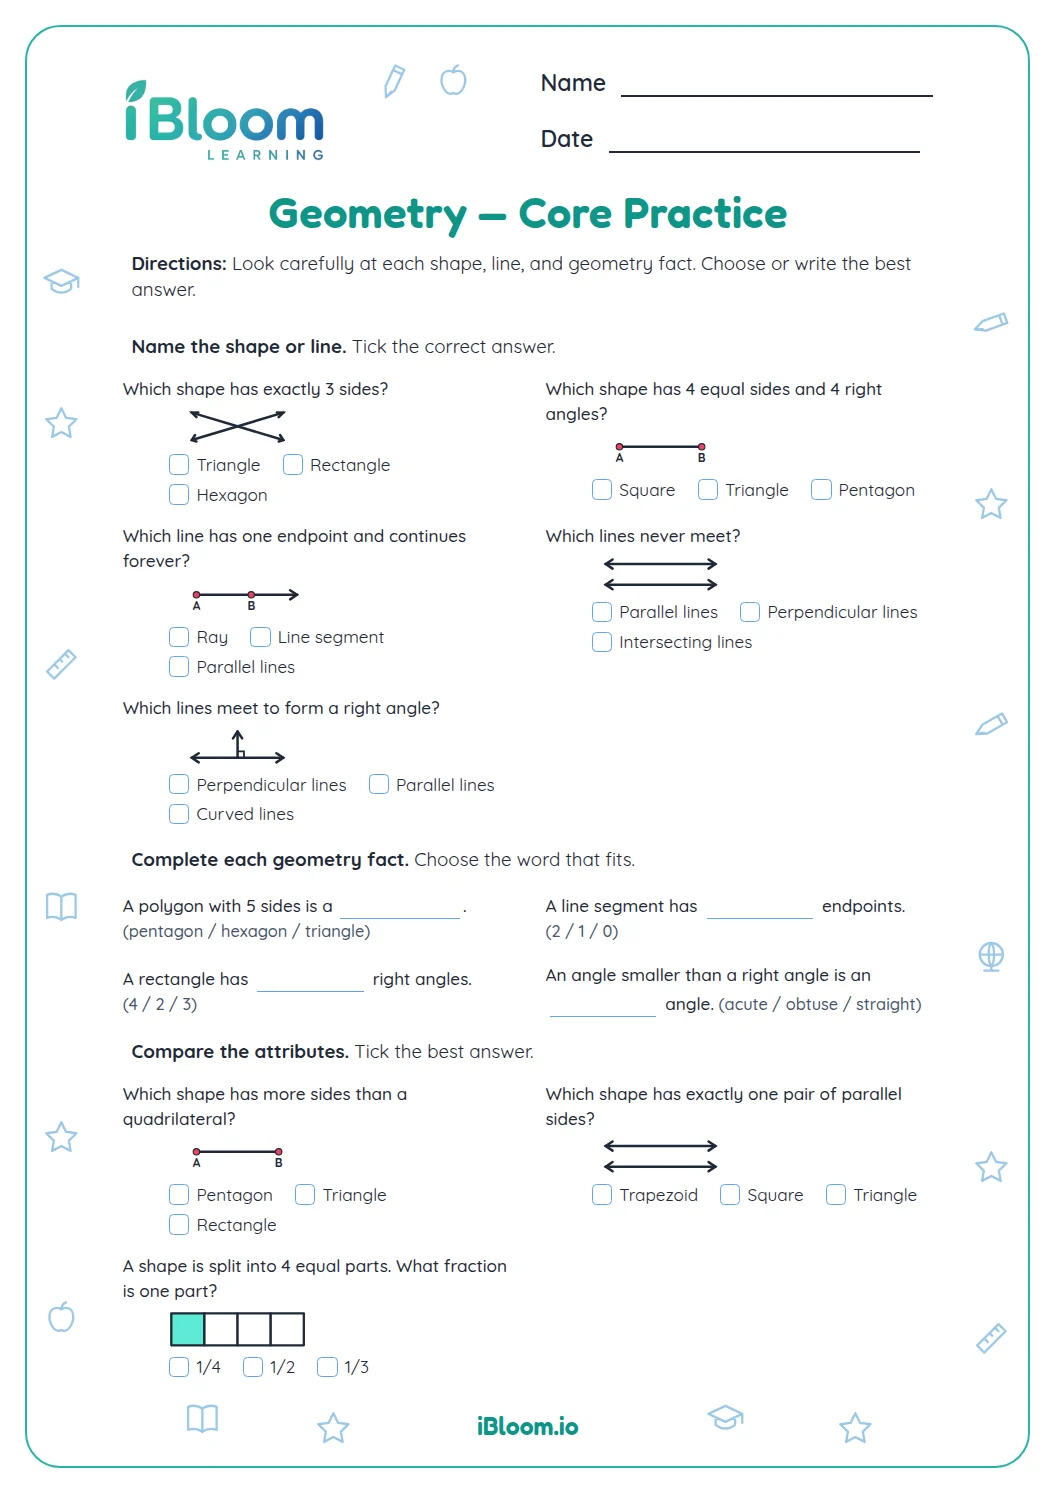
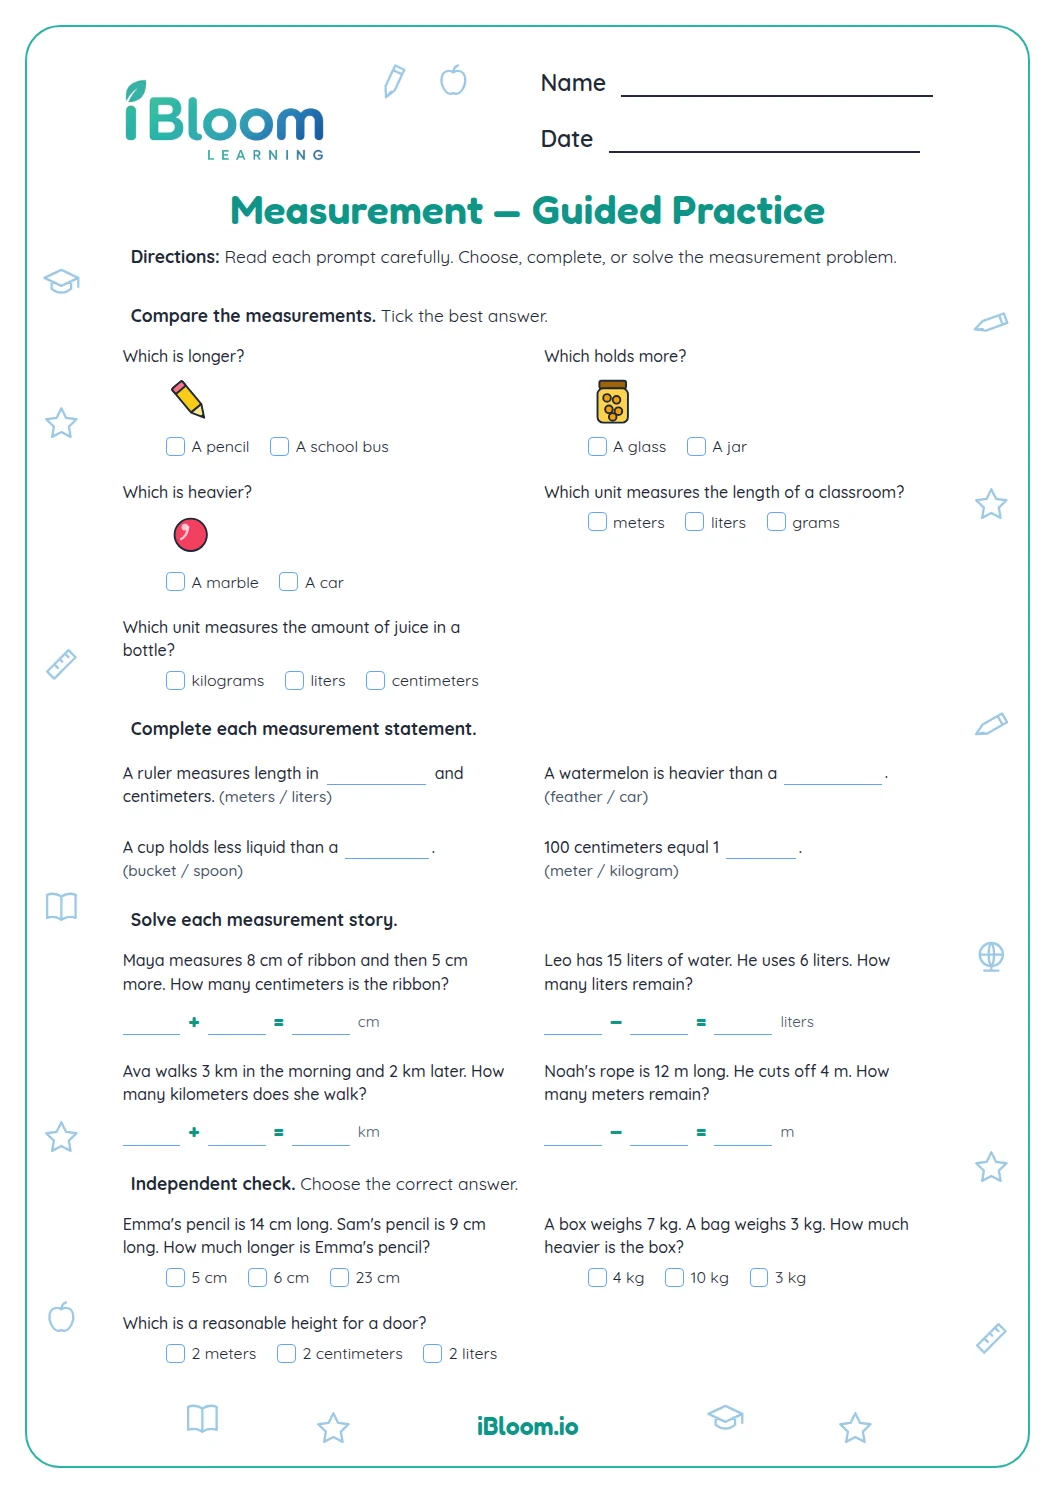
This free Grade 4 geometry worksheet has 14 questions on shape properties, angle types, area, and perimeter. Learners classify figures, use angle measures, and calculate with rectangle dimensions. A separate answer key shows the answers. The sheet practices CCSS 4.G.A.2 for classifying figures and 4.MD.A.3 for rectangle area and perimeter.
Aligned to 4.G.A.2 and 4.MD.A.3
How can shape properties help classify a figure?
Use side and angle properties to sort figures. A parallelogram has two pairs of parallel sides; a trapezoid in this worksheet has exactly one pair. A square has four equal sides and four right angles.
- 1Shape A has two pairs of parallel sides.
- 2That property identifies it as a parallelogram.
- 3Choose “Parallelogram.”
How do you name an angle?
Compare the measure with 90°. Less than 90° is acute, exactly 90° is right, and more than 90° but less than 180° is obtuse. Question 4 shows a 125° angle, so it is obtuse.
How do area and perimeter differ?
Area counts square units inside a rectangle, so multiply length by width. Perimeter measures the distance around it, so add all side lengths. An 8-by-3 rectangle has area 24 square units.
- 1Rectangle dimensions: 8 units by 3 units
- 2Area = length × width
- 38 × 3 = 24 square units
How to use this worksheet
- 1Name the shape or angle clue before choosing.
- 2For angle questions, compare with 90 degrees.
- 3For area, multiply length by width.
- 4For perimeter, add the outside side lengths.
- 5Check that the unit and answer match the question.
Common mistakes and quick fixes
The mistake
Calling every four-sided shape a rectangle.
The fix
Check whether it has four right angles before choosing rectangle.
The mistake
Using perimeter when asked for area.
The fix
Look for square units inside, then multiply length by width.
The mistake
Calling 125° acute because it looks narrow on the page.
The fix
Use the stated degree measure: 125 is greater than 90, so it is obtuse.
Common Core alignment
This worksheet practices the following Common Core skill.
Classify figures using parallel or perpendicular lines and side or angle properties.
On this sheet: Questions classify shapes by parallel sides and identify angles by their measures.
Show the official wordingHide the official wording
Classify two-dimensional figures based on the presence or absence of parallel or perpendicular lines, or the presence or absence of angles of a specified size.
Apply rectangle area and perimeter formulas in mathematical problems.
On this sheet: Questions find rectangle area and perimeter from side lengths.
Show the official wordingHide the official wording
Apply the area and perimeter formulas for rectangles in real world and mathematical problems.
What to practice next
Make more practice
Further reading
Questions parents and teachers ask
What kinds of geometry questions are on the sheet?
The 14 items ask learners to classify figures, name angle types, and calculate area or perimeter. Later questions apply those ideas to side lengths and shape properties. The separate answer key gives the correct choice for each item.
How can I help with the angle questions?
Have your learner compare each angle measure with 90 degrees. Question 4 gives 125°, which is greater than 90° and less than 180°, so it is obtuse. Question 5 gives 90°, so it is a right angle. The degree measure is printed in each prompt.
How do area and perimeter differ here?
Area measures the space inside a rectangle in square units; perimeter measures the distance around it in units. For the 8-by-3 rectangle in question 6, multiply 8 by 3 to get 24 square units. The perimeter items ask for the outside lengths added together.
Does the worksheet include an answer key?
Yes. The printable includes two worksheet pages followed by two answer key pages. The key lists each answer, so an adult can check the work after the learner has completed the questions. It also makes it easy to review the shape property or calculation behind a missed item.
What can learners try next?
After this review, learners can practice measurement or data graphing from the linked math topics. Measurement extends the use of lengths and units; data graphing shifts to reading and comparing values. Both keep the focus on using mathematical information to support an answer.