







About this worksheet
This Grade 1 science worksheet pairs a weather bar graph with short observation clues. Students read a recorded weather count, then classify 13 clues as sunny, cloudy, rainy or windy. It includes 14 questions and a separate answer key. The graph makes the counts visible, while the clues connect weather words with conditions children can observe.
Aligned to K-ESS2-1
What can students read from the weather graph?
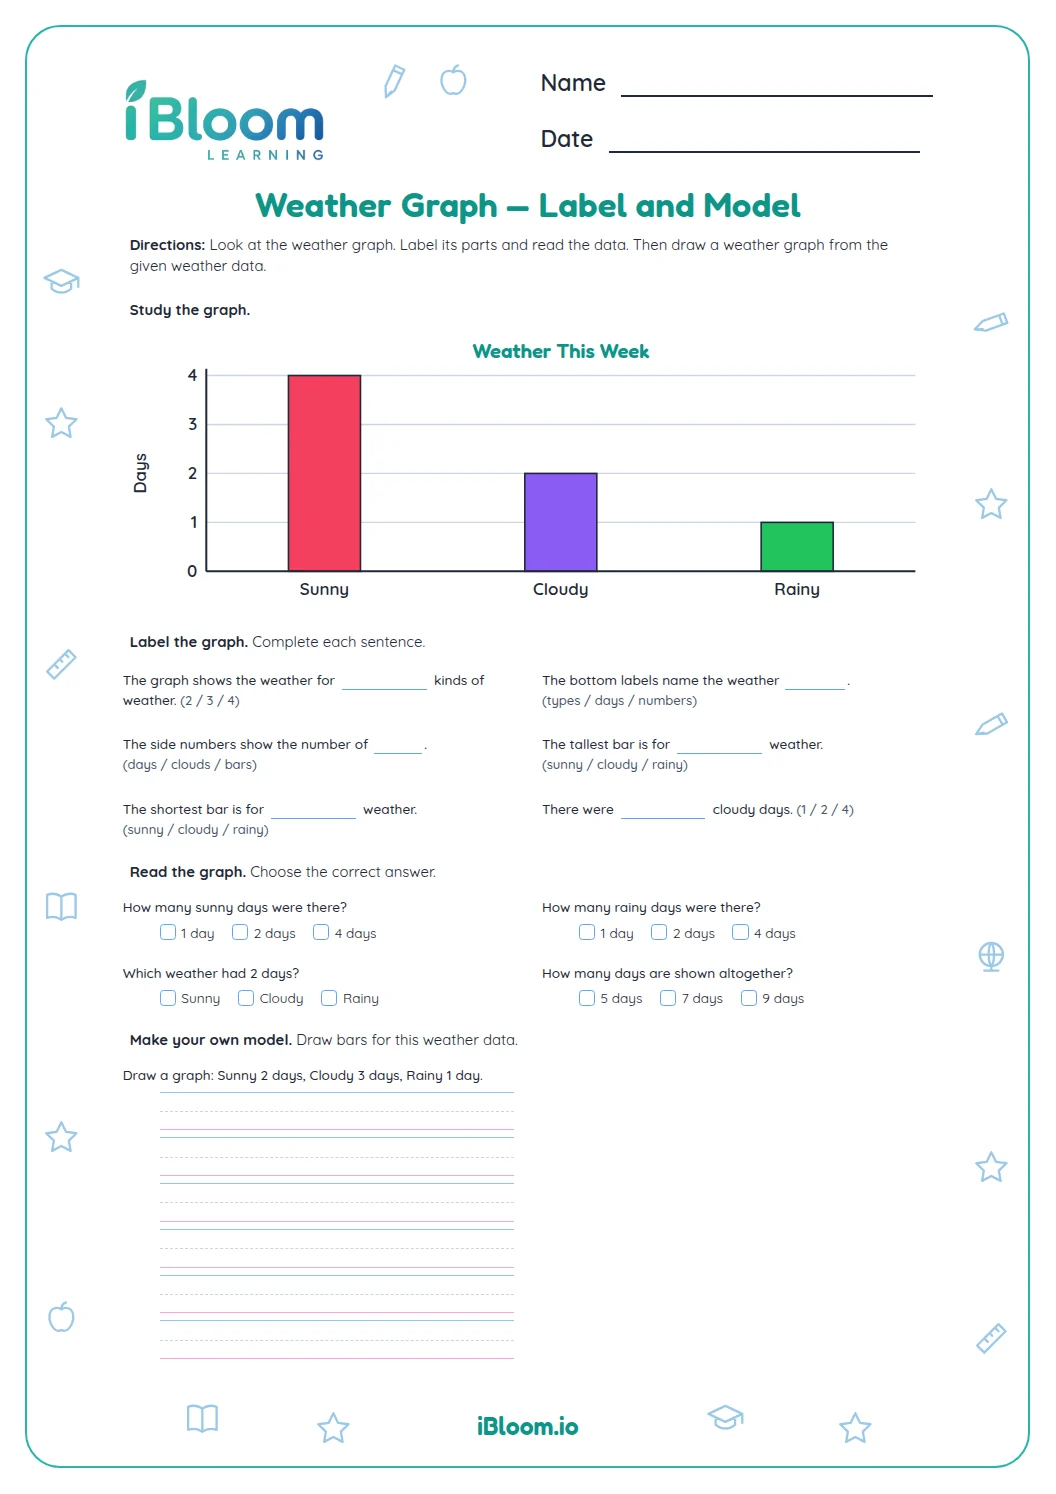
A bar graph records a week of observations in four categories: sunny, cloudy, rainy and windy. Students read a category count directly from its bar.
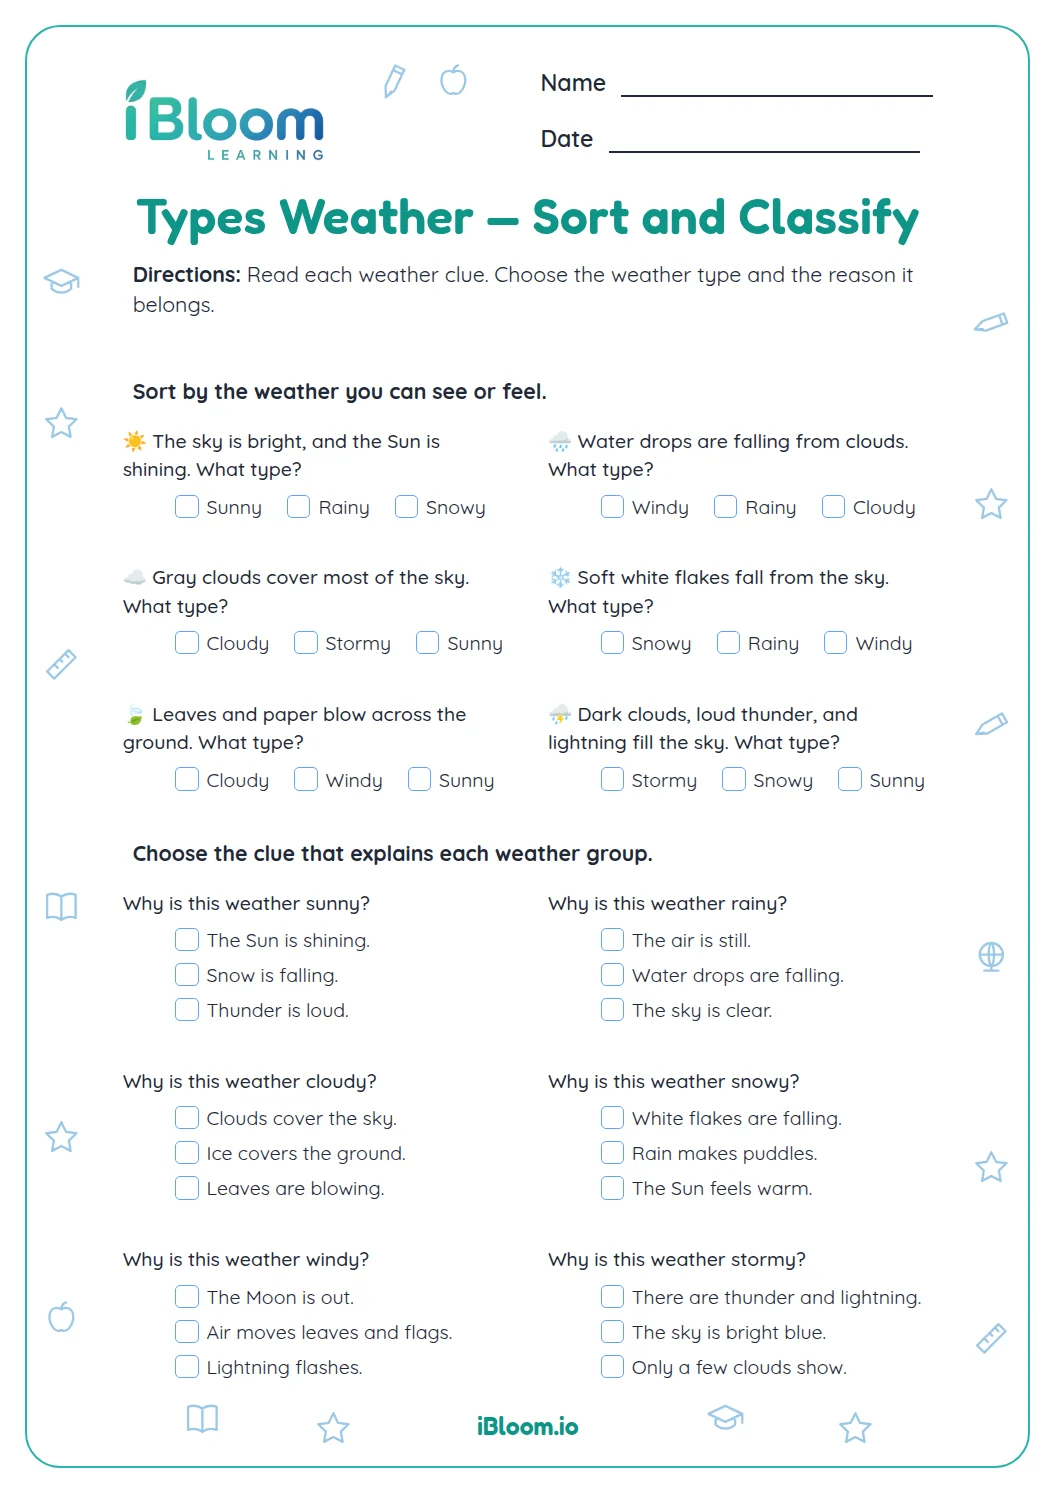
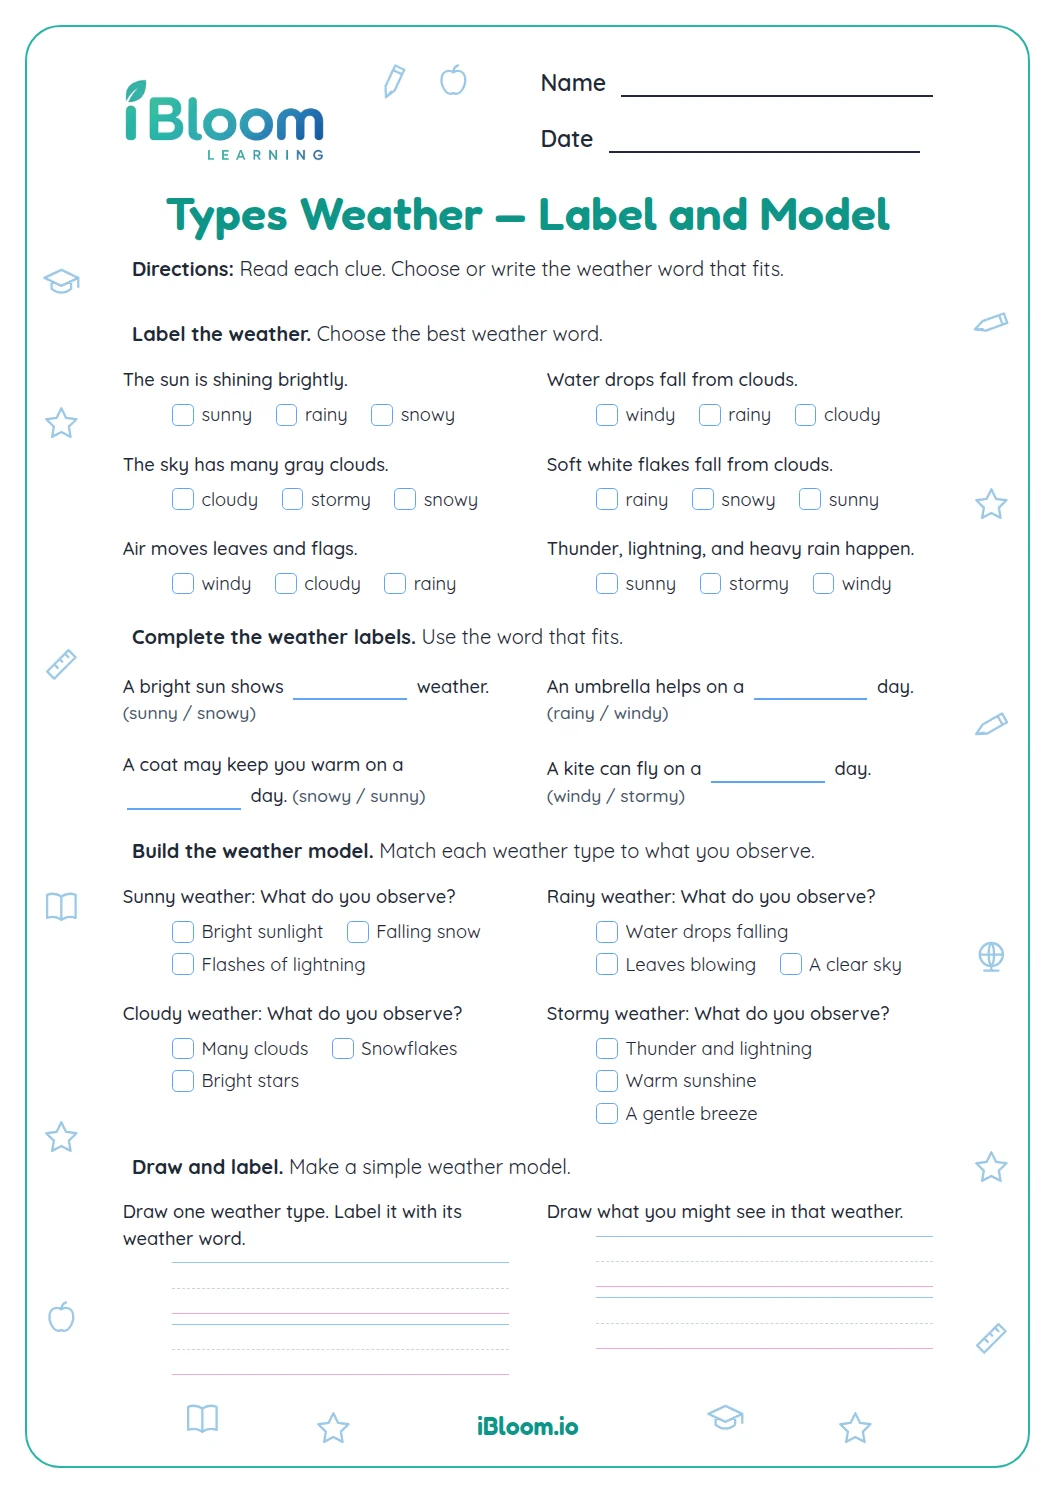
Thirteen short clues ask students to match an observable condition with a weather word.
- 1q1) How many sunny days were recorded? → 4
- 2The sunny bar reaches 4 on the number-of-days axis.
- Part A: read one count from the weather graph
- Part B: classify 13 weather observations
- The key lists a weather word for every clue
How do students classify a weather observation?
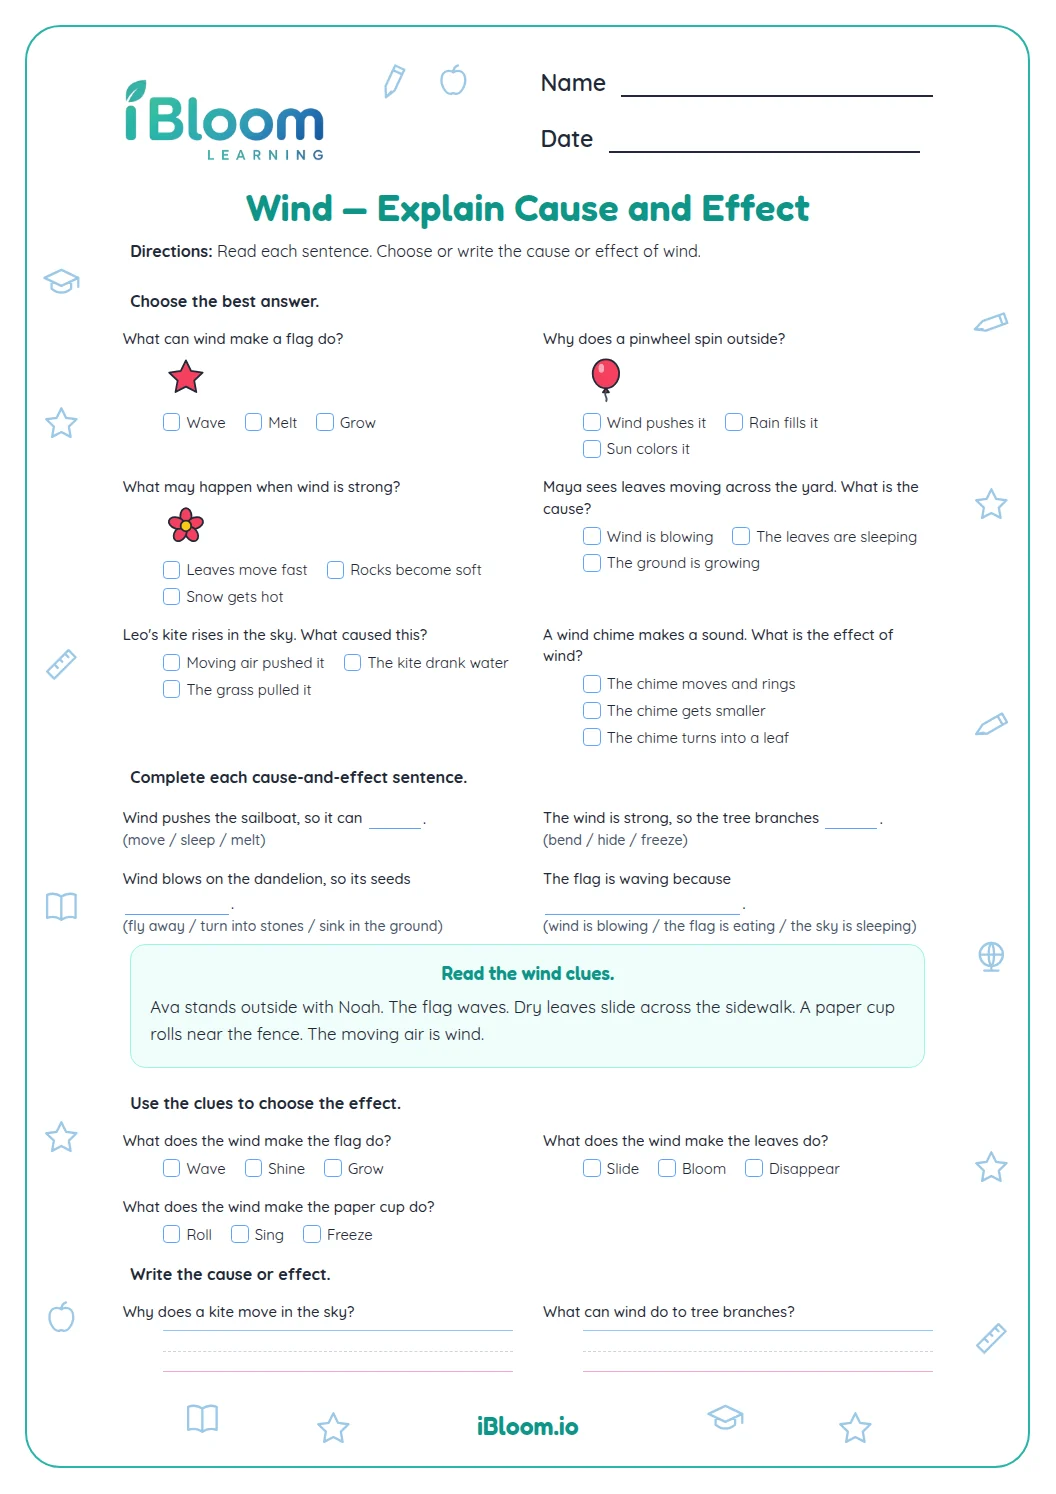
Look for the feature described. Water falling from clouds signals rainy weather; moving air that bends a flag signals wind. Several clues describe the sky or what the air is doing.
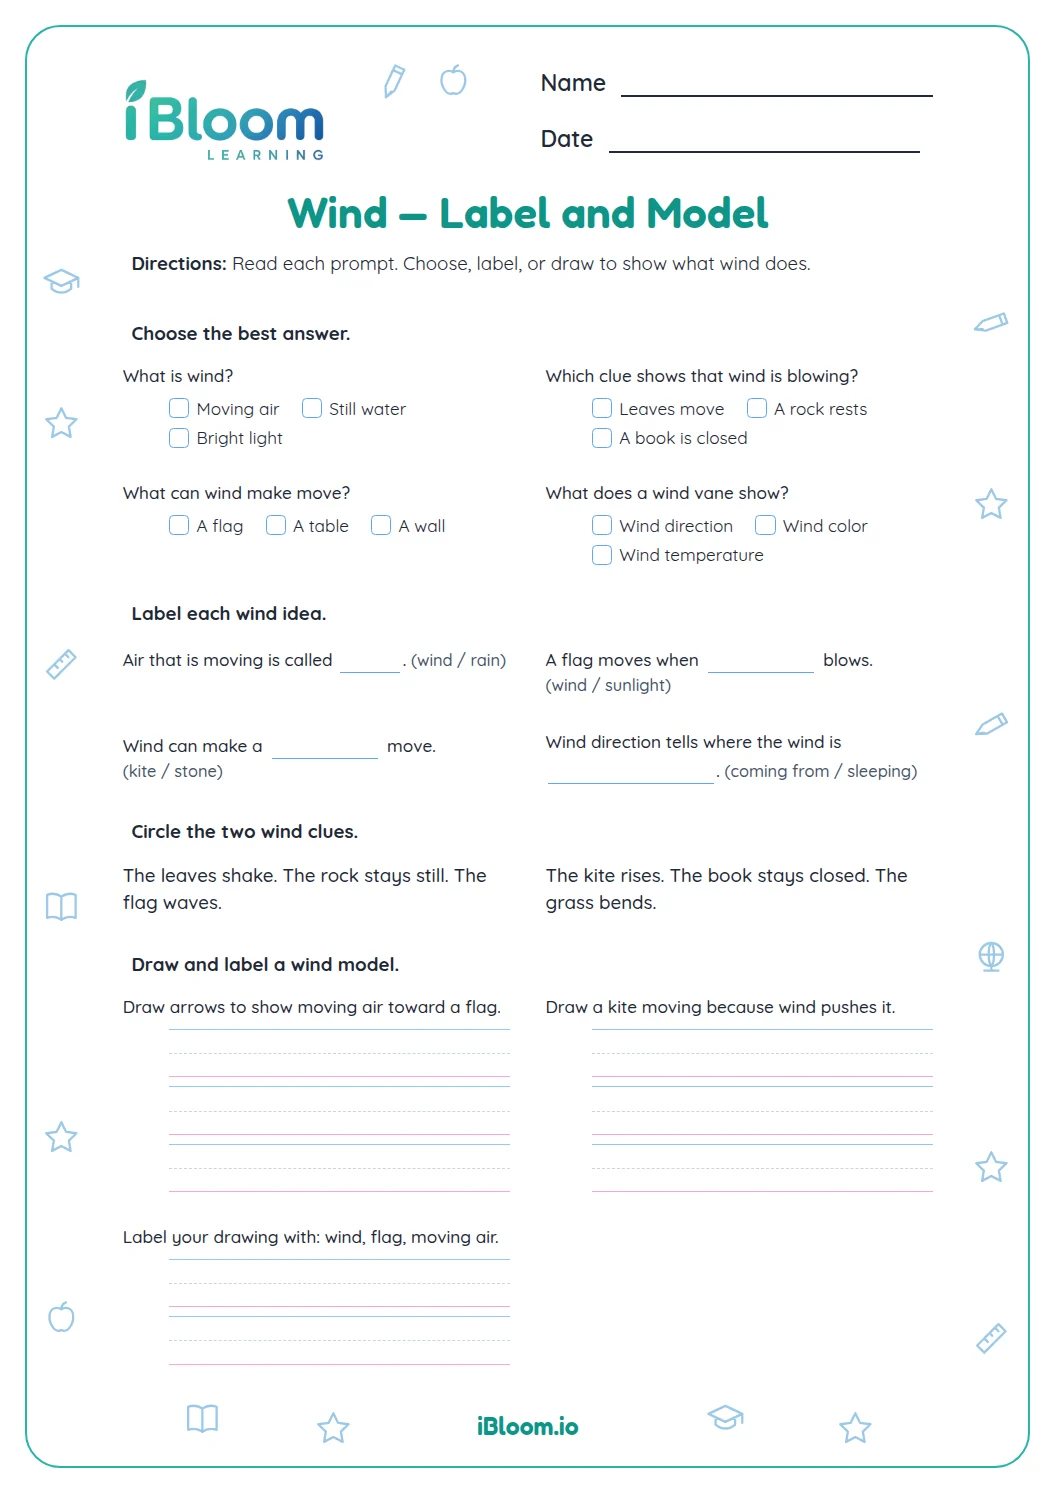
- 1“Moving air bends a flag.” → Windy
- 2The clue describes air in motion.
How can counts help describe weather?
Counts make observations easier to compare. A larger bar means that kind of weather was recorded on more days in this data set. A graph shows what happened during the recorded week; it does not promise what the weather will be next week.
How can families use the page?
Invite the child to point to the sunny bar and read its height from the number axis. For the classification half, connect each clue to an observation a child could notice outdoors.
How to use this worksheet
- 1Read the graph title and category labels.
- 2Find the bar named in the question and read its height.
- 3For comparison questions, compare the two counts or combine them.
- 4In Part B, underline the clue about clouds, rain or moving air.
- 5Check each answer with the key after finishing both parts.
Common mistakes and quick fixes
The mistake
Reading the label but not the bar height.
The fix
Trace the bar to the numbered gridline and read its count.
The mistake
Calling cloudy weather rainy because both involve clouds.
The fix
Rain means water is falling; cloudy only describes clouds covering the sky.
The mistake
Reading the number of weather categories instead of a bar’s height.
The fix
Follow the top of the bar across to the number axis to read its count.
Next Generation Science Standards alignment
Students use recorded weather observations to describe simple patterns.
Use weather observations and counts to describe patterns over time.
On this sheet: The graph compares counts of weather types, and the clues identify observed conditions.
Show the official wordingHide the official wording
Use and share observations of local weather conditions to describe patterns over time.
What to practice next
Make more practice
Further reading
Questions parents and teachers ask
Which kinds of weather are on the graph?
The graph shows four categories: sunny, cloudy, rainy and windy. Its bars record 4 sunny days, 2 cloudy days, 3 rainy days and 1 windy day. Students answer the printed question by reading the sunny bar, then use the other clues to classify weather observations.
What does “how many more” ask students to do?
“How many more” asks for the difference between two counts. Read the two bars, then subtract the smaller count from the larger one. The graph on this worksheet has one printed question about sunny days, so students can use the same comparison strategy when discussing its other bars.
How do students classify the weather clues?
Students choose the weather word that matches the observation. For example, water falling from clouds is rainy, and moving air that bends a flag is windy. The clue should match the observable condition. The classification prompts describe observable weather clues rather than asking students to infer temperature or a forecast.
Is the graph based on real local weather?
The graph is a practice data set printed on the worksheet. It gives students consistent counts to read and compare, while Part B uses familiar descriptions of weather conditions. The values are fictional practice data, not a report from a named place. Students can collect their own observations for comparison.
How many questions and pages are included?
There are 14 questions: one question about the weather graph and 13 weather classifications. The worksheet spans two pages, followed by a separate two-page answer key. The graph is printed with its question, and the other prompts ask students to match a weather word to an observation.